Technology Trends for Spatial Data Infrastructure
in Africa
Collins Mwange*, Galcano Canny Mulaku, David Siriba
Department of Geospatial and Space Technology, University of Nairobi, Kenya
Copyright©2018 by authors, all rights reserved. Authors agree that this article remains permanently open access under the terms of the Creative Commons Attribution License 4.0 International License
Abstract
Over the past few years, several technology trends, notably big data analytics, volunteered geographic information, cloud computing, free and open source software, internet of things, and linked data, have emerged. This study reviews the contribution of some of these trends to Spatial Data Infrastructure (SDI) development, particularly in Africa. A geospatial application based on Google Container Engine, an Infrastructure as a Service cloud, has been developed. Data was sourced from the 2015 Kenya Certificate of Primary Education, the Kenya school mapping project of 2007 from the Ministry of Education, Science and Technology, and Kenya’s administrative boundary layers from the Independent and Electoral Boundaries Commission. By using the cloud, several operations and analyses typically common in SDIs were carried out. In addition, a cost estimate of a cloud-based Kenya National Spatial Data Infrastructure deployment is presented. Although the new technologies may not necessarily lead to wider SDI adoption, the study shows that the trends can increase the chances of SDI development and adoption, by permitting highly scalable geoservices, and facilitating cost-effective free and open source software.Keywords Cloud, Spatial Data Infrastructure, SDI,
GDI, Africa, KNSDI1. Introduction
It is often argued that technical components are easier to deal with than the non-technical ones when developing SDIs [1]. Technology components, which are part of technical components, include access networks, geoportals, and technical standards.
In spite of being easier to deal with, a significant amount of financial resources are often expended in technical components. More significantly, technical components are the most visible in SDIs, facilitating effective communication with decision makers who are often keen to
ascertain their benefits using analysis techniques such as cost-benefit analysis.
There are several other reasons why consideration of technology components is important in SDIs. First, distributed network access through various applications and geoportals, is what makes spatial data more readily available to the end users. Second, ICT is one of the major drivers shaping and influencing SDIs. Third, the identification of trends that impact SDI can help in the development of policies to regulate and deal with any emergent issues [2]. Fourth, the low level of web connectivity and infrastructure in Africa could be contributing to the reported slow rate of SDI development [3].
Whilst some developing countries are still facing difficulties with their national SDIs (NSDIs), the technologies that support SDIs are advancing at a breath-taking pace. For instance, since the United States NSDI was initiated in the mid-nineties, data sharing technologies have advanced significantly, rendering the earlier SDIs almost obsolete [4]. Some researchers have questioned the dominant top down model which tends to render SDIs less capable of evolving with new trends [5], [6].
Contemporary SDIs face many challenges, serving as a stark reminder that SDI is complex and careful approach is needed in its development. Some of the reported challenges include: diverse user requirements which are often demanding and unknown; the need for SDI to support new and challenging functionality; user tasks which are unfamiliar to application developers; the lack of SDI interconnection and scalability; and reliance on ageing technologies [5], [7]. Thus, an understanding of the nature of the new trends may lead to better SDI development.
As at 2016, many African countries did not have mature and functioning SDIs: critically, they still lacked strong inter-agency coordination requisite for SDI development. Furthermore, Africa was still characterized by slow SDI development [8], which can be corroborated by the low number of NSDI geoportals on the continent.
This situation gives rise to several problems. First, there are very few NSDI geoportals in Africa, which SDI practitioners can use as a reference point in SDI development. The widespread availability of geoportals can also be useful in several ways, such as informing SDI practitioners of the key technologies and approaches to be considered. Second, the current technology landscape is characterized by rapid changes and choices, making it difficult to select the optimal choice. Third, although many successful national and regional geoportals are in operation, such as the South African Spatial Data Infrastructure (SASDI) and the Infrastructure for Spatial Information in the European Community (INSPIRE), the selection of an optimal technology choice may not be obvious.
The paper contributes to the SDI knowledgebase by reviewing the potential of the new technology trends to SDI development in Africa, with a view to answering the research question: how can technology trends promote development of SDI in Africa? Where possible, the potential and challenges of these technologies are reviewed.
After this introductory section, section 2 of the paper reviews literature related to Information Technology (IT) trends for SDI, focusing on the trends that African countries can use to promote wider adoption of their NSDIs. Section 3 discusses the methodology adopted in the study. The results and discussions are presented in section 4. Finally, section 5 outlines the conclusions from the study.
2. The IT Building Blocks of an SDI
2.1. Introduction
This section reviews literature on IT trends that have the potential to contribute and positively influence SDI development.
2.2. The IT Building Blocks of an SDI
2.2.1. Service Oriented Architecture (SOA)
SOA is a design pattern focusing on generic services that can be reused across heterogeneous and distributed applications. [9]. Based on the notion that components can be built as services, SOA facilitates the registration, discovery, and binding of services to create new applications.
There are two notable implementations of SOA: Simple Object Access Protocol (SOAP), and Representational State Transfer (REST). The latter is a set of architectural
principles that transmit data over Hypertext Transfer Protocol (HTTP) using request parameters, treating data as a resource which in turn is represented uniquely by a Uniform Resource Identifier (URI) [10]. SOAP, On the other hand, is a specification used for exchanging information in eXtensible Mark-up Language (XML) format using the HTTP POST request.
Implementations based on REST tend to be less complex than SOAP, implying that SDIs can derive more advantage by adopting the REST approaches. Geography Mark-up Language (GML) is the publication of spatial data according to predefined data specifications, and is a common data sharing format in SOA-based SDIs.
2.2.2. The Open Geospatial Consortium (OGC) Web Services
Web services are self-describing and self-contained applications that can be invoked over the internet through HTTP using messages encoded in XML format [4]. The OGC web services are [11]:
data visualization, such as Web Map Service (WMS);
data services, such as Web Feature Service (WFS) and Web Coverage Service (WCS);
processing services, such as Web Processing Service (WPS);
data presentation, such as Styled Layer Descriptor (SLD);
querying and transport, such as GML;
publication and discovery, such as Catalogue Service for the Web (CSW); and
data storage, such as Web Map Context (WMC) A few of these services are now discussed in the context of SDI development.
2.2.3. Web Map Service (WMS)
WMS is an OGC standard for data visualization enabling visual overlay of diverse geographic content over the internet. The end product is a two-dimensional, geo-referenced raster presented in a format such as Portable Network Graphics (PNG), Joint Photographic Experts Group File Interchange format (JPEG), and Geographic Tagged Image File Format (GeoTiff) [10]. WMS may help in the discovery and visualization of spatial data held in SDI catalogue services [2], since it can be used to retrieve a rendered map that is ready for display [11]. The key strength of WMS is that rendering takes place on the server and the output is ready for display by clients in an appropriate format.
2.2.4. Web Feature Service (WFS)
information held in the SDI participatory databases [2], and is thus suitable for selecting, adding, updating, deleting, and filtering geospatial data. Unlike WMS which produces a map ready for display, WFS provides access to the raw vector data [10].
2.2.5. Web Coverage Service (WCS)
WCS does the same for raster data as WFS does for vectors: it returns the raw raster data. WCS can be used for request and response of coverage or a set of features in an SDI. Examples of raster data that can be returned include aerial photographs, satellite imagery, and space-varying phenomena, such as elevation data [10]. WCS not only provides access to raster data together with the detailed characteristics of the data, but also a rich syntax for requests and operations against the data, such as interpretation and extrapolation [2].
2.2.6. Web Processing Service (WPS)
WPS is a paradigm shift from data providing services, such as WCS and WFS, to service providing services [11] which can be used to publish and execute geo-processes over the web [12]. It enables the dynamic binding, sharing, publishing, discovery, and use of geo-processes in an SDI [13]. WPS can also facilitate service chaining in an SDI, enabling the orchestration of complex processes through a sequence of sub-processes. Examples of WPS implementations are the Java-based 52°North (www.52north.org/wps) and the Python-based PyWPS (www.pywps.org/) [12]. Both implement the WPS OGC standard, enabling standard deployment of geo-processes. An SDI could deploy both implementations, thus enabling developers to contribute processes developed in different programming languages and frameworks.
2.2.7. Other Services
Whilst services such as search, visualization, and access are essential to SDI [2], other services that are often needed in SDIs are application, catalogue or registry, portrayal, and processing services. Most of these services are fairly standard, and are offered as frameworks and services in most software for deploying SDIs.
2.3. Geoportals
The word portal originates from the Latin word porta, which means doorway, gate, or entrance. Thus, web portals are web sites that act as a gateway to an assortment of information resources, such as datasets and catalogues [4]. Similarly, geoportals (or geospatial portals) are gateways to geospatial content.
Sometimes referred to as clearinghouse portals [14], geoportals are sites where geospatial resources (such as spatial data and services) can be published and later discovered [4], making it easier for users to find, access, and use the resources. Geoportals are an essential and highly noticeable component of an SDI, serving as an entry
point to the SDI.
A geoportal is typically used as a single window into the SDI [2]. From a technology point of view, the ideal SDI has a distributed architecture, exposing a variety of data and services contributed by diverse organizations. This enables detached systems to collaborate and communicate with each other [6]. Standardized web services provide the foundation for interaction amongst applications, allowing users and even other applications to contribute, search, access, exchange, and use the content.
2.4. The Software Architecture of an SDI
Software architecture can be described as the structure of a system, usually formed by software elements or components, and their properties, interrelationships and relationship with their environment [15]. The software architecture of most contemporary SDIs is based on the Reference Model of Open Distributed Processing (RM-ODP) standard [16]. RM-ODP, an international standard providing a conceptual framework for architecting open, distributed and complex systems in an incremental manner, is jointly developed by the International Organization for Standardization and the International Electro-technical Commission.
RM-ODP defines five viewpoints on the system and its environment [16]:
enterprise: dwells on the scope, purpose and policies of the system;
information: is concerned with the semantics of the information and processing performed;
computational: deals with the functional breakdown of the system into interacting objects;
engineering: specifies the mechanisms supporting distributed interaction between components; and
technology: focuses on technology choices in the system.
The software architecture of an SDI is an important consideration to the extent that it facilitates its structured design and better understanding. Normally, the architecture is documented by a set of views, viewtypes, and styles [15]. Whereas views are representations of elements or components and their relationships, viewtypes are allowed element and relationship types. A style is a special viewtype that may define general semantics. For example, it may specify that only certain elements and relationships from a viewtype are allowed.
RM-ODP defines views or representation of elements in a distributed system, and provides a concrete architectural basis upon which SDIs can be developed [2]. Ideally, the specification of software architecture is required prior to the commencement of SDI development.
2.5. IT Trends influencing SDIs
potential to offer new approaches supporting better development of SDIs. These approaches include Internet of Things (IoT), Linked Data, the Semantic Web, and Cloud Computing. This section expounds on some of these trends. 2.5.1. Internet of Things
IoT usually involves sensors embedded in appliances and electronic devices, which can be connected to each other through bluetooth, mobile, or wireless fidelity (WIFI) networks [17]. Real-time and high-spatial-resolution data can be provided by various geo-sensors, ranging from weather stations, to marine sensors, unmanned aerial vehicles, and satellites. To integrate such geo-sensors into SDIs, the Sensor Web Enablement (SWE) standard has been developed by the OGC [5].
IoT facilitates improved means for collecting and accessing near real-time information, and can therefore significantly contribute to SDIs by facilitating timely spatial data.
2.5.2. Linked Data
Linked Data refers to a set of practices for publishing and connecting structured data on the semantic web. It involves a representation of data using a framework known as the Resource Description Framework (RDF) [18].
Linked Data facilitates the linking of data to other data, thus contextualizing and adding value to the existing data. Whilst the World Wide Web (WWW) is a web of interlinked documents using Hypertext Mark-up Language (HTML), the semantic web is a network of interlinked data based on RDF [19].
Linked Data is supported by four principles:-
the use of URIs as a mechanism to name resources on the web;
the use of HTTP URI’s to look up names of the resources;
lookup of data using RDF and Simple Protocol and RDF Query Language (SPARQL); and
the use of links to URI’s allowing discovery of more things.
Linked Data differs from GML in that the former facilitates an open publication environment in which additional information and data from other sources can be easily linked. It is possible to transform existing GML data into RDF using eXtensible Stylesheet Language (XSLT), which may facilitate the publication of geospatial data as Linked Data in contemporary SDIs [19].
According to Díaz et al [5], Linked Data offers several benefits to SDIs, including: simplified integration of heterogeneous data through shared vocabularies, which increases the availability of information resources; improved means for encoding, describing, and interlinking data, thereby improving access to data through links and crawling mechanisms; and a uniform model for data and metadata, which improves the descriptions and quality of spatial data resources.
2.5.3. Big Data
The term Big Data became accepted around the year 2010, although it may have existed before under different terminology. Generally, it refers to the high-volume, high-velocity, high-variety, high-veracity, and high-value information that require new ways of processing [20]. Big Data may contribute to SDIs by providing [21]:
storage and processing of geospatial content through cloud computing;
a new source of innovation leading to new geospatial solutions; and
new bodies of knowledge and scientific communities, and new specialized conferences Big Data often comes from the cloud, and conversely SDIs may contribute to it as follows:
creation of new analytical possibilities and the discovery of new facts;
location reference, as an integrator/aggregator with other information sources; and
geo-visualization, providing analysis and insights 2.5.4. Open Data
Open Data can be classified into several ways, including geospatial, government, scientific, and historical open data. It is the initiative and idea of universal free accessibility and availability of data. Generally, open data makes data more accessible for use to other purposes than it was intended. Data is considered ‘open’ if anyone can freely use, reuse, and even redistribute the content [22].
Although SDI and Open Data overlap and complement each other, the main difference between them is that agreements on commonly used standards and are widely missing in the latter. In addition, Open Data tends to focus on content rather than on infrastructure and interoperability, the key tenets of an SDI.
2.5.5. Cloud Computing
Cloud Computing describes an approach in which applications, services, and datasets are no longer located on local computers, but distributed over remote facilities [5]. It is an evolution from technologies such as virtualization, grid, and utility computing [23]. A grid is a network of spatially distributed computation or data resources, accessible via open and standardized interfaces [13]. On the other hand, virtualization is an abstraction process that creates a virtual, rather than real, instance of a resource, such as an operating system. Cloud Computing is a facilitator of other emerging trends, such as Big Data [21].
[18]. This is particularly attractive to countries with limited financial and human resources.
Cloud Computing can provide a flexible and transparent access to resources such as software, hardware, data, computation, and storage [2]. Clouds can be deployed at three service levels, which are, in decreasing order of control, and increasing order of security [23]:
Infrastructure as a Service (IaaS) offers complete access to basic computational facilities, such as hardware and virtual machines (VM). Users have full control over the facilities, including storage, operating systems, and applications. Examples of IaaS include the Amazon Elastic Compute Cloud (EC2) and Simple Storage Service (S3).
Platform as a Service (PaaS) offers runtime environments - such as databases, operating systems, web services, and application frameworks, security mechanisms, and middleware as a service in which users can develop custom applications developed using programming languages and tools supported by the platform. Examples are Google App Engine (GAE), Microsoft Azure Engine, and GroundOS.
Software as a Service (SaaS) offers ready to use applications delivered as a service. This differs markedly from the traditional on premise software in that users run the applications in the cloud without managing the hardware infrastructure or platform. Esri’s ArcGIS Online and Salesforce.com CRM are examples of SaaS clouds.
Other than IaaS, PaaS, and SaaS clouds, Data as a Service (DaaS) is a cloud service typically essential for geospatial applications due to the large volume of data involved. DaaS is usually implemented within a SaaS, PaaS, or IaaS, to provide data within applications supporting the discovery, access, manipulation, and use of the data. Google Maps is an example of a DaaS.
Cloud Computing presents two major benefits to SDIs: simplified deployment and maintenance of SDI services, hence increased number of content offerings; and reduced costs of providing content and applications, hence increased quality of service [5]. Other benefits include: demand for framework data, which is best provided through cloud services; the increasing need for high volume datasets, and the high computational requirements of SDIs [2]. Despite their numerous benefits, there are several limitations of Cloud Computing, including reduced security, availability, privacy, integrity, confidentiality, legal concerns, and liability [2], [23].
2.5.6. Volunteered Geographic Information (VGI)
VGI can be defined as the use of content generated by users in the geospatial domain [2]. VGI typically involves an active user community, playing a more influential or organized role in data collection and correction. In addition, VGI can act as a valuable mechanism to promote public participation, thus engaging and empowering citizens [18].
User generated content can also help local communities generate and access spatial data especially where powerful entities such as the Government, large corporations, and individuals have commoditized data [22]. This tendency reduces the accessibility of the data, a fundamental problem to SDI development in Africa. Thus, VGI can be used to alter the relative power that traditional producers of data hold, while facilitating avenues for local communities to influence change.
SDIs can benefit from VGI in several ways. Content produced by citizens is cost effective since the local knowledge, skills and expertise is utilized. Besides, VGI offers the ability to access real-time data thus enhancing the timeliness of the content.
An active user community is one of the requirements of successful SDI development, and VGI encourages participation. VGI has been successfully used during disasters, such as the Haiti’s earthquake in 2010 [24]. Like other emerging technologies, VGI is associated with several risks such as poor data quality, legal issues, and security concerns.
2.5.7. Free and Open Source Software (FOSS)
The motivation behind free software is freedom, akin to freedom of speech, and not free-of-cost advantages. Free software grants the freedom of use, modification and redistribution while proprietary software takes the freedom away [10]. The term Open Source means the availability of the software’s source code, with a license authorizing anyone to use, modify, and even redistribute the software.
In countries where development of SDIs is in the early stages, availability of FOSS offers a genuine alternative to costly proprietary software [18]. The drawback with FOSS is that the ongoing maintenance and training skills have to be developed internally, necessitating the need for higher qualified Geospatial and IT personnel.
FOSS used for geospatial applications may be categorized as: Desktop Geographic Information Systems (GIS), Spatial Database Management Systems (DBMS), Web Map Servers, Server GIS, Web GIS clients, Mobile GIS, Libraries, GIS Extensions, Plug-ins and Application Programming Interfaces (APIs), Remote Sensing Software, and Exploratory Spatial Data Analysis (ESDA) software [10].
(GDAL). With the introduction of OGC standards, these projects are striving for compatibility with each other.
3. Methods
3.1. IntroductionThis section outlines the methodology, which involves development of a geospatial application that maps the performance of a key national examination in Kenya, the Kenya Certificate of Primary Education (KCPE). This examination was conducted in 2015, and involved 938,738 candidates in 25,121 schools.
The application aims to demonstrate the technology trends suitable for SDI development in Africa, which practitioners can use as a reference. Ideally, the application should have been developed within the context of an existing SDI geoportal, which unfortunately did not exist in the study context in 2016.
The application uses the Ministry of Education, Science and Technology (MOEST) datasets which were chosen due to their higher availability. The datasets include the geographical locations of schools taken from the national school mapping project of 2007. Administrative boundaries, such as constituencies and counties from the Independent Electoral and Boundaries Commission (IEBC), are also used.
3.2. Description of the Methodology
The application utilizes contemporary technologies, such as cloud computing, to demonstrate some of the technology trends that can be used to support SDI development in Africa. Thus, the application is not a complete SDI geoportal, but a demonstration of the concepts based on new technology trends.
One of the most important considerations is choice of a cloud platform. There are several types of clouds, such as Google Cloud Services (GCS), Amazon Web Services (AWS), and Microsoft Azure Engine. GCS is preferred for several reasons. First, it is a flexible and powerful cloud, facilitating Google Compute Engine (GCE), Google Container Engine (GKE), and GAE services. Secondly, it is still a relatively new entrant but with promising potential for the highly demanding geospatial industry. Thus, the author does not expect significant deployment of SDI geoportals on GCS in 2016, particularly in Africa. This provides a gap to be filled by this research.
3.2.1. Google Container Engine
GKE, which is an IaaS cloud, was launched in August 2015. It provides standard IaaS cloud features, and takes its offering to a higher level through Docker containers and Kubernetes.
Docker uses Linux container technology to package applications into portable, hardware- and platform-isolated containers. For instance, an SDI could utilize a container
providing a specific geoprocessing service; or a container facilitating complete access to a set of OGC services (WMS, WFS, WCS, and WPS). Docker provides the lifecycle management of containers.
On the other hand, Kubernetes is Google’s open-source cluster manager for orchestration and management of container clusters. Kubernetes could be used to start more instances of a popular container in an SDI as the number of user’s grows, or dynamically size a cluster with more processor capacity or memory [25].
Among the attractive GKE features include: automated container management for running Docker containers; easy setup of clusters; declarative management of container resources (for example processor capacity or memory) in a simple human readable JavaScript Object Notation (JSON) or YAML file; and a flexible, free and open source environment.
As at 2016, Google was charging a time-based fee for management of GKE cluster depending on the number of nodes in the cluster. Whereas a cluster with less than 6 nodes was free of charge, the one with 6 or more nodes was costing $0.15 per hour. To minimize on the cost, this application used three nodes.
3.2.2. Configuration of the GKE Platform
GCS can be accessed at https://console.cloud.google.com/. Authentication is granted using a standard Google Account. The GKE platform defines the following terms:
a container comprises of isolated VM installed on the operating system's kernel;
a container cluster consists of a specified number and type of GCE instances;
a pod is a group of containers scheduled on the same host;
pods serve as units of deployment, scheduling and replication; and
a replication controller ensures that a number of pod replicas are running at any time
3.2.3. Software Considerations
Like any standard geospatial application, choices were made on the spatial DBMS, web server, server-side geo-services, and client-side interaction.
GeoServer, a Java-based and open-source software, was chosen to serve the server-side geo-services. The software can be used to publish geospatial data on the network using OGC standards, such as WMS, WFS, WCS, Web Map Tile Service (WMTS), CSW, and WPS. GeoServer functions as the reference implementation of the OGC.
Another open-source software chosen is PostGIS, a spatial database extender for PostgreSQL DBMS. PostGIS enables Structured Query Language (SQL) queries using spatial operators, such as Point in Polygon, which can facilitate the determination of a county (polygon) to which a school (point) belongs.
Running on Linux technology, Nginx is an open source web server that can serve requests such as HTTP, secure HTTP (HTTPS), and load balancing.
OpenLayers, an open source JavaScript library for displaying geospatial data in web browsers, was also used. It provides an API for building web-based geospatial applications. Together with HTML, OpenLayers was used to provide an interface to the application and for client-side user interaction, helping in the display of the maps.
The selected technology stack (Kubernetes, Linux, Nginx, GeoServer, PostGIS, OpenLayers, and Docker) is completely FOSS. This not only highlights the potential for FOSS in modern geospatial information management, but also reduces software licensing costs. Support and online communities on FOSS are readily available, making it easy to access help and support resources during the set up and configuration.
3.2.4. Set up and Installation
The first step involved activating the Google cloud shell, which runs a virtual machine instance of Debian Linux operating system. The shell provides command-line access to computing resources hosted on GKE, using two main utilities known as gcloud and kubectl.
The next step involved using gcloud to set up the GCE compute zone, as shown in Code 1. GCE resources reside in regions or zones, a geographical location where a given resource runs, which is known as a compute zone.
$ gcloud config set compute/zone us-central1-b
Code 1. Creating the GCE Compute Zone
There are many Docker images that can be reused, and two are identified for this study:
github.com/kartoza/docker-geoserver and
hub.docker.com/r/mdillon/postgis/. These are used to create the GeoServer and PostGIS containers, respectively. Retrieving the images can be accomplished by the
commands shown in Code 2. $ docker pull mdillon/postgis $ docker pull kartoza/geoserver
Code 2. Pulling Docker Images
The next step involved creating a GKE cluster with three nodes on which GeoServer, PostGIS and the Nginx containers will run. Code 3 shows the creation of a cluster named gscont.
$ gcloud container clusters create gscont --num-nodes 3 $ gcloud config set container/cluster gscont
$ gcloud container clusters get-credentials gscont
Code 3. Creating the Cluster
The application makes use of persistent disks, allowing the three containers to preserve their state across shutdown and start-up. Two disks are created as shown in Code 4.
$ gcloud compute disks create --size 200GB postgis-disk $ gcloud compute disks create --size 200GB geoserver-disk
Code 4. Creating the Disks
The final step involved creating and starting the pods, and the services used to access them. Pod and service specifications were defined in YAML files. For example, Code 5 shows how the PostGIS pod and its corresponding service were created.
$ kubectl create -f mpostgres.yaml $ kubectl create -f postgres-service.yaml
Code 1. Creating the Pods
The webserver container has been customized, since it serves custom content (JavaScript, html, and images) which are specific to the application. Thus, a docker image based on Nginx was created, as shown in Code 6. To create a running web server instance, see Code 7.
FROM nginx EXPOSE 80
COPY webdir /usr/share/nginx/html
Code 2. Nginx Dockerfile $ docker build -t gcr.io/myphdprj/phd-nginx:v1 .
$ gcloud docker push gcr.io/myphdprj/phd-nginx:v1
$ kubectl run phd-nginx --image=gcr.io/myphdprj/phd-nginx:v1 --port=80 $ kubectl expose rc (OR pod) phd-nginx --target-port=80 --type="LoadBalancer”
Code 3. Creating the Nginx web server
By inspecting kubectl output (see Code 8 and the output in Code 9), GeoServer was running on 8.35.197.101; and can be accessed at: http://8.35.197.101:8080/geoserver/web. Opening this link loaded the GeoServer login screen. Additionally, the web server based on Nginx was running on http:// 146.148.76.240 /index.html.
$ kubectl get services gsfrontend psfrontend phd-nginx
Code 4. Inspecting the Services $ kubectl get services
NAME CLUSTER-IP EXTERNAL-IP PORT(S) AGE
Gsfrontend 10.103.247.146 8.35.197.101 8080/TCP 5h kubernetes 10.103.240.1 <none> 443/TCP 1d psfrontend 10.103.251.124 <none> 5432/TCP 5h
Code 5. Detailed Service Endpoints
3.3. Data Sources
The KCPE results of 2015 (the results dataset) was obtained from MOEST. The schools dataset, which contains spatial coordinates of the schools, was obtained from the Kenya Open Data Portal1. The latter is an extract of data collected by MOEST in its school mapping project of 2007 [26]. Administrative layers such as counties were obtained from the IEBC.
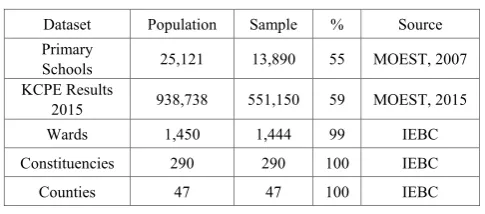
[image:8.595.53.296.310.417.2]Table 1 presents the population and sample for each dataset. To be included, a record in the schools dataset must be easily identifiable by name in the results dataset. The two datasets revealed a lot of duplicates, naming anomalies, and other inconsistencies, which explains the relatively low sample of 55% and 59% respectively. However, this was considered representative since the sample accounts for more than 30% of the population.
Table 1. Datasets in the Study
Dataset Population Sample % Source
Primary
Schools 25,121 13,890 55 MOEST, 2007
KCPE Results
2015 938,738 551,150 59 MOEST, 2015
Wards 1,450 1,444 99 IEBC
Constituencies 290 290 100 IEBC
Counties 47 47 100 IEBC
3.5. Data Loading
By loading the data into PostGIS database, GeoServer can be used to serve various WFS, WMS, and WCS content. In addition, the application can be extended to provide more sophisticated geoprocessing services using WPS, as is typical in SDIs.
Data loading was done in two steps: generation of SQL scripts, using shp2pgsql; followed by population of data into the database, named “gis”. Code 10 shows an example. The Spatial Reference Identifier (SRID) 4326 refers to the new World Geodetic System (WGS 84), since the datasets are in this reference system.
$ shp2pgsql -s 4326 counties.shp counties > counties.sql $ psql -f counties.sql gis
Code 6. Data Load Scripts 3.6. Justification of the Methodology
As at 2016, the KNSDI was neither mature nor operational. There wasn’t a national geoportal accessible to the public. Ideally, this application should have been developed within this geoportal, by integrating with existing fundamental datasets. It is for this reason that this
1 www.opendata.go.ke/Education/Kenya-Primary-Schools/p452-xb7c
application was developed to outline trends for SDI in Africa.
4. Results and Discussion
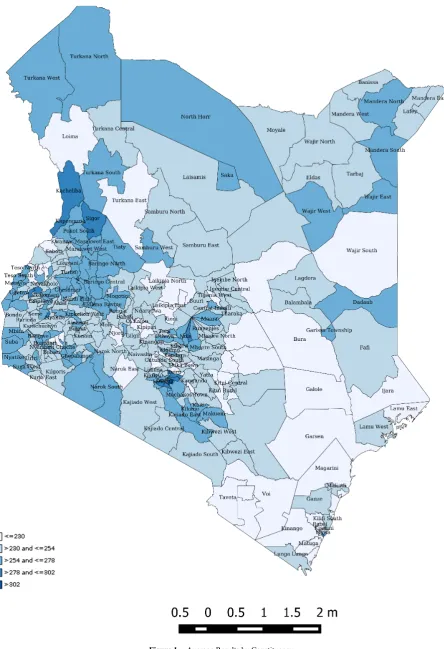
4.1. Data Portrayal and DownloadThe application serves a number of spatial services, notably WMS and WFS content, depicting spatial characteristics of the dataset. Some of the maps generated are shown in Figures 1, 2 and 3.
4.2. Spatial Queries
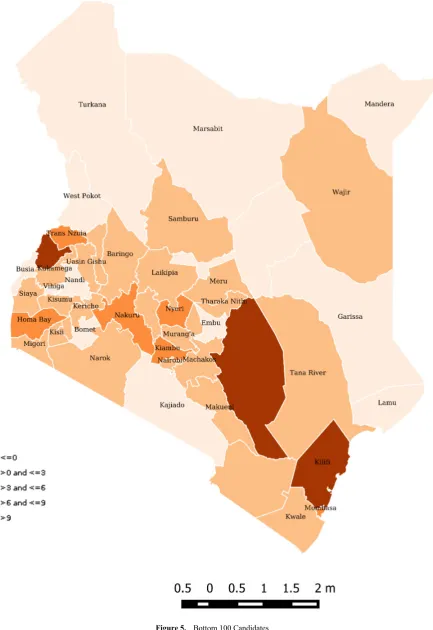
The database can be used to build and visualize complex spatial queries. For instance, one might be interested to know which counties produced the top 100 candidates, or the bottom 100. Two queries in Code 11 have been used to produce the output in Figures 4 and 5.
CREATE VIEW county_all_zero AS SELECT counties.county_cod, counties.county_nam, counties.geom, 0 as count FROM counties;
CREATE VIEW county_bottom_100_final AS SELECT county_bottom_100.county_cod, county_bottom_100.county_nam,
county_bottom_100.geom, county_bottom_100.count FROM
county_bottom_100
UNION
SELECT county_all_zero.county_cod, county_all_zero.county_nam, county_all_zero.geom, county_all_zero.count FROM county_all_zero where county_all_zero.county_cod NOT IN (
SELECT county_bottom_100.county_cod FROM
county_bottom_100);
CREATE VIEW county_top_100_final AS SELECT
county_top_100.county_cod, county_top_100.county_nam, county_top_100.geom, county_top_100.count FROM county_top_100
UNION
SELECT county_all_zero.county_cod, county_all_zero.county_nam, county_all_zero.geom, county_all_zero.count
FROM county_all_zero where county_all_zero.county_cod NOT IN (SELECT county_top_100.county_cod FROM county_top_100);
4.3. Potential for SDI
The study adds to the existing body of knowledge on technology choices for SDI development, by outlining the potential of the GCS cloud and other technology trends. In addition, the study presents a synopsis of the benefits and challenges of new trends in SDI development.
Through Kubernetes, GCS provides superb scalability features, allowing computing resources to be scaled on-demand. Scalability is desirable in SDIs, which scale to the national and higher levels. This can be used to serve a large number of users, through efficient geoservices.
The application has been configured on a minimal virtual machine type, of 1 virtual processor (VCPU) and 2 GB memory (RAM). More powerful machine types are available, including high-CPU (32 VCPU and 28 GB RAM) and high-memory (32 VCPU and 208 GB RAM). Time and financial resources did not allow for testing higher machine types, which attract higher charges.
4.4. Cost Estimate of the GCS
An area of obvious interest is to estimate what it would cost for part of Kenya’s national SDI (KNSDI) geoportal, hosting core spatial datasets, to be deployed in a GCS cloud.
Given the weak status of the KNSDI [27], several assumptions are made, in order to eliminate the extraneous variables so that the focus is directed on the cost of cloud deployment. First, it is assumed that the KNSDI policies and standards have been finalized, and are used widely by most stakeholders. Second, it is also assumed that data custodians have been identified using policies and legal instruments. Third, data and metadata are widely available in a suitable digital format, and the KNSDI takes advantage
of new trends such as cloud computing for SDI development.
Based on an examination of the KNSDI core spatial datasets, and the Mapping Africa for Africa project, the KNSDI would have about 14 core spatial data custodians [28], [29]. Although the focus is on the custodians, there would be additional KNSDI stakeholders offering a host of application datasets and services, such as the National Environmental Management Authority, and the Kenya Wildlife Services. For simplicity in cost estimation, these stakeholders are excluded.
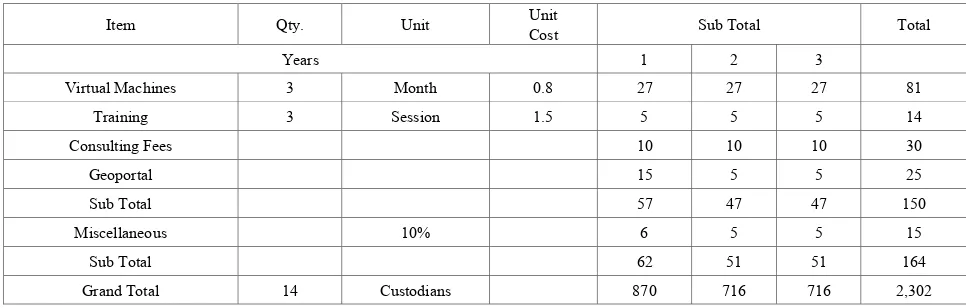
Table 2 highlights the estimated cost of deploying the KNSDI in a GCS cloud environment. In order to highlight the cost of cloud deployment, the figure excludes the cost of additional SDI activities, such as data and metadata development, preparation of standards, policies, and the institutional framework.
If each custodian hosts its datasets in a GCS cloud using medium sized virtual machines (16 VCPU, 60 GB RAM, and 1TB storage each), then the estimated annual cost for each custodian of hosting on GCS is $27,000.
This cost was obtained from Google’s cloud price list as at 2016. Similar to the application demonstrated in the study, the set up assumes that each custodian utilizes three virtual machines, including a database server, an application server (e.g. GeoServer), and a web server based on Nginx to serve content using OGC services and Open Layers.
[image:14.595.55.538.519.673.2]If each custodian gets its staff trained on setup and administration, then the annual training cost per custodian is $15,000, which includes consulting fees. Thus, the total cost of hosting KNSDI on GCS is about 2.3 million US $ over a three year period.
Table 1. Cost Estimate of GCS Deployment
Item Qty. Unit Cost Unit Sub Total Total
Years 1 2 3
Virtual Machines 3 Month 0.8 27 27 27 81
Training 3 Session 1.5 5 5 5 14
Consulting Fees 10 10 10 30
Geoportal 15 5 5 25
Sub Total 57 47 47 150
Miscellaneous 10% 6 5 5 15
Sub Total 62 51 51 164
Grand Total 14 Custodians 870 716 716 2,302
5. Conclusions
Supported by an application based on contemporary technologies, the study highlights some of the technology trends and choices that can support SDI development in Africa. Building upon the sample, developing countries can adopt the principles presented. The study not only highlights the technology choices available today, but also a reference sample application.
Time and financial resources did not allow for testing the scalability of the application. However, the study has shown that cloud computing has the potential to facilitate scalable web services in the cloud, thus increasing uptake of SDIs. Cloud services can also provide higher quality services, improved performance, reliability of geoservices, and improved accessibility to geospatial data and services. Several risks and benefits of cloud computing and other trends, which practitioners should be aware of, have been discussed.
FOSS software, including PostGIS, GeoServer, Linux, Kubernetes, Docker, and OpenLayers, has been used extensively. The application has shown that FOSS software can support SDI in Africa, where resources are generally scarce. However, these technologies come with a steep learning curve, which can be managed through training and capacity building.
Part of the data used in the study was obtained from the Kenya Open Data Portal. Availability of readily accessible data is not only a catalyst for successful SDI development, but also a means of creating more employment opportunities, entrepreneurship through data and service provision, and an agile ecosystem of developers built around SDIs.
Other than trends for SDI, the application may be of interest to practitioners in the education sector who may want to carry out spatial analysis of the existing data in a cloud environment. The same principles can be applied to other areas, including agriculture and climate change.
6. Areas for Further Study
Several challenges were encountered in the study. First, significant time was spent matching records in the results and schools datasets. This problem can be minimized by use of Linked Data, where concerned agencies cooperatively work together to improve data management. Additionally, although Google provides a free trial period, continued use of GCS has a cost implication. The application has been shut down but can be restarted in case there is need.
The following are recommendations for further improvement.
The application can be extended to utilize mobile data collection tools (such as Esri’s Survey 123), empowering schools with the ability to update their own data.
The application can be extended to use Linked Data. Each school would be allocated a unique URI identifying it on the web, and storing its data in RDF.
A survey on the worldwide adoption of cloud and other technologies in SDI can be carried out. The study can verify if the technology trends lead to wider adoption of SDIs.
Acknowledgements
We are very grateful to the Global Spatial Data Infrastructure (GSDI), who provided a travel grant enabling the corresponding author to attend the GSDI conference in Taipei, Taiwan in 2016, at which this paper was presented.
REFERENCES
[1] N. R. Budhathoki and Z. Nedović-Budić, ‘Expanding the Spatial Data Infrastructure Knowledge Base’, in Harlan Onsrud (ed), Research and Theory in Advancing Spatial Data Infrastructure Concepts, Redlands: ESRI Press, 2007, pp. 7–31.
[2] GeoConnections, ‘Spatial Data Infrastructure (SDI) Manual for the Americas’, 2013. [Online]. Available: http://unstats.un.org/unsd/geoinfo/RCC/docs/rcca10/E_Con f_103_14_PCIDEA_SDI%20Manual_ING_Final.pdf. [Accessed: 18-Oct-2015].
[3] J. Okuku, A. Bregt, and L. Grus, ‘Assessing the Development of Kenya National Spatial Data Infrastructure (KNSDI)’, South African Journal of Geomatics, vol. 3, no. 1, pp. 95–112, Jan. 2014.
[4] D. J. Maguire and P. A. Longley, ‘The emergence of geoportals and their role in spatial data infrastructures’,
Computers, Environment and Urban Systems, vol. 29, no. 2005, pp. 3–14, May 2004.
[5] L. Díaz et al., ‘Future SDI – Impulses from Geoinformatics Research and IT Trends’, International Journal of Spatial Data Infrastructures Research, vol. 7, pp. 378–410, 2012. [6] A. G. Tumba and A. Ahmad, ‘Advocating for Spatial Data
Implementation at the Lower Tiers of Governments in Developing Countries: The Case of Africa’, Universal Journal of Geoscience, vol. 2, no. 5, pp. 152–159, 2014. [7] G. Newman, D. Zimmerman, A. Crall, M. Laituri, and J.
Graham, ‘User-friendly web mapping: lessons from a citizen science website’, International Journal of Geographical Information Science, vol. 24, no. 12, pp. 1851–1869, Dec. 2010.
[8] Y. Guigoz, G. Giuliani, A. Nonguierma, A. Lehmann, A. Mlisa, and N. Ray, ‘Spatial Data Infrastructures in Africa: A Gap Analysis’, Journal of Environmental Informatics, Jan. 2016.
‘Geospatial Cyberinfrastructure: Past, present and future’,
Computers, Environment and Urban Systems, vol. 34, pp. 264–277, 2010.
[10] S. Steiniger and A. J. S. Hunter, ‘The 2012 free and open source GIS software map – A guide to facilitate research, development, and adoption’, Computers, Environment and Urban Systems, vol. 39, no. 2013, pp. 136–150, 2012. [11] W. Li, L. Li, M. F. Goodchild, and L. Anselin, ‘A Geospatial
Cyberinfrastructure for Urban Economic Analysis and Spatial Decision-Making’, ISPRS International Journal of Geo-Information, vol. 2, no. 2, pp. 413–431, May 2013. [12] J. Brauner, T. Foerster, B. Schaeffer, and B. Baranski,
‘Towards a Research Agenda for Geoprocessing Services’, in Haunert J, Kieler B, Milde J (eds) Proceedings of the 12th AGILE International Conference on Geographic Information Science, Hanover, Germany, 2009.
[13] B. Baranski, ‘Grid Computing enabled Web Processing Service’, in Proceedings of the 6th Geographic Information Days. Interoperability and spatial processing in GI applications, Münster, Germany (IfGIprints, 32), 2008. [14] Executive Office of the President, Coordinating Geographic
Data Acquisition and Access, the National Spatial Data Infrastructure. Federal Register 59:17671-4, vol. Federal Register 59. 1994, pp. 17671–17674.
[15] R. Béjar, M. Á. Latre, J. Nogueras‐ Iso, P. R. Muro‐
Medrano, and F. J. Zarazaga‐ Soria, ‘An Architectural Style
for Spatial Data Infrastructures’, International Journal of Geographical Information Science, vol. 23, no. 3, pp. 271– 294, Mar. 2009.
[16] B. Henricksen, ‘United Nations Spatial Data Infrastructure Compendium’. United Nations, Feb-2007.
[17] D. Wainainah, ‘Future is in Smart Homes as Internet of Things catches on’, Business Daily, 14-Aug-2015.
[18] J. Carpenter and J. Snell, ‘Future trends in geospatial information management: the five to ten year vision’,
Jul-2013. [Online]. Available:
http://ggim.un.org/docs/Future-trends.pdf. [Accessed: 01-Jan-2016].
[19] L. van den Brink, P. Janssen, W. Quak, and J. Stoter, ‘Linking spatial data: semi-automated conversion of geo-information models and GML data to RDF’,
International Journal of Spatial Data Infrastructures Research, vol. 9, no. 2014, pp. 59–85, 2014.
[20] C. Tsinaraki and S. Schade, ‘Big Data – a step change for SDI?’, International Journal of Spatial Data Infrastructures Research, vol. 11, no. 2016, pp. 09-19, 2016.
[21] GeoConnections, ‘Impacts and Implications of Big Data for Geomatics: Backgrounder’, 2016. [Online]. Available: http://ftp.maps.canada.ca/pub/nrcan_rncan/publications/ess _s st/297/297538/cgdi_ip_0044_en.pdf. [Accessed: 14-Jul-2016].
[22] S. Williams, E. Marcello, and J. M. Klopp, ‘Towards Open Source Kenya: Creating and Sharing a GIS Database of Nairobi’, Annals of the Association of American Geographers, vol. 104, no. 1, pp. 114–130, Jan. 2014. [23] B. Ludwig, ‘Implications of security mechanisms and
Service Level Agreements (SLAs) of Platform as a Service (PaaS) clouds for geoprocessing services’, Springer in Applied Geomatics, 2012.
[24] D. Sui and M. Goodchild, ‘The convergence of GIS and social media: challenges for GIScience’, International Journal of Geographical Information Science, vol. 25, no. 11, pp. 1737–1748, Nov. 2011.
[25] Craig Mcluckie, ‘Google Container Engine is generally available’, Aug-2015. [Online]. Available:
http://googlecloudplatform.blogspot.co.ke/2015/08/Google-C ontainer-Engine-is-Generally-Available.html. [Accessed: 09-Jan-2016].
[26] G. C. Mulaku and E. Nyadimo, ‘GIS in Education Planning: The Kenyan School Mapping Project’, Survey Review, vol. 43, no. 323, pp. 567–578, Oct. 2011.
[27] C. Mwange, G. C. Mulaku, and D. N. Siriba, ‘Reviewing the status of national spatial data infrastructures in Africa’,
Survey Review, Dec. 2016.
[28] [United Nations Economic Commission for Africa, ‘Geoinformation in Socio-Economic Development: Determination of
Fundamental Datasets for Africa’, 2007. [Online]. Available: http://www.uneca.org/sites/default/files/PublicationFiles/ge oi nformation_socio_economic_dev-en.pdf. [Accessed: 13-Jun-2015].