Journal of Chemical and Pharmaceutical Research, 2014, 6(6):2069-2073
Research Article
ISSN : 0975-7384
CODEN(USA) : JCPRC5
Design of AFT screening device of contaminated feed based on the
color-sensitive sensor
Li Tianhua, Pan Zhengkun and Zhou Tingyan
Zunyi Normal College, School of Physics and Electrical and Electrical Engineering, Zunyi, Guizhou
_____________________________________________________________________________________________
ABSTRACT
AFT is one of the major pollutants in food agricultural products. The key to preventing the AFT poisoning of livestock is to avoid the AFT feed being eaten. Therefore, it is necessary to study the contamination situation of feed caused by AFT, which is highly useful for the aquaculture development, and the rapid screening of AFT is an important step in this process. Based on the fluorescence characteristics and mechanism of AFT, this paper uses the UV LED as the excitation source and adopts the color-sensitive sensor to carry out fluorescence signal acquisition and photoelectric conversion, controlled by MCU, to design the screening device for AFTB1 contaminated feed. This screening device is produced as a rod, for it is easy to be inserted in the feed pile. Besides, it is easy to carry and operate, durable and reliable and has low cost, which can be used to make qualitative screening for the AFT quickly.
Key words: AFT; UV LED; color-sensitive sensor; MCU
_____________________________________________________________________________________________
INTRODUCTION
AFT (Aflatoxin) is a fungus toxic metabolite and constituted by Aspergillus flavus and Aspergillus parasiticus. It is a carcinogenic substance with hypertoxicity, mainly contained in peanuts, corn, cottonseed meal, soybean meal and their byproducts. The AFT-contained feed may lead to the disease or locality-based injury of livestock when they eat it or just exposed to the toxin-containing substance. AFT could reduce the nutritional value of feed and the utilization rate of nutrients, thus damaging the palatability of feed, reducing the feed intake of livestock, and lowering the production performance [1]. AFT may also inhibit the digestive enzyme activity of the livestock and cause the absorption and metabolism disorders of nutrients, thereby damaging the digestive function of livestock, slowing down the weight gain and leading in the growth stagnation. AFT is widely distributed and may trigger serious injury for livestock, which will cause serious damage for the aquaculture [2].
Due to the uneven distribution of AFT in the feed, AFT may be produced only when the temperature and humidity reach the optimal conditions for toxin production. AFT is a kind of substance whose determination is difficult to be carried out, and each step is accompanied by errors where the largest one is in the sampling process. To get a representative sample requires a lot of samples which, on the other hand, will increase working hours and improve the testing cost [3]. This paper analyzes the AFT fluorescence characteristics and its mechanism, and proposes a screening program where the UV LED is used to flash the AFT of the feed and emit the yellow-green fluorescence. The AFT screening device is operated by fluorescence excitation and collection, and constituted by the photoelectric conversion system, data fitting system and display system. Besides, the digital control circuit is used where the
1. DESIGN PRINCIPLES AND INSTITUTIONS
2.1 Design Principles
Currently, there are 17 AFT structures which have been isolated and identified, including B1 (AFB1), B2 (AFB2), G1 (AF G1), G2 (AFG2), etc., of which the most toxic one is B1. For example, AFB1is lipophilic and has small molecules, so when the toxin enters the body, it will quickly pass through the stomach or small intestine through atypical passive transport. After 15min when the cows intake the AFTB1, the metabolite AFTM1 is detected in their blood. Therefore, milk secreted by the cows and the dairy products will contain a certain amount of AFTM1, and it is relatively stable during production and storage, which could prevent it from being destroyed by conventional production processes [5]. Therefore, various terminal dairy products may contain the aflatoxin, which will cause chronic poisoning and the prolonged intake even can induce liver cancer. Among them, corn is the major feed for livestock and accounts for a higher proportion of the livestock diets. However, corn is susceptible to the aflatoxin contamination in nature and thus produces mycotoxins under appropriate conditions. Every year there is large amount of corn inflowing into the feed markets, which will lead to the poisoning of livestock and many exert a huge impact on the aquaculture production [6].
AFT could produce the fluorescence with the wavelength longer than the incoming light under the UV excitation. The stronger fluorescence indicates the higher content of AFT as well as the more heavily contaminated feed. Fluorescent colors can be used to distinguish the AFT category, blue fluorescence representing Class B, green fluorescence representing Class G. When the wavelength of excitation light is 370nm, the fluorescent emission
wavelength of AFTB is 425nm, the fluorescent emission wavelength of AFTG is 450nm [7]. Since the corn
contaminated by AFTB1 may produce the fluorescence with the wavelength of 425nm under the excitation of ultraviolet light with a wavelength of 365nm, the greater endotoxin indicates the stronger fluorescence. Therefore, the corn contaminated by AFTB1 can be screened out by the fluorescence analysis. Select UV LED with the wavelength of 370 ±5nm as the excitation light source to make the fluorescence spectra emitted by AFTB1 in a reasonable range with greater peak wavelength and greater fluorescence intensity. Conduct selective collection for the fluorescence signal by the optical filter, and use the color-sensitive sensor to carry out fluorescent signal acquisition and photoelectric conversion, thus obtaining the fluorescence electrical signal. Amplify and process the circuit based on the characteristics of AFTB1 fluorescence signals. The photoelectric converted electrical signals are fitted by the MUC after the amplification and processing to obtain the AFTB1 information.
[image:2.595.163.449.449.534.2]2.2 Overall design
Figure.1 Schematic Diagram of AFTB Screening Device of Contaminated Feed
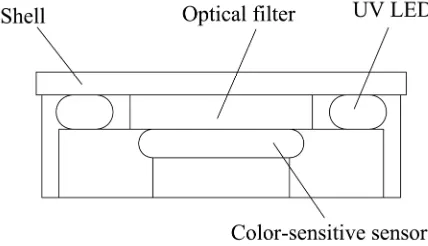
Figure .2 Schematic Diagram of Photoelectric Probe
[image:2.595.195.409.568.691.2]constituted by the shell, UV LED, optical filter, color-sensitive sensor, etc., as shown in Figure 2. The UV LED of the 8 photoelectric probes and color-sensitive sensors are connected to the amplification circuit by the wire and then to the control circuit board; HCI module and battery are all connected to the circuit boards by the circuit.
2. DESIGN OF THE KEY COMPONENTS
3.1 Photoelectric probes
The excitation light source is the key to the whole system, for it is not simply illuminating the object, and the match of the light source and driver should highlight the characteristics of the object as much as possible. There are a number of factors to be considered, for example, the stability of the light source may influence the precision and accuracy of measurement; the conversion efficiency of aflatoxin into fluorescence is different due to the different monochromatic light sources with different excitation wavelengths; the strength of the light source influences the sensitivity of the determination, for the light source should be intense enough to make the intensity of the fluorescence, thus ensuring the high sensitivity. However, the extremely intense light source will make the aflatoxin prone to decomposition due to the long-time exposure to the intense excitation light source, thus leading to the decrease of fluorescence emission intensity. To avoid errors caused by the decomposition of the light, the excitation source can be used only in the fluorescence time. The UV LED (the spectral distribution range of 365nm ~ 376nm, the center wavelength of 370nm, the size of 5mm × 6mm, the launch angle of 100 to 1200, the current of 20mA, the forward voltage of 3.3V) is used as the excitation source of photoelectric probe, and its center wavelength and the fluorescence excitation fit well. The six UV LED are arranged as a UV LED array, distributed in a circular luminous space, which could emit the ultraviolet light in a certain radiated power, a certain light intensity, a certain light frequency, and under the control of the MCU to irradiate AFTB1-contained corn and excite the fluorescence.
The photoelectric conversion link is the core part of the photoelectric detection and its main role is to convert the fluorescence signals into electrical signals. To achieve perfect match between the fluorescence emitted by AFTB1 and fluorescent probe, it is necessary to process the fluorescence signals. As there is scattering light and stray light in the fluorescent light path, the filter should be installed at the receiving end of the color-sensitive sensor. The filter could only pass through the fluorescence with the wavelength of 410nm ~ 450 nm in the continuous spectrum and prevent UV rays and other light rays.
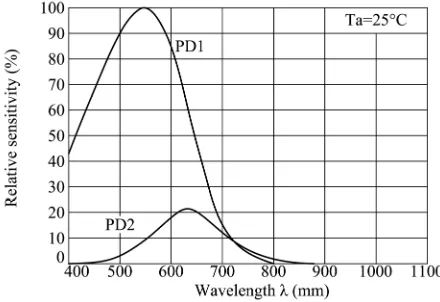
The color-sensitive sensor is a photoelectric conversion device and it is prepared in accordance with the principles of the photoelectric effect generated when the light shines on the PN junction. It is constituted by the photosensitive diode and color filter. This design adopts the color-sensitive sensor PD151 and the test range is from the blue ray to the near infrared ray. The output current is proportional to the wavelength of the incident light and the corresponding relationship of the adoption coefficient of the incident light in the Silicon and the wavelength is used to detect the wavelength of the incident light. The optical signal is converted into two current signals corresponding to the color of the incident light. The operating efficiency of the PD151 is equal to the two parallel photodiodes and it has integration of two optical chips of the PN junction with vertical arrangement and different junction depths. When the external light shines on the incident surface of the device, the light with shorter wavelength is absorbed by the PN junction at the superficial layer, while the light with longer wavelength is absorbed by the PN junction at the deep layer. The photodiode of the PN junction at the superficial layer is more sensitive to the light with short wavelength,
and the photodiode of the PN junction at the deep layer will be more sensitive to the light with long wavelength [8].
[image:3.595.196.416.587.738.2]This different sensitivity could be used to distinguish the color signals according to different wavelengths of the light. The relative sensitivity of the double PN junction of PD151 changing with the wavelength is as shown in figure 3.
3.2 Electric signal amplification and circuit processing
The short circuit current I1 and I2 output by PD151 is the weak current signal, which requires the operational
amplifier with high precision, low noise and high input impedance. Moreover, it is necessary to measure the logarithm of the short-circuit current, so the current logarithmic amplifier is first used to carry out logarithmic amplification for the current signal. The preamplifier has two main functions: one is to resist the transducer impedance; the other is to convert the weak charge into the voltage signals and amplify them. This requires a smaller preamplifier to be placed near PD151 and its input should fit the PD151. For the current logarithmic amplifier, select chip LOG100 and it could conduct logarithmic operation for the two current ratios or voltage ratios. The dynamic range of the input current of the amplifier is wide, varying between 1nA and 1mA. LOG100 adopts the advanced integrated circuit technology, and its input current or the ratio of the two input currents vary within the range of 100dB, which can guarantee that the total output error is below the 0.37% of the full-scale output voltage. After the laser adjustment, the internal resistance could achieve the operational accuracy required by the parameters without other modulation. It is easy to use and has low cost and small size, which make the logarithmic computing logical. LOG100 is against the PD151and is assembled in a structure as a photoelectric probe, and then its output end is connected to the major amplifier by the high-frequency cable. The signal processing circuits constituted by the precise switching integrator ACFZ101 and differential amplifier AD602 is adopted to conduct AV conversion and differential amplification process for the output current signal.
3.3 Control system
To achieve the test, the software and hardware are required to support AFT screening device of contaminated feed. As the system requires high reliability, low power and multi I/O interface, MCU (model MSP430F149) is used as the control core, mainly aiming to achieve the interface of other circuits, process the obtained data and express the processing result in some way, such as display or alarm. FTB1 contaminated feed screening device could achieve the real-time sampling and analysis. It is necessary to input the commands, design the human-computer interaction module, install the buzzer alarm and show the exceeding instructions in the detection process. When the FTB1 screening device of contaminated feed is used to conduct detection, the buzzer will alarm and turn on the LED after the FTB1 is detected (red LED light indicates FTB1 abnormal alarm, while the green LED indicates the normal situation). Meanwhile, the data will be displayed by the LCD screen. The communication interface circuit is mainly used to achieve the data communication between host computer and lower computer, and the system uses RS-485 bus communication mode to connect the computer.
There are various development and debugging environments suitable for MSP43O, and IAR Embedded Workbench for MSP430 V5.40 is a very powerful integrated development environment, so it can be used to develop and debug different MSP430 processors, for it could provide a very convenient window interface. In order to facilitate the development and subsequent use and maintenance of the program, the entire program uses a modular structure that consists of a main program and subroutine modules. The main program must first complete the initial work, including setting up the watchdog, the initialization of system clock, interrupt initialization, timer initialization, LCD module initialization and the initialization of other parameters. Then start the timer and turn on the interrupt to make the microcontroller in response to an internal interrupt and external interrupt requests. The function modules include AFTB1 detection, keyboard control, LCD display, and alarm and so on.
CONCLUSION
Once the AFT poisoning of livestock emerges, there are no other effective therapies. If the acute and chronic AFT poisoning occurs, what we should to do is to immediately stop feeding the AFT-contained feed and replace for the pollution-free feed. However, the key to preventing the AFT poisoning is to avoid the AFT-contained feed being eaten. Therefore, to detect the AFT of the feed is an effective way to ensure the health of livestock, which is highly useful for the aquaculture development, and the rapid screening of AFT is an important step in this process. The application shows that the screening device has high detection accuracy, simplified detection process, simple instrument operation, less-professional demanding, low cost and is easy to be inserted in the feed pile, durable and reliable. To sum up, it can reliably detect the AFT content of the feed, keep abreast of changes in feed quality and reduce the damage to the livestock health caused by the feed mildew.
Acknowledgments
REFERENCES
[1] Han Jie, Bian Lianquan, Yu Ning. Heilongjiang Animal Husbandry and Veterinary, 2011 (8) :103-104. [2] Zhang Zhihuai, Cao Jie, Shen Guangrong. Chinese dairy industry, 2012 (3) :50-53.
[3] Wu Guangfeng, Xu Jianjun, Shi Ying. The Quality Safety of Agricultural Products and the Detection Technology [M] Beijing: Chemical Industry Press,2007.143-175.
[4] Gao Yue, Wang Xia, Wang Jihui. Photoelectric Detection Technology and System [M] Beijing: Electronic Industry Press,2009.1-292.
[5] Ye Dongdong, Hua Shi, Ye Ertai, et al. Xinjiang Animal Husbandry, 2012 (4) :38-39. [6] Xue Shuang, Zhang Sanjun. Henan Animal Husbandry and Veterinary, 2012 (9) :29-30.
[7] Yin Jinjian. On the Spectroscopy Detection System of Aflatoxin based on the Induced Dluorescence[D] Changchun: Jilin University 2006.1-80.
[8] Dan Zengliang. On the Silicon Color-sensitive Sensor and Its Application[D] Changchun: Jilin