International Journal of Emerging Technology and Advanced Engineering
Website: www.ijetae.com (ISSN 2250-2459, Volume 2, Issue 5, May 2012)328
Comparison of Medical Image Fusion Algorithm for
Preserving the Edge Information Based On Improved
Wavelet Coefficient Contrast
Mr Vishal R Gupta
1, Mr Vishal Kumar Agarwal
2, Prof S.L.Tade
31 Software Engineer, Persistent System Limited, Pune 2
Associate Engineer, Magnasteyr (India) Pvt. Ltd, Pune
3
Assist Prof Electronics and Telecommunication dept., P.C.C.O.E, Pune
3
Abstract—now a day, multimodality medical image fusion has
drawn lots of attention with the increasing rate at which multimodality medical images are available in many clinic application fields. Radiotherapy plan, for instance, often benefits from the complementary information in images of different modalities. CT scans and MRI scans contains details regarding soft and hard tissues. For medical diagnosis, CT provides the better information on denser tissue with less distortion, while MRI offers better information on soft tissue with more distortion .For Medical applications, these CT and MRI images needs to be fused with high efficiency for diagnosis purpose. Hence medical image fusion has been very important.
In our paper, we have described methods for medical image fusion-simple averaging fusion rule based on wavelet, maximum pixel replacement based on wavelet transform ,contrast based image fusion, discrete wavelet packet based image fusion and discrete packet based image fusion using contrast. Depending upon the requirement of fused image and application, desired method is used. Discrete Wavelet Transform is used as it separates out the low frequency band and high frequency band and further sub bands (i.e. LL, LH, HL, HH bands).
The approximation coefficient i.e. is most commonly fused via uniform averaging. This is because approximation coefficients are interpreted as the mean intensity value of the source images with all salient features encapsulated by the detail coefficient sub-bands at their various scales (Piella, 2003). Therefore, fusing approximation coefficients by averaging maintains the appropriate mean intensity needed for the fusion result with minimal loss of salient features.
In case of simple averaging fusion rule based on wavelet transform, all the sub bands are fused via uniform averaging. But high frequency contains both edge information as well as noise, and due to averaging noise also gets introduced in the final fused image.
In case of maximum pixel replacement based on wavelet transform method, detail coefficients are fused by replacing the maximum pixel value in the fused image. In this method
though maximum edge information is preserved but, more noise is also introduced. Entropy of such fused image is higher.
In our contrast based image fusion, contrast corresponding to detail coefficient is calculated and preserved in the final image. This lead to increase in contrast and edge information in fused image. Power Signal to Noise Ratio (PSNR) of such fused image is higher than other two methods.
In discrete wavelet packet based image fusion method, LL band is again decomposed into L, H, V, D bands and then mean fusion rule is applied to obtain the fused image ,using inverse of the image obtain by fusion rule. Similarly in contrast based method, contrast corresponding to each pixel is calculated and depending upon the contrast, fused image is obtained.
We have compared the results of their above methods and can be concluded that each method has its own application and use, which depends upon the requirement of fused image. In image fusion techniques, contrast and edge information are generally lost. Since these are the salient features from medical diagnosis point of view, needs to be preserved. Hence with use of contrast based image fusion, these parameters can be preserved.
The visual experiments and the quantitative analysis demonstrate that the contrast medical image fusion method can preserve the important structure information such as edges of organs, outlines of tumours compared to other image fusion methods. This characteristic makes the contrast based methods a promising application in medical diagnosis.
Keywords— Medical image fusion, wavelet coefficient
contrast, edge preservation, performance evaluation, Medical diagnosis, discrete wavelet packet transform.
I. INTRODUCTION
International Journal of Emerging Technology and Advanced Engineering
Website: www.ijetae.com (ISSN 2250-2459, Volume 2, Issue 5, May 2012)329 image fusion have been proposed till date. The main aim in image fusion for medical images is to preserve the edge information and contrast because recent image fusion algorithm is prone to reduce the contrast of the fused image. One of the simplest methods to obtain the salient features of both the images in to fused image is just averaging.
Most of the image fusion algorithm aims at obtaining as much as possible information in the fused image, with keeping the error low as possible between the fused image and input image. The resulting image will be more informative than any of the input images. In case of medical images, contains more contrast and edge-like information, which needs to preserve in fused image. In our paper we have proposed and compared methods to preserve contrast and edge information as much as possible using wavelet transform.
Other application can also use this image fusion algorithm for preserving the contrast. Several situations in image processing require high spatial and high spectral resolution in a single image. Most of the available equipment is not capable of providing such data convincingly. The image fusion techniques allow the integration of different information sources. The fused image can have complementary spatial and spectral resolution characteristics. But, the standard image fusion techniques can distort the spectral information of the multispectral data, while merging.
In satellite imaging, two types of images are available. The panchromatic image acquired by satellites is transmitted with the maximum resolution available and the multispectral data are transmitted with coarser resolution. This will be usually, two or four times lower. At the receiver station, the panchromatic image is merged with the multispectral data to convey more information. In following section II we have described simple averaging, in section III image fusion based on maximum pixel replacement fusion rule, in section IV fusion rule based on wavelet coefficient contrast is described. Section V describes discrete wavelet packet transform based image fusion and Section VI described discrete wavelet packet based image fusion using contrast coefficient. Section VII is experimental results that are obtained with MATLAB.
II. SIMPLEAVERAGEMECHANISMBASEDON WAVELETTRANSFORM(M-1)
The input source images is decomposed using discrete wavelet transform (LL, LH, HL, HH bands). The approximation coefficients are most commonly fused via uniform averaging.
This is because approximation coefficients are interpreted as the mean intensity value of the source images with all salient features encapsulated by the detail coefficient sub-bands at their various scales (Piella, 2003). Therefore, according to R. Balasubramanian [9] fusing approximation coefficients by averaging maintains the appropriate mean intensity needed for the fusion result with minimal loss of salient features. Given Y(N)I1,0 and Y(N)I2,0 ,the approximation coefficient sub-bands of images I1 and I2, respectively, at the highest decomposition level N, the approximation coefficients for the fused image F at the highest level of decomposition is given by
Y(N) F,0 = (Y(N) I1,0 + Y(N)I2,0)/2 (1) Also, the detail coefficients of the source images correspond to salient features such as lines and edges detected at various scales. Therefore, a fusion rule for detail coefficients at is same as approximation coefficients fusion rule.
Fig.1 Input Image (CT) Fig.2 Input Image (MRI)
Fig.3 Output Image of (M-1)
International Journal of Emerging Technology and Advanced Engineering
Website: www.ijetae.com (ISSN 2250-2459, Volume 2, Issue 5, May 2012)330 III. MAXIMUMPIXELREPLACEMENTFUSION
RULEBASEDONWAVELETTRANSFORM(M-2)
The maximum pixel replacement fusion rule or absolute maximum (AM) detail coefficient fusion rule selects the detail coefficient in each sub-band with greatest magnitude (Piella, 2003). The input source images is decomposed using discrete wavelet transform (LL, LH, HL, HH bands). The approximation coefficients are most commonly fused via uniform averaging. This is because as said approximation coefficients are interpreted as the mean intensity value of the source images with all salient features encapsulated by the detail coefficient sub-bands at their various scales (Piella, 2003). Therefore, according to R. Balasubramanian [9] fusing approximation coefficients by averaging maintains the appropriate mean intensity needed for the fusion result with minimal loss of salient features.
The detail coefficients of the source images correspond to salient features such as lines and edges detected at various scales. Therefore, a fusion rule for detail coefficients is based upon maximum pixel replacement rule, which states that, given LH1(i.j) and LH2(i,j) , the
detail coefficient sub-bands of images I1 and I2, respectively, at the highest decomposition level N, the detail coefficients for the fused image F at the highest level of decomposition is given by maximum pixel of corresponding band in fused image.
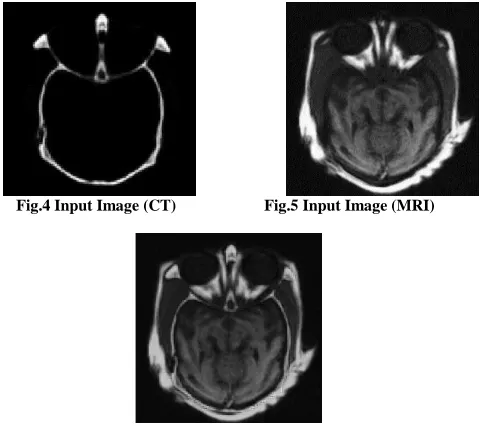
Fig.4 Input Image (CT) Fig.5 Input Image (MRI)
Fig.6 Output Image of (M-2)
Figure 4 and Figure 5 are the source image (i.e. CT and MRI scans); while Figure 6 is the resultant fused image obtained by maximum pixel replacement fusion rule using wavelet transform (M-2).
IV. FUSIONSCHEMEBASEDONTHENEW WAVELETCOEFFICIENTCONTRAST(M-3)
Wavelet multi-resolution expression maps the image to different level of pyramid structure of wavelet coefficient based on scale and direction. According to the rule, image is decomposed by wavelet transform into LL, LH, HL and HH band. Contrast for the coefficient is calculated and after fusion rule inverse wavelet transform is applied to re construct the fused image.
According, to Zhang-Shu Xiao [2] Human Visual System, local luminance is defined as ratio of local high frequency component and intensity of the background of the pixel.
Then vertical, horizontal and diagonal contrast can be defined as ratio of vertical edge information to low frequency information and so on.
Now we supposed that the mean value of the local window of the approximate coefficient be the background of the central pixel of the corresponding local window of the detail component. We took 3 by 3 local window. And the maximum coefficients of detail components are respectively taken as the most salient feature with the corresponding local window along horizontal, vertical and diagonal directions.
Therefore, we obtain three new contrasts Cjv , Cjh , Cjd in the wavelet domain, which represent the most significant feature relative to the background of the local window along vertical, horizontal, and diagonal directions respectively. Based on these new contrasts, an improved image fusion scheme is defined as follows:
The contrast values for both the images are compared, and the image with higher contrast, its pixels is replaced in the fused image. This process is carried for all the three sub-bands.
[image:3.612.47.289.460.673.2]International Journal of Emerging Technology and Advanced Engineering
Website: www.ijetae.com (ISSN 2250-2459, Volume 2, Issue 5, May 2012)331
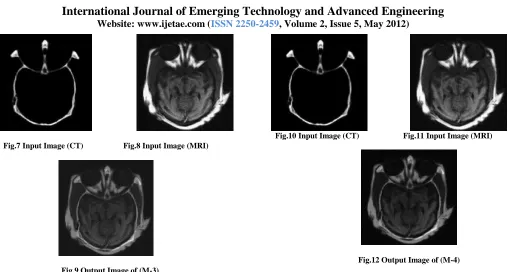
Fig.7 Input Image (CT) Fig.8 Input Image (MRI)
Fig.9 Output Image of (M-3)
Figure 7 and Figure 8 are the source image (i.e. CT and MRI scans); while Figure 9 is the resultant fused image obtained by fusion scheme based on the new wavelet coefficients contrast (M-3).
V. DISCRTEWAVELETPACKETTRANSFORM BASEDIMAGEFUSION(M -4)
Using a pair of low pass filter and high pass filter we split a space corresponds to splitting the frequency content of a signal into roughly a low and a high-frequency components [10]. Similar to wavelet transform, we split only the low frequency component rather than high frequency component which allows better frequency localization of signals.
In this method after decomposing the image into four bands (LL, LH, HL, HH bands), we further decompose the LL band into A, H, V and band in order to improve the better frequency localization of signals. We can apply the mean fusion rule on these inner bands and in turn same for outer bands. We obtain the fused image by inverse wavelet transform.
[image:4.612.53.563.101.373.2]
Fig.10 Input Image (CT) Fig.11 Input Image (MRI)
Fig.12 Output Image of (M-4)
Figure 10 and Figure 11 are the source image (i.e. CT and MRI scans); while Figure 12 is the resultant fused image obtained by fusion scheme based on the wavelet packet transform (M-4).
VI. DISCRTEWAVELETPACKETTRANSFORM BASEDIMAGEFUSIONBASEDONCONTRAST
COEFFICENT(M -5)
This method, discrete wavelet packet transform based on contrast coefficient is same as M-4 method the modification done with addition of fusion rule based on contrast coefficient.
After decomposition, contrast corresponding to the pixel is calculated and pixel values with high contrast are replaced in fused image. This leads to improvement in better frequency localization of signals and preserve the edge information and contrast in an image, with are the most important features of medical image fusion.
International Journal of Emerging Technology and Advanced Engineering
Website: www.ijetae.com (ISSN 2250-2459, Volume 2, Issue 5, May 2012)332
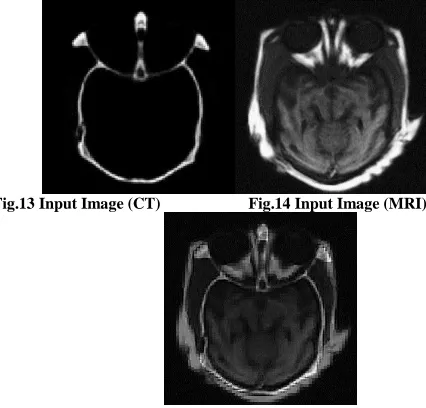
[image:5.612.297.554.106.355.2]Fig.13 Input Image (CT) Fig.14 Input Image (MRI)
Fig.15 Output Image of (M-5)
VII. EXPERIMENTRESULTS
For medical diagnosis, doctors usually observe the images manually and fuse them in the mind. But it is very tedious and tired job. Here, we try to fuse CT/MRI images automatically to reduce this workload. (Image set II)
[image:5.612.56.269.135.339.2]Fig.16 Input Image 1 Fig.17 Input Image 2
Following are the fusion result we the above five methods described.
Fig.18 Output Image of (M-1) Fig.19 Output Image of (M-2)
Fig.20 Output Image of (M-3) Fig.21 Output Image of (M-4)
Fig.22 Output Image of (M-5)
Figure 16 and Figure 17 are the source image (i.e. CT and MRI scans); while Figure 18 to Figure 22 are the resultant fused image obtained by fusion scheme based on the methods (M-1) , (M-2) , (M-3), (M-4) and (M-5).
[image:5.612.47.289.436.544.2]MATLAB simulation the all the above methods yield the following results.
TABLE I
Fusion Methods
Image Set II (CT and MRI scans)
RMSE PSNR Qab/f
Simple Average Fusion Rule
Using Wavelet Transforms. 0.7542 49.4964 0.3105
Pixel Replacement (Max) Fusion Using Wavelet Transform.
0.7566 49.0007 0.3209
Contrast Based Fusion Using
Wavelet Transform 0.7718 49.2931 0.2988
Fusion Using Discrete Wavelet
Packet Transform. 0.7541 49.4948 0.3328
Contrast Based Fusion Using Discrete Wavelet Packet Transform.
[image:5.612.302.579.455.714.2]International Journal of Emerging Technology and Advanced Engineering
Website: www.ijetae.com (ISSN 2250-2459, Volume 2, Issue 5, May 2012)333 VIII. CONCLUSION
The visual experiments and the quantitative analysis demonstrate that the proposed medical image fusion method can preserve the important structure information such as edges of organs, outlines of tumors compared to other image fusion methods. This characteristic makes the proposed methods an efficient application in medical diagnosis. Further practical applications will be investigated in our future work with more medical images.
We can also conclude that image fusion leads to loss of contrast and edge information, which are the important features from medical point of view and which can be preserved using the contrast based method. It can be seen that discrete wavelet packet transform fusion rule have less information as compared to fusion rule of DWPT with contrast based rule because discrete wavelet packet decomposition allows better frequency localization of signals.
Each method has its own application depending upon the requirement of final fused image.
REFERENCES
[1] Merging thermal and visual images by a contrast pyramid, Alexander Toet, Optical Engineering, 28(7), pp. 789-792 [2] Medical Image Fusion Based on An Improved Wavelet Coefficient
Contrast. Zhang-Shu Xiao,2, Chong-Xun Zheng1.Biomedical Engineering Research Institute Xi′an Jiaotong University. [3] A new Contrast Based Image Fusion using Wavelet Packets. R.
Balasubramanian and Gaurav Bhatnagar.
[4] Region Based Image Fusion for Detection of Ewing Sarcoma,Tanish Zaveri and Mukesh Zaveri, Computer Engineering Department, Sardar Vallabhbhai National Institute of Technology, Surat. [5] A Novel Architecture for Wavelet based Image Fusion,Susmitha
Vekkot, and Pancham ShuklaWorld Academy of Science, Engineering and Technology 57 2009.
[6] Burt, P.J, & Adelson, E. (1983). The Laplacian pyramid as a compact image code. IEEE Transactions on Communications, Vol. 31, No. 4, pp. 532-540
[7] Burt, P.J. & Kolczynski, R.J. (1993). Enhanced image capture through fusion, Proceedings of the International Conference on Computer Vision, pp. 173-1982
[8] V. Petrovic and C. S.Xydeas, Objective Image Fusion Performance Measure, Electronics Letters, 2000, 36(4): 308-309.
[9] R. Balasubramanian and Gaurav Bhatnagar ―A new Contrast Based Image Fusion using Wavelet Packets‖ Department of Mathematics, Indian Institute of Technology Roorkee, Roorkee, India.
[10] Area level fusion of Multi-focused Images using Multi-Stationary Wavelet Packet Transform, International Journal of Computer Applications (0975 – 8887) ,Volume 2 – No.1, May 2010.
[11] Gonzalez. R. C. and Woods. R. E., Digital Image Processing (Second Edition), Beijing Publishing House of Electronics Industry, Beijing, 2003.