www.arpnjournals.com
DEVELOPMENT OF PLASMONIC SENSOR FOR DETECTION OF TOXIC
MATERIALS
Marlia Morsin
1,2, Muhammad Mat Salleh
3,
Mohd Zainizan Sahdan
1,2, Siti Zarina Mohd Muji
1,
1
Faculty of Electrical and Electronic Engineering, Universiti Tun Hussien Onn Malaysia,
2
Institute of Microelectronics & Nanotechnology - Shamsuddin Research Centre(MiNT-SRC), Universiti Tun Hussien Onn Malaysia,
86400, Parit Raja, Batu Pahat, Johor, Malaysia
3
Institute of Microengineering and Nanoelectronics (IMEN), Universiti Kebangsaan Malaysia, 43600 UKM Bangi, Selangor, Malaysia
E-Mail: [email protected], [email protected], [email protected], [email protected]
ABSTRACT
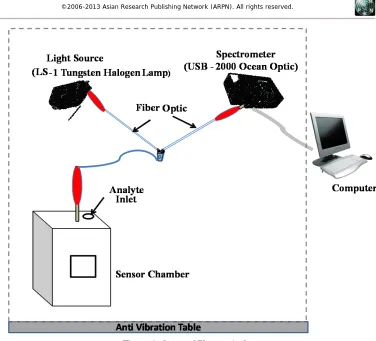
The plasmonic sensor has been developed for the detection of toxic materials in solution form. This system consists of a light source that is connected to a fiber optic duplex system with two arms. The first arm transmits light from the light source beam to the sample and the second arm sent the reflected light from the sample to the spectrophotometer. The sensing process was done in the sensor chamber made from Teflon with a sliding sample drawer is used to place the sample or known as sensing material. OOIBase32 was used to analyze the recorded spectrum from the spectrophotometer. In this study, the testing of the plasmonic sensor was carried out using targeted analyte namely boric acids with deionized water that is set as a reference medium. Two gold nanoparticles shapes which are gold nanosphericals and gold nanoplates were used as sensing materials. As a result, it was found that the plasmonic sensors with the gold nanoparticles as their sensing materials are sensitive toward the presence of targeted analyte. The sensing parameters are based on changing of their resonance peak position and its intensity.
Keywords: Plasmonic Sensor ,Gold Nanoparticles ,Localized Surface Plasmon Resonance (LSPR).
INTRODUCTION
Localized surface plasmon resonance (LSPR) is a resonance phenomenon of free electron waves in a metal nanostructure such as gold, silver and lead which has smaller sizes than light wavelength (Sannomiya & Vörös, 2011). The LSPR has a unique characteristics that gain interest among scientist and researchers in various field such as catalytic, solar cell, Surface-Enhanced Raman Spectroscopy (SERS) and sensor. In sensor application, the implementation of LSPR is very broad because of its sensitivity to dielectric and refractive index of surrounding medium. The LSPR-based sensor also known as plasmonic sensor that has been operated based on the changing of optical characteristics of metal nanostructures in analyte either liquid or gaseous form. The reference medium for LSPR-based liquid usually deionized (DI) water while LSPR-based gaseous is inert gaseous such as nitrogen. The advantage of this sensor is the detection of analyte can be done without changing their chemical properties (Chau et al., 2006; Swalen et al., 1980).
Thus far, there are many researches that have been done using plasmonic sensor. For example, the detection of formilin liquid using gold nanospherical as its sensing material by (Nengsih et al., 2012). Nengsih et. al has developed the plasmonic sensor using gold nanospherical as its sensing material. Other than that, in medical field, the plasmonic sensor has been used to detect the biological marker for Alzheimer (Haes et al., 2005; Yang et al., 2014) and cancer cell (Ma et al., 2014). There are also researches on plasmonic sensor using air as a medium for example the research done by Kreno (Kreno et al., 2010). The sensor has been developed to detect a toxic gaseous namely carbon monoxide (CO) and sulfur hexafluoride (SF6).
This paper reports a development of plasmonic sensor to detect toxic materials. The toxic material that has been investigated in this study is boric acid. Boric acid is poisonous and declared as unsafe to be used as preservatives and additives in foods by FAO/WHO Expert Committee (Litovitz et al., 1988). However,it is used by small scale producers in food processing to control freshness and enhance colour, texture and flavor (See et al., 2010). In this study, the fabrication of plasmonic sensor and all the components used will be discussed. The models of sensing materials to be used in the sensor system will also be proposed.
DEVELOPMENT OF PLASMONIC SENSOR
Setup of Plasmonic Sensor
Figure 1: Setup of Plasmonic Sensor
The following describes the function of each components in this sensor system:
A. Light Source
Light source is a device that provides electromagnetic radiation visible light to excite the resonance properties of metal nanoparticles such as gold. In this sensor system, the light source is made of tungsten lamp; LS-1 Halogen Tungsten model from Ocean Optics, USA. This lamp will emit visible light and near infrared radiation with wavelength in the range of 360 nm - 2500 nm. The lamp has an output power of 6.5 W and the time required for the stable condition is about 10 minutes.
B. Duplex Fiber Optical Probe System
Duplex fiber optic system acts as a light channel from the light source to the sample inside the sensor chamber and subsequently sent the reflected light by the sample to spectrophotometer. In this system, R400 model - Angle - Vis from Ocean Optics, USA is used as the fiber optical probe system. It is made of pure silica core with a diameter of 400 m ± 8 m and able to transmit electromagnetic wavelength from 400 nm to 2500 nm. This optical fiber consists of two parts arm; the end of the first arm is connected to the light source while the end of the second arm is connected to the spectrophotometer. These two ends meet at a probe in the duplex fiber optical system. This probe is placed perpendicular to the sample inside the sensor chamber. There are two channels in the probe where the first channel will emit the incident light to the sample and the second channel in the probe will collect the reflected light reflected from the sample and sent to a
spectrophotometer as explained previously. The red rubber rods are used as connector at the end of each fiber optics. The process is shown in Figure 2.
Figure 2: The optical probe in the duplex fiber optical system
C. Sensor Chamber
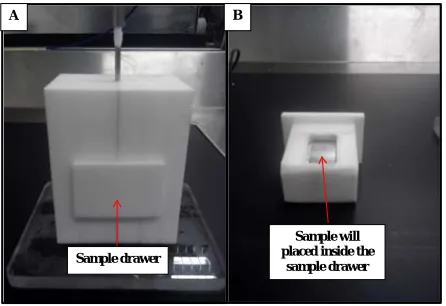
[image:2.595.322.535.485.663.2]foundation. The sample substrate will be placed on a reflector mirror inside the drawer during the experiment. The drawer dimension is 1.5 cm x 2.2 cm x 0.8 cm. The reflector mirror is used to reflect all the emitted lights towards the sample sensor. The upper sensor chamber is drilled to create hole to accommodate fiber optical system probe. This fiber optical probe is then placed vertically in the hole of sensor chamber. The distance between the probe tip and the sample substrate is 0.1 cm. During the experiment, the sample drawer will be filled with air or liquid i.e.; deionized water and targeted analyte. Figure 3 illustrates the designed sensor chamber.
A B
Sample drawer
Sample will placed inside the
[image:3.595.57.280.238.391.2]sample drawer
Figure 3: The design of sensor chamber (A) Sensor chamber (B) Sample drawer
D. Spectrophotometer
Spectrophotometer acts as a recorder of reflected light spectrum by the sample that has been passed through fiber optical system. In the optical sensor system, HR 2000 supplied by Ocean Optics, USA was used as the spectrophotometer model,. It is capable of detecting light of wavelength in the range from 200 nm to 1100 nm with an optical resolution of 0.035 - 6.8 nm FHWM. The spectrophotometer system consists of 2-MHz analog-to-digital converter (ADC), electronic pre-program, 2048 element of CCD Camera - linear detector arrays charge coupling device from Sony ILX511 model and high-speed USB port. The data recorded by the spectrophotometer will be sent to the computer via the USB port.
E. Data Analysis Software
A personal computer is the last component in the optical sensor system that includes a commercial data software to analyse data obtained from the spectrophotometer. The software is OOIBase32. The software allows there are three types of measurement modes namely absorption, reflection and transmission. In this study, the absorption mode was chosen as the measurement mode.
SENSOR OPERATION
The sensor operation starts with warming uo process to ensure stability in the measurement, light and spectrophotometer. All the components were switched on
for an hour before sensing process is carried out. During this period, the targeted analyte will be prepared with deionized water chosen as a solvent. The OOIBase32 was set to absorption mode, and thus the reflected light from the sample been collected by the optical fiber probe will be converted directly into optical absorbance readings.
Before starting the sensing process, the reading of the light spectrum for a blank quartz substrate was recorded and will be used as a baseline. This procedure is to ensure the effects of absorption by the substrate is removed before the actual measurement using actual sample is taken. The measurement on the sample will be done in three mediums; air, deionized water and targeted analyte. In liquid medium, the bottom of the probe is set to be immersed in the solution. Total optimal solution for each sensing process is 1.3 mL to enable the probe to dip. Once the sensor system has achieved its stability especially from surrounding noise, the spectrum readings wil be recorded.
TESTING AND RESULTS
The sensor system was tested using different sensing materials such as gold nanospherical and gold nanoplates. In this study, the targeted analyte chosen was a toxic materials in a food preparation namely boric acids. The results are shown in Figure 4.
The optical response of gold nanosphericals toward boric acid shows the LSPR spectra of gold nanosphericals. This is achieved when the sample was first immersed in the deionized (DI) water and followed by in 1 mM boric acid solution as depicted in Figure 4 A (i). It was observed that a single peak that is associated with transverse SPR (t-SPR) (B. Sepúlveda et. al, 2009 and Marlia et. al, 2012) emerges and it presents for each testing medium; DI and boric acid. The peak position of the spectrum in water is 545 nm and right-shifted by 1 nm in the presence boric acid. The FESEM image for gold nanospherical as shown in Figure 4 A (ii).
Wavelength (nm)
450 550 650 750
Wavelength (nm)
450 550 650 750
0.5 0.4 0.3 545 546 Absorban ce
0.6 A (ii)
t-SPR A (i)
400 500 600 700 800 Wavelength (nm) 0.1 0 A bs o rba nc e 0.3 0.2 0.5 0.4 0.35 0.25
600 800 0.3
0.2
450 650 t-SPR
l-SPR
[image:4.595.47.282.71.371.2]. (ii) . (i)
Figure 4: The spectra of gold nanoparticles in 2 different medium; lower line -deionized (DI) water and upper line - 10 mM boric acid. The sensing materials used are (A) gold nanosphericals and (B) gold nanoplates. Scale bar for FESEM images : 100 nm.
The resonance peaks can be related to the shapes of the gold nanoparticles. The higher the number of edge of gold nanoparticles, the higher the number of peaks that presents the number of sensing parameters (Petryayeva & Krull 2011 and Tréguer-Delapierre et al. 2008).
Hence, it was found that the plasmonic sensor with the gold nanoparticles as sensing material is sensitive toward the presence of targeted analyte with resonance peak position and its intensity are measured as sensing parameters.
CONCLUSION
In this study, the plasmonic sensor was succesfully developed for toxic materials detection. The sensing parameters are based on changing of their resonance peak position and its intensity.
For future work, the researcher should control the fabrication of sensing materials to produce a sharp and accurate peak position as well as intensity so that the sensitivity of this plasmonic sensor can be increased.
ACKNOWLEDGEMENT
The authors would like to acknowledge Universiti Kebangsaan Malaysia for all the facilities used in this work. The author also would like to thank Dr. Rahmat Sanudin for his technical assistance.
REFERENCE
Chau, L.-K., Lin, Y.-F., Cheng, S.-F. & Lin, T.-J. (2006). Fiber-Optic Chemical and Biochemical Probes Based on
Localized Surface Plasmon Resonance. Sensors and Actuators B: Chemical 113(1): pp. 100-105.
Haes, A. J., Chang, L., Klein, W. L. & Van Duyne, R. P. (2005). Detection of a Biomarker for Alzheimer's Disease from Synthetic and Clinical Samples Using a Nanoscale Optical Biosensor. Journal of the American Chemical Society 127(7): pp. 2264-2271.
Kreno, L. E., Hupp, J. T. & Van Duyne, R. P. (2010). Metal− Organic Framework Thin Film for Enhanced Localized Surface Plasmon Resonance Gas Sensing. Analytical Chemistry 82(19): pp. 8042-8046.
Litovitz, T. L., Klein-Schwartz, W., Oderda, G. M. & Schmitz, B. F. (1988). Clinical Manifestations of Toxicity in a Series of 784 Boric Acid Ingestions. The American Journal of Emergency Medicine 6(3): pp. 209-213.
Ma, X., Truong, P. L., Anh, N. H. & Sim, S. J. (2014). Single Gold Nanoplasmonic Sensor for Clinical Cancer Diagnosis Based on Specific Interaction between Nucleic Acids and Protein. Biosensors and Bioelectronics
Marlia, M., Umar, A. A., Oyama, M., Salleh, M. M. & Majlis, B. Y., (2012), High Sensitivity of High Sensitivity Localized Surface Plasmon Resonance Sensor of Gold Nanoparticles : Surface Density Effect for Detection of Boric Acid 10th IEEE Inter. Conf. on Semiconductor Elec. (ICSE), pp. 352 – 356
Morsin, M., Salleh, M. M., Umar, A. A. & Yahaya, M. (2014). Localized Surface Plasmon Resonance Sensor of Gold Nanoplates for Detection of Boric Acid. Key Engineering Materials, 605, pp. 356-359.
Nengsih, S., Umar, A. A., Salleh, M. M. & Oyama, M. (2012). Detection of Formaldehyde in Water: A Shape-Effect on the Plasmonic Sensing Properties of the Gold Nanoparticles. Sensors 12(8): pp. 10309-10325.
Petryayeva, E. & Krull, U. J. (2011). Localized Surface Plasmon Resonance: Nanostructures, Bioassays and Biosensing—a Review. Analytica Chimica Acta 706(1): 8-24.
Sannomiya, T. & Vörös, J. (2011). Single Plasmonic Nanoparticles for Biosensing. Trends in Biotechnology 29(7): pp. 343-351.
Sepúlveda, B., Angelomé, P.C, Lechuga, L.M. and Liz-Marzán, L.M., (2009), LSPR - based Nanobiosensors, NanoToday vol 4 (3), pp. 244 – 251
Swalen, J., Gordon, J., Philpott, M., Brillante, A., Pockrand, I. & Santo, R. (1980). Plasmon Surface Polariton
Dispersion by Direct Optical Observation. Am. J. Phys 48(8): pp. 669-672.
Tréguer-Delapierre, M., Majimel, J., Mornet, S., Duguet, E. & Ravaine, S. 2008. Synthesis of Non-Spherical Gold Nanoparticles. Gold Bulletin 41(2): 195-207.
Umar, A. A., Oyama, M., Salleh, M. M. & Majlis, B. Y. (2009), Formation of High-Yield Gold Nanoplates on the Surface: Effective Two-Dimensional Crystal Growth of Nanoseed in the Presence of Poly(Vinylpyrrolidone) and Cetyltrimethylammonium Bromide. Crystal Growth and Design 9(6): 2835-2840.