COMPARATIVE STUDY OF BLOCK- BASED IMAGE SEGMENTATION
TECHNIQUE
Selvapriya B1, Raghu B2 1
Research Scholar, Department of Computer Science and Engineering, Bharath University, Chennai, India.
2
Professor and Dean, Department of Computer Science and Engineering, SVS Group of Institutions, Chennai, India.
ABSTRACT
Due to the advent of computer technology image-processing techniques have become increasingly important in a wide variety of applications. Image segmentation is a classic subject in the field of image processing and also is a hotspot and focus of image processing techniques. Several general-purpose algorithms and techniques have been developed for image segmentation. Since there is no general solution to the image segmentation problem, these techniques often have to be combined with domain knowledge in order to effectively solve an image segmentation problem for a problem domain. This paper presents a comparative study of the basic Block-Based image segmentation techniques.
Keywords: Image processing; Image segmentation; Image engineering; Image analysis; Image understanding.
1. INTRODUCTION
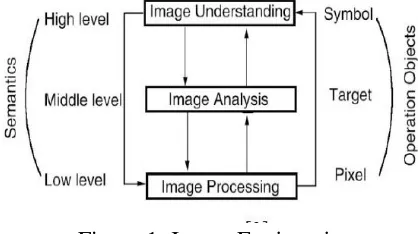
“The whole is equal to the sum of its parts”. Figure-ground segmentation referred as a target or foreground other part is called background is an important problem i.e., extract and separate them in order to identify and analyze object, in image processing. Segmentation is the process that subdivides an image into its constituent parts or objects. The level to which this subdivision is carried out depends on the problem being solved, i.e., the segmentation should stop when the objects of interest in an application have been isolated. Image Engineering illustrates the level of the image segmentation in image processing. Image Engineering can be divided into three levels as shown in Fig. 1. Image processing is low-level operations; it operated on the pixel-level.
International Research Journal of Mathematics, Engineering and IT Vol. 3, Issue 12, December 2016 Impact Factor- 5.489 ISSN: (2349-0322)
© Associated Asia Research Foundation (AARF)
Figure 1: Image Engineering
Starts with one image and produces a modified version, image into another form, of the same, or the transformation between the images and improves the visual effects of image. Image processing following three stages each is subdivided into different categories:
1) Reconstruction (Correction)
a. Restoration: Removal or minimization of image degradations. Two types: Radiometric and Geometric.
b. Reconstruction: Derive an image, two or higher dimensional, of inside view from several one-dim projections.
c. Mosaic: Combining of two or more patches of image- required to get the view of the entire area.
2) Transformation
a. Contrast stretching: Homogeneous images which do not have much change in their levels. b. Noise filtering: to filter the unnecessary information. Filters like low pass, high pass, mean, median etc...
c. Histogram modification: E.g., Histogram Equalization.
d. Data compression: Higher compressed each pixel by: DCT by JPEG or Wavelet for with minimum loss.
e. Rotation: In mosaic to match with the second image. 3-pass shear is a common. 3) Classification
a. Segmentation: Subdivides an image into its objects depends on the problem.
b. Classification: Pixels labeling based on its grey value. Types of 'Spectral Analysis', in Remote Sensing imagery, are: Supervised are the known types of land while Unsupervised are the unknown ones.
2. METHODS FOR IMAGE SEGMENTATION
Image segmentation techniques or methods are classified into two main categories Layer-Based Segmentation Methods and Block-Based Segmentation Methods see Fig. 2. Layer-Based Segmentation Methods Layered model: for object detection and image segmentation that composites the output of a bank of object detectors in order to define shape masks and explain the appearance, depth ordering, and that evaluates both class and instance segmentation. This type didn't discuss in this paper. And Block-Based Segmentation Methods which is based on various features found in the image. This might be colour information that is used to create histograms, or information about the pixels that indicate edges or boundaries or texture information. Block-Based Image Segmentation methods are categorized on two properties: discontinuity and similarity into three groups:
1. Region Based Methods: based on discontinuities. 2. Edge or Boundary Based Methods: based on similarity. 3. Hybrid Techniques.
These are the methods which were discussed in this paper, while there are two additional Block-Based Image Segmentation methods or categories: Pixel-Based Segmentation: or Point-Based Segmentation. And Model-Based Segmentation: The human vision system has the ability to recognize objects even if they are not completely represented. It can be applied if the exact shape of the objects in the image is known.
Segmentation is a process that divides an image into its regions or objects that have similar features or characteristics.
Figure 2: Methods of Image Segmentation
1. Region Based Methods: Divide the entire image into sub regions or clusters, e.g. all the pixels with same grey level in one region.
1.1. Clustering: K-mean: splits an image into K groups or clusters by adding points, p, to the cluster where the difference between the point and the mean is smallest.. Hard clustering assumes sharp boundaries between clusters. Fuzzy clustering: shape-based image segmentation algorithm.
Disadvantages: some clustering algorithms like K-means clustering doesn‟t guarantee continuous areas. This drawback is overcome by Split and Merge technique.
1.2. Split and Merge: Two parts: Initially the whole image which is taken as a single region is repeatedly split until no more splits are possible, Quad tree is a splitting data structure, then two regions are merged if they are adjacent and similar, merging is repeated until no more merging is possible.
Three steps: using Improved Quad Tree (IQM), 1st splitting the image, 2nd initializing neighbours list and the 3th step is merging splitted regions. Advantages: connected regions are guaranteed and IQM reduces lengthy† neighbour problems during merging. Disadvantages: the position and orientation of the image lead to blocky final segmentation and regular division leads to over segmentation (more regions) by splitting. This drawback can be overcome by using Normalized cuts.
1.3. Normalized Cuts: Normalized cuts aim at optimal splitting by reducing number of regions. This method is based on graph theory. Each pixel is a vertex in a graph, edges link adjacent pixels. Weights on the edge are assigned according to similarity, distance, colour, grey level or textures and so on between two corresponding pixels . Applications: medical images.. Advantages: no need to merge regions after splitting, better edges definition, new optimality criterion for partitioning a graph into clusters and different image features like intensity, colour texture, contour continuity are treated in one uniform network.
Disadvantages: complex computational.
1.4. Region Growing: Region growing is one of popular methods. Starts with a pixel and will go on adding the pixels based on similarity, to the region, repeat until all pixels belong to some region. Applications: segment the parts of human body. Advantages: connected regions are guaranteed; multiple criterions at the same time and give very good results with less noisy. Disadvantages: over segmentation when the image is noisy or has intensity variations, cannot distinguish the shading of the real images and power and time consuming.
1.5. Threshold: is separating foreground or object from the background into no overlapping sets.
Threshold segmentation techniques grouped in classes:
Local techniques are based on the local properties of the pixels and their neighbourhoods.
Global techniques segment an image on the basis of information obtain globally (e.g. by using image histogram; global texture properties).
Split, merge and growing techniques use both the notions of homogeneity and geometrical proximity in order to obtain good segmentation results.
Pixels are classified, using range values or Threshold values to: 1st Global threshold where a single threshold value is used in the whole image, 2nd Local, (adaptive), threshold value is assigned to each pixel to determine whether it belongs to the foreground or the background pixel, 3rd Threshold value T is selected by analysing image histograms which can be one of two models: 1st Bimodal histograms present two peaks and a clear valley, T is the valley point , 2nd Multimodal histograms, see Fig. 3, are more complex, with many peaks and not clear valleys so it is not easy to select the value of T .
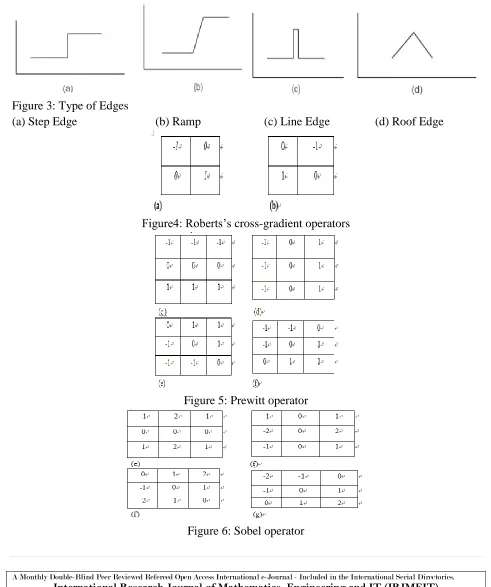
Figure 3: Type of Edges
(a) Step Edge (b) Ramp (c) Line Edge (d) Roof Edge
Figure4: Roberts‟s cross-gradient operators
Figure 5: Prewitt operator
Threshold Technique
Mean Technique: uses the mean value of the pixels as the threshold value.
P-Tile Technique: one of the earliest threshold methods, uses knowledge about the area size of the object, based on the grey level histogram, assumes the objects are brighter than the background and occupy a fixed percentage, known as P%, of the picture area. Applications: Suitable for all sizes of objects. Advantages: Simple and yields good anti-noise capabilities. Disadvantages: It is not applicable if the object area ratio is unknown or varies.
Histogram Dependent Technique (HDT): Dependent on the success of estimating the threshold value thatseparates the two homogenous region of the object and background. Applications: for image with largehomogenous and will separate regions.
Edge Maximization Technique (EMT): depend on the maximum edge, edge detection techniques, threshold to start segmentation and automatic‡ threshold performance becomes much better.
Applications: for image with more than one homogenous region. Advantages: avoid merging between object and background.
Visual Technique: Novel way, as P-Tile. Disadvantages: don't active when the, in general, threshold techniques are suitable for simple applications. Cause of binary image, and the way of segmentation, computationally inexpensive and fast it is the simplest, and widely used for image segmentation. Multilevel threshold to segment complex images.
2. Edge or Boundary Based Methods
Edge detection techniques transform images to edge images using the changes of grey tones in the images. Edges are the sign of lack of continuity, and ending. Objects consist of numerous parts of different colour levels . Edges are local changes in the image intensity and Edges occur on the boundary between two regions
Types of Edges: As shown in Fig. 3. Step edge, image intensity abruptly changes from one value on one side of the discontinuity to a different value on the opposite side. Line Edges, image intensity abruptly changes value but then returns to the starting value within short distance. However, Step and Line edges are rare in real images because sharp discontinuities rarely exist in real signals. Ramp Edges reality of Step edges. Roof edges reality of Line Edges . Edge Detection Steps: 1st Filtering: filter the unnecessary information called noise which is random variations in intensity values, while more noise filtering results losing in edge strength . 2nd Enhancement: facilitate the detection of edges by determining point neighborhood intensity changes.
3rd Detection: determine edges points while many not edges points in an image have a nonzero value for the gradient.
Types of Discontinuities
In the grey level are Point, Line and Edges. Spatial masks can be used to detect all types of discontinuities.
2.1. Edge Detection Methods
2-D Spatial Gradient Measurements on an image as follows :
2.1.2. Prewitt§ Detection: Estimate the magnitude and orientation of an edge using the 3x3 neighbourhoods for eight directions which are calculated and the largest convolution mask is then selected as Fig. 5.
2.1.3. Sobel Detection: One kernel, 3x3, is the other rotated by 90o as Fig. 6. 2.2. Edge Detection Soft Computer approaches
2.2.1. Fuzzy Logic Based Approach
Pixels are divided into fuzzy sets i.e. each pixel may belong partly to many sets and regions of image as Fig. 9 . Fig. 10 shows the fuzzy rules for edge detection and neighbourhood of a central pixel of the image.
2.2.2. Genetic Algorithm Approach
Derives from the evolution theory, consists of three major operations: selection, crossover, and mutation. GA used in pattern's recognition applications. Fuzzy GA fitness functions were considered.
2.2.3. Neural Network Approach
Important differences between neural networks and other AI techniques are their abilities to learn and generalize. The network "learns” by adjusting the interconnection, weights, between layers, and generalizes relevant output for a set of input data. Artificial neural networks (ANN) are applied for pattern recognition. Self organization of Kohonen** Feature Map (SOFM)†† network is a tool for clustering. The neural network consists of three layers: Input layer,
Hidden layer,and output layer. A neuron has a normalized between [0-1] as input and output. Each layer is having (I x J), image size and neurons. Each neuron is connected to respective neuron in the previous layer with its d order neighbourhood.
Comparison of Edge Detection Methods
In general Edge or Boundary Based techniques have the following characteristics: Applications: medical image processing, biometrics etc. .
Advantages: Edge detection is an important in image analysis, i.e., important features can be extracted from the edges (e.g., corners, lines, curves). These features are used by higher-level computer vision algorithms (e.g., recognition).
3. MODELS IN BLOCK BASED SEGMENTATION
The following sub sections discuss the two models in block based segmentation. 3.1. AC-Coefficient Based Model
The first model uses the AC coefficients introduced during DCT to segment the image into three blocks, background, text/graphic and image blocks [12]. The background block has smooth regions of the image while the text / graphics block has high density of sharp edges regions and image block has the non-smooth part of the compound image. AC energy is calculated from AC coefficients and is combined with a user-defined threshold to identify the background block initially. The AC energy of a block „s‟ is calculated using Equation (1).
Es= 63𝑖=1𝑦2 s,i ……….(.1)
non-smooth block is classified into two classes, text and image, using k-means clustering algorithm. Different algorithms are then used to compress the three regions of a compound image. The following figure 7 shows the overall design of AC-coefficient model.
Figure 7: AC-Coefficient Based Segmentation 3.2. Histogram Based Model
The second block-based segmentation model uses a histogram-based threshold approach . This model uses a series of decision rules to segment an image. The existing segmentation classifies an image into four regions, which is modified into five regions. The decision rules are modified to include an extra rule with other threshold to handle the fifth region, which is called the residue or overlapping or complex region. This region in the existing model was treated as a picture block, but in reality might have text and/or graphics and/or picture regions. This has to be separated from the picture block, so that the compression of picture block will be enhanced. And special treatment of overlapping block might enhance both segmentation and compression processes. The segmentation process involves a series of decision rules from the block type with the highest priority to the block type with the lowest priority. The decision for smooth and text blocks is relatively straightforward. The histogram of smooth or text blocks is typically dominated by one or two intensity values (modes). Separating the graphics and image blocks is challenging. Since the maximum size of color palette in color indexing strategy is four, a block is declared to be a graphics block only if the number of modes is no larger than four. When the block size is reasonably small, the likelihood that there are more than four different colors within a graphics block is small.
The algorithm starts by calculating the probability of intensity value i, where i = 0... 255 using Equation
Pi =freq(i)/B2 ………(2)
Where B is the block size and a value of 16 is used in the experiments. Next the mode (m1…mx) is calculated and the cumulative probability around the mode m is computed using Equation (3).
Cn = 𝑚 +𝐴𝑚 −𝐴𝑝 i ………(3)
4. COMPRESSION TECHNIQUES
union reproduces the entire original image. These regions are then compressed using techniques, which are either existing or newly proposed. The image is segmented into regions listed below. The smooth (background/foreground/one colored) regions
The text region
The picture or image region The graphics region
The overlapping region
The smooth and graphics regions are compressed using arithmetic coder and palette-based coder respectively. The text region is compressed using the XML coder, Token based coder and the image, and overlapping regions are compressed using the modified JPEG coder.
5. Experimental Results
The following Figure 3 is the combination of all classes of compound images, which are used for testing
[image:9.612.163.451.518.628.2]Figure 8: Computer Generated
(a)Image (CGI) (b) Text Image(TI)
To assess the performance of the proposed models the three standard performance metrics used are
(i) Compression Radio
(ii) Peak Signal to Noise Radio
The compression ratio is calculated using the below formula, which is shown in equation (4). Compression Ratio =1 – (Compressed size / Original size)*100 (4)
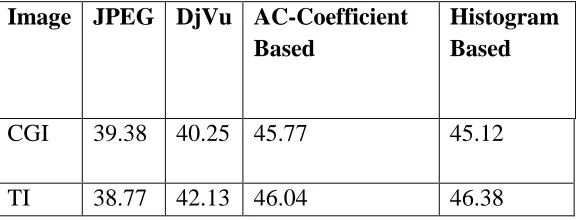
The Table 1 shows the compression ratio of the two proposed methods.
Image JPEG DjVu AC-Coefficient Based
Histogram Based
CGI 39.38 40.25 45.77 45.12
TI 38.77 42.13 46.04 46.38
The peak signal to noise ratio is used to measure the visual quality of the image. The high PSNR indicates the decompressed image have good quality. The Peak Signal To Noise Ratio is calculated using the formula,
PSNR=10.log10 (MAX 2I/MSE)…….(.4)
The Table –II shows the results of PSNR The high PSNR indicates high quality of the image.
Table-II Peak Signal to Noise Ratio(%)
Method Used CGI TI
JPEG 40.37 43.92
DjVu 44.66 46.33
AC-Coefficient Based
47.46 47.92
Histogram Based 48.23 48.18
6. Conclusion
This paper attempts to enhance two block based segmentation methods .The performance of the histogram based method and AC-Coefficient based method are compared with compression ratio, PSNR. From the performance analysis the histogram based segmentation method achieves good results compared with AC-Coefficient method.
References
1. Muzamil Bhat. "Digital Image Processing". International Journal of Science & Technology Research, Volume 3 (issue 1), ISSN 2277-8616, Jan 2014..
2. Pushmeet Kohli, Stefanie Jegelka, "A Principled Deep Random Field Model for Image Segmentation", 2013.
3. Nikita Sharma, Mahendra Mishra, Manish Shrivastava."Color Image Segmentation Techniques and Issues: An Approach". International Journal of Science & Technology Research, Volume 1 (issue 41), ISSN 2277-8616, May 2012.
4. G. Feng and C.A. Bouman, “High-quality MRC document coding”, IEEE Trans. on Image Processing, Vol. 15, No. 10, pp. 3152- 3169, Oct. 2006.
5. A. Zaghetto and R. L. de Queiroz, “Iterative Pre- and Post-Processing for MRC layers of scanned documents,” IEEE ICIP 2008, pp. 1009-1012, Oct. 2008.
6. Wenpeng Ding, Dong Liu, Yuwen He, Feng Wu, “Block-based fast compression for
compound images”, International Conference on Multimedia & Expo (ICME), pp 809-912, 2006.
8. Dorin Comaniciu, Peter Meer. "Robust Analysis of Feature Spaces: Color Image Segmentation”.
9. Li, X. and Lei, S.”Block-based segmentation and adaptive coding for visually lossless compression of scanned documents”,Proc. ICIP, VOL. III, PP. 450-453,2001.