AN EFFECTIVE THRESHOLD SELECTION ALGORITHM FOR IMAGE SEGMENTATION OF
LEAF DISEASE USING DIGITAL IMAGE PROCESSING
Shripriya.R
M.E. (Computer Science and Engineering) KPR Institute of Engineering and Technology
Arasur, Coimbatore
N.Yuvaraj M.E, MISTE, (Ph.D), Assistant Professor,
Department of Computer science and engineering KPR Institute of engineering and technology
Arasur, Coimbatore
Abstract— Agriculture has become much more than simply
a means to feed ever growing populations. In India 70% population depends on agriculture. The plant diseases effect the humans directly by health. To detect these plant disease using digital image processing techniques focused on accurate segmentation of healthy and diseased tissue. However, It was not always possible to achieve accurate segmentation. This is usually due to a lack of a color transformation by which the symptoms can be fully separated from healthy tissue. Also, The segmentation results are affected by number of threshold and threshold values. Here proposes different methods for determining optimal thresholds using optimization techniques namely hybrid parallel FO model. The proposed algorithm was tested under a wide variety of conditions, such as plant species, diseases and images collected under controlled and uncontrolled conditions. This algorithm was proved to detect the wide variety of plant diseases.
Keywords--- Leaf symptoms, Disease diagnosis, Color space transformations, HPFO, Color histogram
1) INTRODUCTION
[1]Digital image processing is the utilization of various algorithms to perform the image processing on digital images. Digital image processing techniques has wide range of applications in agricultural field for the purpose of plant disease prediction, plant growth monitoring and so on.
In Plants, diseases are mainly occurred due to the impairment of normal physiological function of plants which produce characteristic symptoms. Diseases are mainly caused by pathogens. [4]These pathogens are found on the leaves or stems of the plant. At this instance, image processing plays a vital role in detecting the diseases in plants. The detection of leaf diseases has various processes such as image segmentation, feature extraction, and feature classification and etc.
The plant disease detection and diagnosis based on digital image processing methods depends on the precise segmentation of diseased and healthy leaf tissue. Different segmentation algorithms are used for detecting the plant disease based on digital image processing. However, the major
issue in segmentation is prediction accuracy and the distortion in images will degrade the classification accuracy.
2) REVIEW OF DETECTION METHODS 2.1) Fuzzy Set
Using the fuzzy correlation criterion the target boundaries and background image, so removing this interfering information is very necessary by removing this interfering information. The complex background images and the image target segmentation error, considering the dominance on image processing of fuzzy sets, the maximum fuzzy correlation criterion is proposed. Image is converted to a fuzzy domain, and then the maximum fuzzy correlation criterion is calculated. It is important to optimize the image maximum fuzzy membership function. Finally, leaf and fruit agricultural image segmentation results and run-time are analyzed, whether bright or dark parts of the image, the target object can be detected more edge details by fuzzy sets[6]. 2.2) Discrete wavelet transform
Discrete wavelet based method is applied for analysis the frequency content in the image, considered as a signal and also analysis the textures characteristics. [8] Discrete wavelet transform to improve the segmentation for agricultural images. This approach initially extracts greenness based on vegetation indices then the resultant image was used in wavelet application to extract spatial structures in three bands were horizontal, vertical and diagonal used wavelet which gives more detailed information. The spatial variability in those three bands was captured from texture descriptors and then combined greenness and texture information to enhance the plants identification. Finally segmentation occurred based on image threshold[8].
2.3) Automatic prediction of plant disease based on color segmentation
An image-processing based method that identifies the visual symptoms of plant diseases, from an analysis of colored images. [2]The transformed image is then segmented by analyzing the distribution of intensities in a histogram. Rather than using the traditional approach of selecting the local minimum as the threshold cut-off, the set of local maximums are located and the threshold cut-off value is determined according to their position in the histogram. This technique is
particularly useful when the target in the image data set is one with a large distribution of intensities. In tests, once the image was segmented, the extracted region was post-processed to remove pixel regions not considered part of the target region. This procedure was accomplished by analyzing the neighborhood of each pixel and the gradient of change between them. To test the accuracy of the algorithm, manually segmented images were compared with those segmented automatically. In first step to specify a suitable color transformation that best highlighted the diseased regions shown in the picture. To develop a filter that could highlight those regions considered targets. To identify regions in the image that was likely to qualify as diseased region[2].
2.4) Computer vision based segmentation
Computer vision based segmentation is an automatic disease detection using marker-controlled watershed segmentation, super pixel based feature analysis and classification. The system can take an image as input and automatically classify it into different categories of diseases and also assess how severe that type of disease is. Their work provides added value and complement the existing research efforts. Development of a new way to select features based on textural, Gabor, gradient and biologically inspired features for efficiently automatic disease recognition and severity assessment on crop images.[9] Finally develop Prototype of disease recognition system. Our case is a typical classification task which classifies an unknown image into a right class (i.e. healthy or unhealthy. The unhealthy category could be either Yellow rust or Septoria diseases). A high-level overview of our classification system for disease diagnosis is developed. There are three stages including training stage, testing and evaluation stage and deployment stage. During the training stage, we need to train the classification model based on a training set of images with human annotations. At the testing stage the performance of the classification model has to be evaluated in terms of accuracy. Finally, when the performance is satisfactory, at the deployment stage the model has to be deployed to perform the classification of images without annotation. This work mainly focuses on the training, testing and evaluation stages[9].
2.5) Bayesian segmentation Method
Gemini virus attack in chili by using Bayesian segmentation method.[20] The chili farms that were exposed by Gemini virus which were analyzed by aerial images captured with the location perpendicular to the earth surface. Image acquisition was made through aerial photography through multi-copter. Bayesian segmentation was used to determine the level of virus attacks on individual plant with a 3-dimensional input color component such as Red, Green, and Blue and 4 segmentation targets[20].
2.6) OTSU and CANNY operators to segment the targeted leaf In investigated adaptive threshold based segmentation method for leaf image. The leaf image was segmented by analyzing foreground and background images jujube leaf
which picks input image randomly from an online system. The threshold value was chosen with the help of Mapping Function, the Shape Identification algorithm and pattern recognition which was used in OTSU and CANNY operators to segment the area of targeted leaf. Thus the optimization process of the algorithm is designed to get an entire leaf edge[24].
2.7) Semi-automatic segmentation method
In developed semi-automatic segmentation algorithm of plant leaf disease symptoms using digital image processing. The algorithm was based on the grayscale histograms and provided for distinguishing signs and symptoms of plant disease from asymptomatic tissues in leaves. The histograms of H from HSV color space and a* color channels from L*a*b color space were manipulated by this algorithm. An in-depth analysis of the issues such as lesion delimitation, illumination, leaf venation interference and leaf roughness of disease symptoms segregation was discussed[3].
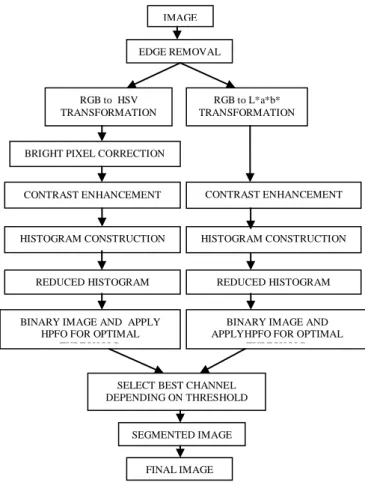
Figure 1. Architecture for proposed scheme 3) ISSUES IN SEGMENTATION
In general, one of the difficulties faced by image segmentation process is to segment the image with specular light reflections. Reflection happens when there is the
IMAGE EDGE REMOVAL RGB to HSV TRANSFORMATION RGB to L*a*b* TRANSFORMATION
BRIGHT PIXEL CORRECTION
CONTRAST ENHANCEMENT
HISTOGRAM CONSTRUCTION
REDUCED HISTOGRAM
BINARY IMAGE AND APPLY HPFO FOR OPTIMAL
THRESHOLD
CONTRAST ENHANCEMENT
HISTOGRAM CONSTRUCTION
REDUCED HISTOGRAM
BINARY IMAGE AND APPLYHPFO FOR OPTIMAL
THRESHOLD
SELECT BEST CHANNEL DEPENDING ON THRESHOLD
VALUE
SEGMENTED IMAGE
two different media so that the wave front returns into the medium from which it originated.
Classification of histogram bins in manual may degrade the prediction accuracy. Due to the manual work the accuracy of the prediction can be reduced.
The distortions in the input image degrade the classification accuracy. Distortion will happens when either the properties of the lens or the position of the camera relative to the subject
4) METHODOLOGY 4.1) Input Image
Used digital images to identify the diseases.[9] Images of leaves or stem which has to be detected is collected from specific dataset or captured through cameras. After capturing, images obtained are in 8-bit size and they are stored in RGB format.
Figure 4.1. Input RGB Image 4.2) Image Preprocessing
Edge detection and edge removal are the two primary steps in image preprocessing. The pixels that are located along the edges of the leaves are removed by performing erosion using a 5-pixel diameter disk as the structuring element. The main purpose of removing these pixels is to avoid some inconsistencies that are occurred during image analysis. This edge removal process can cause be little impact on the detection accuracy of the final results because, some negligible amount of pixels with diseased symptoms are removed. 4.3) Color Space Conversion
In general, Color Space Conversion coverts one basic form of color representation into another form. [3] Red-Green-Blue (RGB) color space is transformed into two different transformations. One is Hue-Saturation-Value (HSV) color space and another one is Lightness and two channels (a and b) (L*a*b) color space transformation. From HSV and L*a*b color spaces, channel H from HSV and channel a from L*a*b are only considered for further process. After the transformation, 8-bit image format (pixel values varies from 0 t0 255) is changed into 16-bit double format with pixel values ranges from 0 to 1.
Figure 4.2(a). HSV and LAB color image
Figure 4.2(b). H and A channel from HSV and LAB color images.
4.4) Feature Extraction
The purpose of feature extraction process is to find the homogenous pixels in an image. The identification of similar pixels from the image can be used for fast identification of diseases part in an image.
Figure 4.4. Pixel corrected H-Image
4.5) Image Enhancement
The simplest and most appealing areas of digital image processing is the image enhancement technique. The idea behind the enhancement techniques is to bring out detail that is unclear details and difficult part to understand, or simply to highlight certain features of interest in an image such as changing brightness & contrast etc.
Figure 4.5. Contrast Enhancement of H and A image
Histogram construction
To remove the 0.1 % brightest pixels in channel H by making they equal to the value of the brightest pixel that did not belong to such a group. This step was needed in order to correct spuriously bright pixels that sometimes appear as a result of the color transformation process. To improve the contrast of the grey scale images of both channels by following equation:
𝑄𝑖,𝑗 =
𝑃𝑖,𝑗− min(𝑃)
max 𝑃 − min(𝑃)
Where P and Q are the original and new values of the pixels respectively and i and j are the indexes of the pixels. The effect of equation was to modify the pixel values so they covered the entire range of possible values (0 to 1).
Thus, in channel H the lesions appear darker compared to the healthy tissue, which is the opposite of channel a. Since the operation applied to both channels was the same, the pixel intensities of channel a were inverted, that is, they were made equal to 1-Qi,j. Additionally, the backgrounds of both images were made equal to 1. These steps are taken for the construction of the intensity histograms from the grayscale representations of both channels. It was determined experimentally that a 100-bin histogram would be the most appropriate
4.6) Image Segmentation
Segmentation is the process of partition an image into its constituent parts or objects. Basically, the one of the most difficult tasks in digital image processing is image segmentation. A segmentation procedure is the long process a way toward successful solution of critical imaging problems that require objects which is to be individually identified. The process of segmentation is to dividing an image into regions with similar properties such as gray level, color, texture, brightness, and contrast. Assigning a label to every pixel in an image such that pixels with the same label is also a process of image segmentation.
Threshold optimization
The segmentation was to find the pixel value that best separates healthy and diseased tissue. In this context, the use of the histogram makes sense because the (higher value bins). In contrast, diseased tissue tends to generate peaks towards the
left end of the histogram (lower value bins). The healthier the leaf as a whole, the more pronounced are the higher peaks. Due to differences in color, shades and illumination, the position of those peaks may vary substantially from sample to sample was created.
A rule was required for the identification of the bin that best represented typical values of green (healthy) pixels in each image, considering that green tissue tends to be represented as a light shade of gray in the grayscale images. The search for such a bin did not follow a perceptual logic, that is, it did not try to identify the shade of green that a human observer would identify as the dominant one for a particular leaf. Instead, it found the bin that would offer the most consistent results given the next steps of the algorithm. Initially, the global maximum was identified, and its location (B) and value (V) were stored. If B ≤40, the index of the highest bin whose value was larger than 0.2 V was taken as reference (R). If B >40, R was the index of the highest value bin whose value was larger than 0.5 V. This was necessary because, when the global maximum is located in lower value bins, it indicates that the leaf is severely diseased, that is, there is not much green tissue left, thus generating lower value bins. On the other hand, if the global maximum is located in higher value bins, this indicates that the leaf is still relatively healthy, with green dominating the histogram. Tests revealed that the bin that best separated healthy and diseased tissue was given by S = 2∙R/3, and the final threshold value was T = S/100, since the histogram is composed of 100 bins. Finally the user chooses which of the two images (that obtained for channel H or a, respectively) provides the most accurate segmentation.
Proposed HPFO
In this HPFO uses Combined Objective Function (COF) to determine optimal number of thresholds and their values for the given image using Firefly optimization and hybrid techniques. All these optimization techniques use the same proposed Combined Objective Function to solve the problem and they lead to a feasible solution. The binary strings of 0s and 1s are generated from the reduced histogram and it is used as an input to the problem. The histogram contains peaks and valleys of the intensity values.
5) RESULTS AND DISCUSSION 5.1) Precision
Precision is defined as the fraction of detected images that are relevant to the query image and it is computed as: 𝑃𝑟𝑒𝑐𝑖𝑠𝑖𝑜𝑛 = 𝑇𝑟𝑢𝑒 𝑝𝑜𝑠𝑖𝑡𝑖𝑣𝑒 (𝑇𝑃)
𝑇𝑟𝑢𝑒 𝑝𝑜𝑠𝑖𝑡𝑖𝑣𝑒 𝑇𝑃 +𝐹𝑎𝑙𝑠𝑒 𝑝𝑜𝑠𝑖𝑡𝑖𝑣𝑒 (𝐹𝑃)
Figure.5.1 Comparison of Precision
Figure.5.1 shows that the comparison of the existing with proposed HFAD model in terms of precision values. The result shows that the HFAD method provides higher precision than existing technique.
5.2) Recall
Recall is defined as the fraction of the images that are relevant to the query which are successfully detected. It is given as:
𝑅𝑒𝑐𝑎𝑙𝑙 = 𝑇𝑟𝑢𝑒 𝑝𝑜𝑠𝑖𝑡𝑖𝑣𝑒 (𝑇𝑃)
𝑇𝑟𝑢𝑒 𝑝𝑜𝑠𝑖𝑡𝑖𝑣𝑒 𝑇𝑃 + 𝐹𝑎𝑙𝑠𝑒 𝑛𝑒𝑔𝑎𝑡𝑖𝑣𝑒 (𝐹𝑁)
Figure.5.2 Comparison of Recall
Figure.5.2 shows that the comparison of the existing with proposed HFAD model in terms of recall values. The result shows that the HFAD method provides higher recall than existing technique.
5.3) F-Measure
F-measure is calculated from the precision and recall value. It is calculated as:
𝑓 − 𝑚𝑒𝑎𝑠𝑢𝑟𝑒 = 2 × 𝑝𝑟𝑒𝑐𝑖𝑠𝑖𝑜𝑛 × 𝑟𝑒𝑐𝑎𝑙𝑙 𝑝𝑟𝑒𝑐𝑖𝑠𝑖𝑜𝑛 + 𝑟𝑒𝑐𝑎𝑙𝑙
Figure.5.3 Comparison of F-Measure
Figure.4.3 shows that the comparison of the existing with proposed HFAD model in terms of f-measure values. The result shows that the HFAD method provides higher f-measure than existing technique.
5.4) Accuracy
The accuracy is the proportion of true results (both true positives and true negatives) among the total number of cases examined. Accuracy can be calculated from formula given as follows
𝐴𝑐𝑐𝑢𝑟𝑎𝑐𝑦 = TP + TN
𝑇𝑃 + 𝑇𝑁 + 𝐹𝑃 + 𝐹𝑁
Figure.5.4 Comparison of Accuracy
Figure.5.4 shows that the comparison of the existing with proposed HFAD model in terms of accuracy values. The result shows that the HFAD method provides higher accuracy than existing technique.
Comparison of Plant Disease Algorithms Using Digital Image Processing
Ref. No.
Title Merits Demerits
1 [7]Comparative
study of
segmentation methods for tree leaves extraction The issues of shape and sub-segmentation was reduced Manual initialization was needed for segmentation
2 [6]Fuzzy set The noisy information was removed Timecomplexity segmentation process was high
3 [8]Discrete wavelets transform High classification accuracy Computational cost was high
and poor directionality due to considering only three orientations 4 [24]An adaptive thresholding algorithm Improved accuracy Detection speed was less 5 [14]Automatic classification of legumes using leaf vein image features
The classification accuracy was improved Not applicable for multiple species of plants 6 [9]Computer vision-based approach High accuracy and execution time was less
Robustness was less
7 [1]Automatic classification of plants based on their leaves High accuracy This method was only applicable for leaf databases 8 [20]Aerial photography and Bayesian segmentation method Accuracy was 100% Computational cost was high
9 [21]Threshold and Thresholding triangle method High accuracy and convenient to measure disease severity Only specific problems were tackled 10 [22]Leaf segmentation, classification, and three-dimensional recovery from a few images with close viewpoints
Simple and acceptable accuracy
Leaf shape may be distorted due to exploit 3-D information 11 [3]Semi-automatic segmentation High flexibility and better accuracy Some sources of error cannot be removed and also limitations were occurred in color channels 6) CONCLUSION
The multilevel threshold problem is solved using proposed scheme called Hybrid Parallel Firefly Optimization algorithm to get optimal threshold values. The proposed scheme is efficient and faster when compared with the existing method. The proposed algorithm was tested under a wide variety of conditions, such as plant species, diseases and images collected under controlled and uncontrolled environmental conditions. In this proposed system combined objective function for fitness value and segmentation criterion to suit all type of images and videos.
In future this work will be extended to find the percentage of infection in accordance with the area affected; the risk level of disease present in the leaf will also be analyzed.
REFERENCE
[1] AAKIF, A., & KHAN, M. F. (2015). AUTOMATIC CLASSIFICATION OF PLANTS BASED ON THEIR LEAVES. BIOSYSTEMS ENGINEERING,139,66-75.
[2] Barbedo, J. G. A. (2014). An automatic method to detect and measure leaf disease symptoms using digital image processing. Plant Disease, 98(12), 1709-1716.
[3] Barbedo, J. G. A. (2016). A novel algorithm for semi-automatic segmentation of plant leaf disease symptoms using digital image processing. Tropical Plant Pathology, 41(4), 210-224.
[4] Bock, C. H., Poole, G. H., Parker, P. E., & Gottwald, T. R. (2010). Plant disease severity estimated visually, by digital photography and image analysis, and by hyperspectral imaging. Critical Reviews in Plant Sciences, 29(2), 59-107.
[5] Cui D, Zhang Q, Li M, Hartman GL, Zhao Y (2010) Image processing methods for quantitatively detecting soybean rust from multispectral images. Biosyst Eng 107:186–193
[6] Gao, R., & Wu, H. (2015). Agricultural image target segmentation based on fuzzy set. Optik-International Journal for Light and Electron Optics, 126(24), 5320-5324.
[7] Grand-Brochier, M., Vacavant, A., Cerutti, G., Bianchi, K., & Tougne, L. (2013, July). Comparative study of segmentation methods for tree leaves extraction. In Proceedings of the International Workshop on Video and Image Ground Truth in Computer Vision Applications (p. 7). ACM.
[8] Guijarro, M., Riomoros, I., Pajares, G., & Zitinski, P. (2015). Discrete wavelets transform for improving greenness image segmentation in agricultural images.
Computers and Electronics in Agriculture, 118, 396-407.
[9] Han, L., Haleem, M. S., & Taylor, M. (2015, July). A novel computer vision-based approach to automatic detection and severity assessment of crop diseases. In Science and Information Conference (SAI), 2015 (pp. 638-644). IEEE.
[10] https://en.wikipedia.org/wiki/Digital_image_processi ng
[11] Khairnar, K., & Dagade, R. (2014). Disease Detection and Diagnosis on Plant using Image Processing â [euro]" A Review. International Journal of Computer Applications, 108(13).
[12] Kim BG, Shim JI, Park DJ (2003) Fast image segmentation based on multi-resolution analysis and wavelets. Pattern Recognit Lett 24:2995–3006 [13] Kumar, S., & Kaur, R. (2015). Plant Disease
Detection using Image Processing- A Review. International Journal of Computer Applications, 124(16).
[14] Larese, M. G., Namías, R., Craviotto, R. M., Arango, M. R., Gallo, C., & Granitto, P. M. (2014). Automatic classification of legumes using leaf vein image features. Pattern Recognition, 47(1), 158-168. [15] Ohta Y, Kanade T, Sakai T (1980) Color information
for region segmentation .Computer Graphics Image Process 13:222–241
[16] Olmstead JW, Lang GA, Grove GG (2001) Assessment of severity of powdery mildew infection of sweet cherry leaves by digital image analysis. HortSci 36:107–111
[17] Patil, S. B., & Bodhe, S. K. (2011). Leaf disease severity measurement using image processing. International Journal of Engineering and Technology, 3(5), 297-301.
[18] Price TV, Osborne CF (1990) Computer imaging and its application to some problems in agriculture and plant science. Crit Rev Plant Sci 9:235–266
[19] Ricker MD (2004) Pixels, bits, and GUIs: the fundamentals of digital imagery and their application by plant pathologists. Plant Dis 88:228–241
[20] Solahudin, M., Pramudya, B., & Manaf, R. (2015). Gemini virus attack analysis in field of chili (Capsicum annuum L.) using aerial photography and Bayesian segmentation method. Procedia Environmental Sciences, 24, 254-257.
[21] SteddomK, Jones D, Rudd J, Rush C (2005) Analysis of field plot images with segmentation analysis: effect of glare and shadows. Phytopathology 95:S99 [22] Teng, C. H., Kuo, Y. T., & Chen, Y. S. (2011). Leaf
segmentation, classification, and three-dimensional recovery from a few images with close viewpoints. Optical Engineering, 50(3), 037003-037003.
[23] Vibhute, A., & Bodhe, S. K. (2012). Applications of image processing in agriculture: a survey. International Journal of Computer Applications, 52(2).
[24] Wang, J., He, J., Han, Y., Ouyang, C., & Li, D. (2013). An adaptive thresholding algorithm of field leaf image. Computers and electronics in agriculture, 96, 23-39.
[25] Zhang GM, Chen SP, Liao JN (2011) Otsu image segmentation algorithm based on morphology and wavelet transformation. In: Proceedings of International conference on computer research and development (ICCRD), vol 1. IEEE, Shanghai, pp 279–283
[26] Zhang M, Meng Q (2011) Automatic citrus canker detection from leaf images captured in field. Pattern Recogn Lett 32:2036–2046 s