Advisory Board: Michael Beck, President
Beck Evaluation & Testing Associates, Inc.
Keith Cruse, Former Managing Director Texas Assessment Program
A STUDY OF THE INSTRUCTIONAL EFFECTIVENESS OF
Larson’s Big Ideas Math ©2012
Report Number 432
Jennifer M. Conner, Assistant Professor Indiana University
1 Educational Research Institute of America
Table of Contents
Introduction ... 2
Research Questions... 3
Design of the Study ... 3
Instructional Approach under Study ... 4
Description of the Research Sample ... 5
Description of the Assessments ... 5
Data Analyses ... 6
Results ...7
Total Group Comparison ...7
High Pretest and Low Pretest Student Comparison ... 9
Conclusions ...10
2 Educational Research Institute of America
A STUDY OF THE INSTRUCTIONAL
EFFECTIVENESS OF LARSON’S
Big Ideas Math
©2012
This report describes an instructional efficacy study that was conducted to determine the impact of Larson’s Big Ideas Math ©2012 on students’ knowledge and skills in math.
Introduction
“All young Americans must learn to think mathematically, and they must think
mathematically to learn” (National Research Council, 2001, p. 1). Today students come from increasingly diverse backgrounds, in regard to culture and language as well as in their background knowledge, abilities, motivations, interests and modes of learning (Tomlinson, 2005). To effectively teach mathematics skills and concepts teachers of mathematics must be knowledgeable of and sensitive to the needs of all learners in the mathematics classroom.
The Common Core State Standards for Mathematics resulted from a state-led effort
coordinated by the National Governors Association Center for Best Practices (NGA Center) and the Council of Chief State School Officers (CCSSO). Teachers, school administrators, and experts collaborated to articulate research-based, internationally benchmarked standards that describe a sequence of instruction intended to prepare students for college and the workforce. Having fewer and clearer expectations allows teachers to concentrate on the heart of mathematics learning and affords students the opportunity to learn deeply key concepts and skills.
Research has long suggested the need for greater focus in U.S. mathematics instruction; “For over a decade, research studies of mathematics education in high-performing countries have pointed to the conclusion that the mathematics curriculum in the United States must become substantially more focused…” (Common Core State Standards Initiative, 2010, p. 3) Reviews of the mathematics curriculum in top-performing countries find that they “present fewer topics at each grade level but in greater depth” (National Mathematics Advisory Council, 2008, p. 20). Experts in mathematics instruction concur: a narrow focus is essential to greater learning and deeper
understanding. Students learning from a more focused curriculum benefit over those who experience a shallower, wider coverage of mathematical concepts and skills. According to the National Council of Teachers of Mathematics in its Curriculum Focal
Points for Prekindergarten through Grade 8 Mathematics, “When instruction focuses
on a small number of key areas of emphasis, students gain extended experience with core concepts and skills. Such experience can facilitate deep understanding, mathematical fluency, and an ability to generalize.” (National Council of Teachers of Mathematics, 2006b, p. 5).
Larson Big Ideas Math was specifically designed to allow teachers to cover these more-in-depth standards. This research-based program is the only comprehensive program grounded in both with the Common Core State Standards for Mathematics and the
Standards for Mathematical Practice. In order to evaluate this new program,
researchers from Educational Research Institute of America (ERIA) were commissioned to perform a year-long comparative study of the program at grade 7.
3 Educational Research Institute of America
Research Questions
The following research questions guided the design of the study and the data analyses: 1. When compared to a control group program is Larson’s Big Ideas Math©2012
program effective in improving students’ knowledge and skills in mathematics? 2. Is Larson’s Big Ideas Math©2012 effective in improving the math knowledge
and skills of those students who score at higher and lower levels on the pretest?
Design of the Study
The study of Larson’s Big Ideas Math ©2012 mathematics program was conducted at grade 7. Two teachers, from the same school, were recruited to participate in the study. One teacher was assigned to use the Big Ideas Math as the primary program for math instruction over an entire school year in three mathematics classes-these classes comprised the Treatment Group. For this study, the published full year edition of
Larson’s Big Ideas Math program ©2012 was used. The Big Ideas Math teacher had not used the program prior to her involvement in the study.
The Control Group in the study consisted of another teacher’s three sections of grade 7 mathematics. The control teacher continued using the mathematics program that had been used at the school for the last several years. The control classes had no exposure to the Larson’s Big Ideas Math ©2012 program during the duration of the study.
Each teacher in the treatment and control groups administered two tests to measure student achievement. A pretest was conducted in early/mid-September 2011 and post-testing was conducted in early June 2012. The control group pretests were administered about 2 weeks later than the Big Ideas Math group due to the lateness of materials availability. Teachers administered the assessments with directions and answer documents sent to them. All tests were returned to ERIA for scoring and analyses.
4 Educational Research Institute of America
Instructional Approach under Study
Larson’s Big Ideas Math program is a well-articulated, focused, middle-grades mathematics program designed to teach mathematics and develop students’
understanding of the associated concepts and practices. The five-volume program offers two pathways for students to move through middle school mathematics, and emphasizes a balanced approach to customized instruction, with support from interactive
technology.
Following is a description of the program provided by the publisher:
Big Ideas Math is the only complete middle school math program developed with the Common Core Standards for Mathematical Content and Standards for Mathematical Practice as its foundation. It is the only program to offer both the Regular Pathway and the Compacted Pathway through middle school
mathematics. The Regular Pathway prepares students for Algebra 1 or
Integrated 1 in 9th grade. The Compacted Pathway is for accelerated learners who will progress on to Geometry or Integrated 2 in 9th grade.
Big Ideas Math has been systematically developed using learning and
instructional theory to ensure the quality of instruction. Students gain a deeper understanding of math concepts by narrowing their focus to fewer topics at each grade level. Students master content through inductive reasoning
opportunities, engaging activities that provide deeper understanding, concise stepped-out examples, rich thought-provoking exercises, and a continual building on what has been previously taught.
Big Ideas Math delivers a unique and revolutionary curriculum providing a balanced instructional approach of discovery and direct instruction. This approach opens doors to abstract thought, reasoning, and inquiry as students persevere to answer the Essential Questions that drive instruction. Clearly stepped-out examples complete the lesson and provide students with the precise language and structure necessary to build mathematical understanding and proficiency. The unique teaching edition provides teachers with complete instructional support from a master teacher.
5 Educational Research Institute of America
Description of the Research Sample
There were two grade 7 teachers included in the study. One teacher used the Big Ideas Math program and the other served as a control set of classes and the program used was one which had been used for several years in the school.
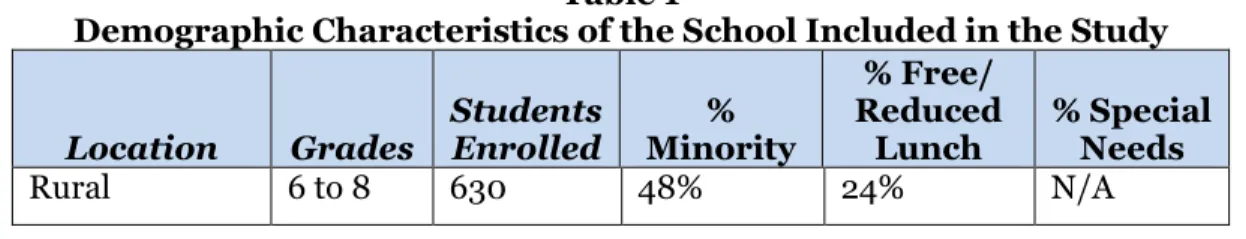
Table 1 provides a demographic summary of the school which shows that there were 48% of the students classified as minority and 24% of the students were enrolled in free or reduced price lunch programs. The table does not provide specific data for the classes included in the study. They do, however, provide a general description of the school and, thereby, an estimate of the make-up of the classes that comprised the sample.
Table 1
Demographic Characteristics of the School Included in the Study
Location Grades Students Enrolled % Minority % Free/ Reduced Lunch % Special Needs Rural 6 to 8 630 48% 24% N/A
Description of the Assessments
The outcome measures used for the study were developed by researchers at ERIA. The assessments were developed to assess the students’ skills and knowledge in mathematics. The tests included 24 multiple-choice items and 6 open-ended items that required
students to write their responses.
Table 2 provides the test statistics for 24 multiple choice test items on the pretests and posttests. The reliability of the posttest shows that the test was reliable for making instructional decisions regarding student growth. The lower reliability of the pretests for both the Big Ideas Math group and the control group indicates that students were making some guesses on the pretests. The increase in the reliability of the posttest when
compared with the pretest shows the effect of instruction and thus the decrease in guessing answers.
Table 2
Reliability Estimates, Mean Scores and Reliability for the Mathematics Assessments
Control and Big Ideas Math Groups Test
Standard
Deviation Reliability* SEM**
Control Group Pretest 3.53 .60 2.3
Control Group Post-Test 4.18 .75 2.1
Big Ideas Math Group Pretest 3.19 .62 2.0
Big Ideas Math Group
Post-Test 4.24 .77 2.0
*Reliability computed using the Kuder-Richardson 20 formula. ** SEM stands for Standard Error of Measurement.
6 Educational Research Institute of America
Data Analyses
The results for each of the two groups were analyzed independently. All raw scores were first converted to standard scores using a linear transformation to a standard score scale with a mean of 300 and a standard deviation of 50. This conversion provided a more normal distribution of test scores.
Four primary analyses were conducted:
1. A Repeated Measures Analysis of Variance (ANOVA) was used to determine if the two groups increased their scores from pretest to post-test, whether there was a significant difference between each group at pretesting and post-testing, and whether either group showed a greater increase from pretesting to post-testing. 2. Independent sample t-tests were computed to determine if there were any
significant differences between the Big Ideas Math group and the control on the pretests or on the post-tests.
3. A Paired Comparison t-test was performed for each group to determine the specific increase, if any, from pretesting to post-testing for the Big Ideas Math
Group and the Control Group.
4. Students in both the Big Ideas Math Group and the Control Group were split into two groups based on pretest scores. Paired comparison t-tests were conducted to determine if the programs were equally effective with lower performers and higher performers on the pretest.
In addition to the t-test, effect-size analyses were computed using Cohen’s d statistic. This statistic provides an indication of the strength of the effect of the treatment regardless of the statistical significance. Cohen’s d statistic is interpreted as follows:
.2 = small effect .5 = medium effect .8 = large effect
In order to provide a more visual interpretation of test score changes from pretesting to posttesting, figure were produced to compare changes for the total group at each grade as well as changes for the lower and higher scoring pretest groups.
7 Educational Research Institute of America
Results
Total Group Comparison
Researchers at ERIA conducted a Repeated Measures Analysis of Variance to determine three different effects as follows:
• Time indicates if the two groups increased their scores from pretest to post-tests.
• Time x Group indicates whether one group showed a higher increase than the
other group.
• Group indicates whether there is a significant difference between the two groups
at pretesting and post-testing.
Table 3 shows that there was a significant effect for Time which indicates that both groups increased their scores from pretesting to post-testing. The Time x Group factor was also significant indicating that either the Big Ideas Math group or the control group made greater gains than the other. Group was not significant and indicates that the groups were not significantly different at both pretesting and post-testing.
Table 3
Repeated Measures Analysis of Variance Comparing Pretest and Post-Standard Scores for Control and Big Ideas Math Group
Source df Mean Square F Test Significance
Time 1 105782.871 131.780 ≤.0001
Time x Group 1 4904.016 6.109 ≤.02
Group 1 1831.848 .516 ≤.474
Figure 1 shows the results from Table 3 in graphic format. It is easy to see the time factor as both groups increased their scores significantly from pretesting to
post-testing. The non-significance of the Group factor is also obvious in that there is a large difference between the two groups at pretesting but there is clearly not a large difference at post-testing. However, Table 3 also shows that the Time x Group factor is significant and indicates that the amount of increase from pretesting to post-testing is greater for the Big Ideas Math group than it is for the control group.
8 Educational Research Institute of America
Figure 1
Standard Score Increases for the Big Ideas Math Group and the Control Group from Pretesting to Post-Testing
Independent Sample t-tests were computed to determine the significance of the
differences between the Big Ideas Math group and the control group at both pretesting and at post-testing. Table 4 includes the comparison results and shows there was a statistically significant difference (≤.05) at pretesting but there was no significant difference at post-testing. This indicates that the Big Ideas Math group started
significantly below the control group but by the end of the year the Big Ideas Math group was slightly ahead of the control group; although, the difference was not significant. The effect size differences between the groups were small.
Table 4
Independent Sample t-Tests Big Ideas Math and Control Groups Mean Standard
Deviation
t- Test Significance Effect Size
Pretest Comparison
Big Ideas Math
Group 275.1 39.7 1.946 ≤.05 .31
Control Group 288.2 42.3 Post-Test Comparison
Big Ideas Math
Group 321.2 51.3 .372 ≤0.71 .05
Control Group 318.0 52.1
To analyze and determine if there were any differences in gains made by each group from pretesting to post-testin , the gains for each of the groups were considered individually and examined by computing Paired Comparison t-tests. The figures in Table 5 show that both groups increased statistically significantly (≤.0001). However, the effect size for the
Big Ideas Math group was large while the effect size for the control group was medium. 275 321 288 318 270 280 290 300 310 320 330 Pretest Post-Test
9 Educational Research Institute of America
Table 5
Paired Comparison t-Tests Big Ideas Math and Control Groups Big Ideas Math
(N=74)
Mean Standard Deviation
t Test Significance Effect Size
Pretest 275.1 39.7 10.229 ≤.0001 1.00 Post-Test 321.2 51.3 Control Group (N=73) Pretest 288.2 42.3 6.153 ≤.0001 .63 Post-Test 318.0 52.1
High Pretest and Low Pretest Student Comparison
An analysis was next conducted to determine if both the Big Ideas Math group and the control group increased the scores of the lower and higher pretest scoring groups. Table 6 shows that both the low pretest group and the high pretest group from the Big Ideas Math group made statistically significant gains (≤.0001). The effect size was large for both groups.
Table 6
Big Ideas Math Group Paired Sample t-Tests for Low and High Pretest Scoring Groups Low Pretest
Group (N=37) Mean
Standard
Deviation t Test Significance
Effect Size Pretest 245.5 16.2 6.922 ≤.0001 1.50 Post-Test 295.5 44.3 High Pretest (N=37) Pretest 304.6 33.9 7.777 ≤.0001 1.06 Post-Test 346.9 45.0
Table 7 shows that both the low pretest group and the high pretest group from the control group made statistically significant gains (≤.0001). The effect size for the low group was large and the effect size for the high group was medium.
Table 7
Control Group Paired Sample t-Tests for Low and High Pretest Scoring Groups Low Pretest
Group (N=37) Mean
Standard
Deviation t Test Significance
Effect Size Pretest 255.2 16.5 4.283 ≤.0001 .98 Post-Test 286.9 42.6 High Pretest (N=36) Pretest 322.1 32.6 4.422 ≤.0001 .76 Post-Test 349.9 40.6
10 Educational Research Institute of America
Conclusions
This study sought to determine the effect of Larson’s Big Ideas Math ©2012 program on students’ knowledge and skills in math. For this year-long study, Larson’s Big Ideas
Math ©2012 was used with students at grade 7 and were compared to grade 7 students
in the same school.
Research Question 1: When compared to a control group program is Larson’s Big Ideas Math©2012 program effective in improving students’ knowledge and skills in mathematics?
Both the Big Ideas math classes and the control classes made statistically significant gains from pretesting to post-testing. The effect size was large for the Big Ideas group and medium for the control group.
The control math group scored significantly higher than the Big Ideas math group at pretesting. At post-testing Big Ideas Math group scored a few points higher than the control math group; however was no significant difference between the two groups. Research Question 2: Is Larson’s Big Ideas Math©2012 effective in improving the math knowledge and skills of those students who score at higher and lower levels on the pretest?
Both the high and low pretest scoring Big Ideas Math students made significant gains from pretesting to post-testing and the effect sizes were large for both groups.
Both the high and low pretest scoring control classes made significant gains from pretesting to post-testing. The effect size was large for the low pretest scoring students and medium for the high pretest scoring students.
The conclusion for research question 1 is that the Larson's Big Ideas Math is effective in improving the math skills and knowledge of middle grade students. Moreover gains were greater for Big Ideas math students than they were for control group students.
The conclusion for research question 2 is that the Larson's Big Ideas Math is effective in improving the math skills and knowledge of both higher pretest scoring students as well as lower pretest scoring students.
11 Educational Research Institute of America
Bibliography
Achieve. (2010). Comparing the Common Core State Standards in Mathematics and NCTM’s Curriculum Focal Points. Washington, DC: Author. Retrieved January
29, 2012 from http://www.achieve.org/CCSSandFocalPoints.
National Council of Teachers of Mathematics. (2000). Principles and standards for school mathematics. Reston, VA: Author. Retrieved January 29, 2012 from
www.nctm.org.
National Council of Teachers of Mathematics (2006a). Curriculum Focal Points for Prekindergarten through Grade 8 Mathematics: A Quest for Coherence. Reston, VA: Author.
National Council of Teachers of Mathematics (2006b). Curriculum Focal Points Front Matter. Reston, VA: author. Retrieved January 29, 2012 from
www.nctmmedia.org/cfp/front_matter.pdf.
National Mathematics Advisory Panel. (2008). Foundations for success: The final report of the National Mathematics Advisory Panel. Washington, DC: U.S. Department of Education. Retrieved January 30, 3012 from
http://www2.ed.gov/about/bdscomm/list/mathpanel/index.html.
National Research Council. (2001). Adding it up: Helping children learn mathematics. Mathematics Learning Study Committee. Washington, DC: The National Academies Press. Retrieved February 21, 2012 from