ETSI EG 202 396-1
V1.2.2
(2008-09)
ETSI GuideSpeech Processing, Transmission and Quality Aspects (STQ);
Speech quality performance
in the presence of background noise;
Part 1: Background noise simulation technique
and background noise database
Reference REG/STQ-00131
Keywords
performance, quality, speech
ETSI
650 Route des Lucioles
F-06921 Sophia Antipolis Cedex - FRANCE Tel.: +33 4 92 94 42 00 Fax: +33 4 93 65 47 16
Siret N° 348 623 562 00017 - NAF 742 C Association à but non lucratif enregistrée à la
Sous-Préfecture de Grasse (06) N° 7803/88
Important notice
Individual copies of the present document can be downloaded from: http://www.etsi.org
The present document may be made available in more than one electronic version or in print. In any case of existing or perceived difference in contents between such versions, the reference version is the Portable Document Format (PDF). In case of dispute, the reference shall be the printing on ETSI printers of the PDF version kept on a specific network drive
within ETSI Secretariat.
Users of the present document should be aware that the document may be subject to revision or change of status. Information on the current status of this and other ETSI documents is available at
http://portal.etsi.org/tb/status/status.asp
If you find errors in the present document, please send your comment to one of the following services: http://portal.etsi.org/chaircor/ETSI_support.asp
Copyright Notification
No part may be reproduced except as authorized by written permission. The copyright and the foregoing restriction extend to reproduction in all media.
© European Telecommunications Standards Institute 2008. All rights reserved.
DECTTM, PLUGTESTSTM, UMTSTM, TIPHONTM, the TIPHON logo and the ETSI logo are Trade Marks of ETSI registered for the benefit of its Members.
Contents
Intellectual Property Rights ...5
Foreword...5
Introduction ...5
1 Scope ...6
2 References ...6
2.1 Normative references ...7 2.2 Informative references...73 Definitions
and
abbreviations...8
3.1 Definitions ...8
3.2 Abbreviations ...8
4
Overview of existing methods for realistic sound reproduction...8
4.1 Introduction ...8
4.2 Surround Sound Techniques...9
4.3 IOSONO...10
4.4 Eidophonie ...10
4.5 Four-loudspeaker arrangement for playback of binaurally recorded signals...11
4.6 NTT Background-Noise Database ...12
4.7 General conclusions ...12
5 Recording
arrangement ...13
5.1 Binaural equalization...13
5.2 The equalization procedure ...13
6
Loudspeaker Setup for Background Noise Simulation ...15
6.1 Test Room Requirements ...15
6.2 Loudspeaker Positioning ...15
6.3 Equalization and Calibration ...16
6.4 Accuracy of the reproduction arrangement ...21
6.4.1 Comparison between original sound field and simulated sound field...21
6.4.2 Displacement of the test arrangement in the simulated sound field...22
6.4.3 Transmission of background noise: Comparison of terminal performance in the original sound field and the simulated sound field ...24
7
Background Noise Simulation in cars ...28
7.1 General setup...28
7.2 Recording arrangement ...29
7.2.1 Recording setup with the terminal's microphone ...29
7.2.2 Recording setup with a pair of cardioid microphones...30
7.3 Equalization and Calibration with the terminal's microphone...30
7.4 Equalization and Calibration with a pair of cardioid microphones ...35
7.5 Accuracy of the reproduction arrangement ...40
7.5.1 Comparison between original sound field and simulated sound field...40
7.5.2 Transmission of background noise: Comparison of terminal performance in the original sound field and the simulated sound field ...41
8
Background Noise Database ...43
8.1 Binaural signals ...44
8.2 Stereophonic signals...46
Annex A:
Comparison of Tests in Sending Direction and D-Values Conducted in Different
Rooms...47
A.1 Test
Setup...47
A.2 Results of the Tests ...48
A.2.2 D-Value with Pink Noise ...48
A.2.3 D-Value with Cafeteria Noise ...49
A.3 Conclusions ...49
Annex B:
Graphs...50
Intellectual Property Rights
IPRs essential or potentially essential to the present document may have been declared to ETSI. The information pertaining to these essential IPRs, if any, is publicly available for ETSI members and non-members, and can be found in ETSI SR 000 314: "Intellectual Property Rights (IPRs); Essential, or potentially Essential, IPRs notified to ETSI in
respect of ETSI standards", which is available from the ETSI Secretariat. Latest updates are available on the ETSI Web
server (http://webapp.etsi.org/IPR/home.asp).
Pursuant to the ETSI IPR Policy, no investigation, including IPR searches, has been carried out by ETSI. No guarantee can be given as to the existence of other IPRs not referenced in ETSI SR 000 314 (or the updates on the ETSI Web server) which are, or may be, or may become, essential to the present document.
Foreword
This ETSI Guide (EG) has been produced by ETSI Technical Committee Speech Processing, Transmission and Quality Aspects (STQ).
The present document is part 1 of a multi-part deliverable covering Speech Processing, Transmission and Quality Aspects (STQ); Speech quality performance in the presence of background noise, as identified below:
Part 1: "Background noise simulation technique and background noise database";
Part 2: "Background noise transmission - Network simulation - Subjective test database and results"; Part 3: "Background noise transmission - Objective test methods".
Introduction
Background noise is present in most of the conversations today. Background noise may impact the speech
communication performance to terminal and network equipment significantly. Therefore testing and optimization of such equipment is necessary using realistic background noises. Furthermore reproducible conditions for the tests are required which can be guaranteed only under lab type condition.
The present document addresses this issue by describing a methodology for recording and playback of background noises under well defined and calibratable conditions in a lab-type environment. Furthermore a database with real background noises is included.
1 Scope
The quality of background noise transmission is an important factor, which significantly contributes to the perceived overall quality of speech. Existing and even more the new generation of terminals, networks and system configurations including broadband services can be greatly improved with a proper design of terminals and systems in the presence of background noise. The present document:
• describes a noise simulation environment using realistic background noise scenarios for laboratory use;
• contains a database including the relevant background noise samples for subjective and objective evaluation. The present document provides information about the recording techniques needed for background noise recordings and discusses the advantages and drawbacks of existing methods. The present document describes the requirements for laboratory conditions. The loudspeaker setup and the loudspeaker calibration and equalization procedure are described. The simulation environment specified can be used for the evaluation and optimization of terminals and of complex configurations including terminals, networks and other configurations. The main application areas should be: office, home and car environment.
The setup and database as described in the present document are applicable for:
• Objective performance evaluation of terminals in different (simulated) background noise environments.
• Speech processing evaluation by using the pre-processed speech signal in the presence of background noise, recorded by a terminal.
• Subjective evaluation of terminals by performing conversational tests, specific double talk tests or talking and listening tests in the presence of background noise.
• Subjective evaluation in third party listening tests by recording the speech samples of terminals in the presence of background noise.
2 References
References are either specific (identified by date of publication and/or edition number or version number) or non-specific.
• For a specific reference, subsequent revisions do not apply.
• Non-specific referencemay be made only to a complete document or a part thereof and only in the following cases:
- if it is accepted that it will be possible to use all future changes of the referenced document for the purposes of the referring document;
- for informative references.
Referenced documents which are not found to be publicly available in the expected location might be found at http://docbox.etsi.org/Reference.
For online referenced documents, information sufficient to identify and locate the source shall be provided. Preferably, the primary source of the referenced document should be cited, in order to ensure traceability. Furthermore, the reference should, as far as possible, remain valid for the expected life of the document. The reference shall include the method of access to the referenced document and the full network address, with the same punctuation and use of upper case and lower case letters.
NOTE: While any hyperlinks included in this clause were valid at the time of publication ETSI cannot guarantee their long term validity.
2.1 Normative
references
The following referenced documents are indispensable for the application of the present document. For dated references, only the edition cited applies. For non-specific references, the latest edition of the referenced document (including any amendments) applies.
Not applicable.
2.2 Informative
references
The following referenced documents are not essential to the use of the present document but they assist the user with regard to a particular subject area. For non-specific references, the latest version of the referenced document (including any amendments) applies.
[i.1] Surround Sound Past, Present, and Future: "A history of multichannel audio from mag stripe to Dolby Digital", Joseph Hull - Dolby Laboratories Inc.
NOTE: See at http://www.dolby.com/assets/pdf/tech_library/2_Surround_Past.Present.pdf.
[i.2] AES preprint 3332 (1992): "Improved Possibilities of Binaural Recording and Playback Techniques", K. Genuit, H.W. Gierlich; U. Künzli.
NOTE: See at http://www.aes.org/e-lib/browse.cfm?elib=6801.
[i.3] AES preprint 3732 (1993): "A System for the Reproduction Technique for Playback of Binaural Recordings", N. Xiang, K. Genuit, H.W. Gierlich.
NOTE: See at http://www.aes.org/e-lib/browse.cfm?elib=6501.
[i.4] NTTAT Database: "Ambient Noise Database CD-ROM". NOTE: See at http://www.ntt-at.com/products_e/noise-DB/index.html.
[i.5] ISO 11904-1: "Acoustics - Determination of sound immission from sound sources placed close to the ear - Part 1: Technique using a microphone in a real ear (MIRE technique)".
[i.6] Spatial Hearing: "The psychophysics of human sound localization", J. Blauert. [i.7] ITU-T Recommendation P.57: "Artificial ears".
[i.8] ITU-T Recommendation P.58: "Head and torso simulator for telephonometry".
[i.9] ITU-T Recommendation P.340: "Transmission characteristics and speech quality parameters of hands-free terminals".
[i.10] ITU-T recommendation P.64: "Determination of sensitivity/frequency characteristics of local telephone systems".
[i.11] ITU-T Recommendation G.722: "7 kHz audio-coding within 64 kbit/s".
[i.12] Genuit, K.: "A Description of the Human Outer Ear Transfer Function by Elements of
Communication Theory (No. B6-8)". Proceedings of the 12th International Congress on Acoustics. Toronto published on behalf of the Technical Program Committee by the Executive Committee of the 12th International Congress on Acoustics.
[i.13] IEC 60050-722: "International Electrotechnical Vocabulary - Chapter 722: Telephony". [i.14] "Wellenfeldsynthese - Eine neue Dimension der 3D-Audiowiedergabe"; Fernseh- und
Kino-Technik, Nr. 11/2002, pp. 735-738. [i.15] http://www.iosono-sound.de.
[i.16] "Ein neues Verfahren der raumbezogenen Stereophonie mit verbesserter Übertragung der Rauminformation"; P. Scherer, Rundfunktechnische Mitteilungen, 1977, pp. 196-204.
[i.17] ETSI EG 202 396-1 (V.1.1.2): "Speech quality performance in the presence of background noise; Part 1: Background noise simulation technique and background noise database".
[i.18] ETSI TS 151 010-1: "Digital cellular telecommunications system (Phase 2+); Mobile Station (MS) conformance specification; Part 1: Conformance specification (3GPP TS 51.010-1)".
3 Definitions
and
abbreviations
3.1 Definitions
For the purposes of the present document, the following terms and definitions apply:
crosstalk: appearance of undesired energy in a channel, owing to the presence of a signal in another channel, caused
by, for example induction, conduction or non linearity NOTE: See IEC 60050-722 [i.13].
3.2 Abbreviations
For the purposes of the present document, the following abbreviations apply:
CD Compact Disc
FFT Fast Fourier Transform FIR Finite Impulse Response HATS Head And Torso Simulator IIR Infinite Impulse Response MIRE Microphone In Real Ear
NTT Nippon Telegraph and Telephone Corporation
SLR Send Loudness Rating
VHF Very High Frequency
4
Overview of existing methods for realistic sound
reproduction
4.1 Introduction
In general the existing methods for close to original sound recording and reproduction aimed for different applications:
• Techniques intending to reproduce the actual sound field.
• Techniques providing hearing adequate (ear related) signals in the human ear canal.
• Techniques generating artificial acoustical environments.
Within this clause the different methods are briefly described and their applicability for close to original sound-filed reproduction is discussed. A variety of methods have been studied, in the following a summary of the most important ones relevant to the present document is given. The different methods were analyzed on the basis of the following requirements:
• The background noise recording technique should be: - easy to use;
- easy to calibrate;
- available at reasonable costs;
- mostly compatible to existing standards and procedures used in telecommunications testing; - applicable to different environments (at least office, home and car).
• The background noise simulation arrangement should: - be easy to setup;
- not require any specific acoustical treatment for the simulation requirement;
- provide a mostly realistic background noise simulation for all typical background noises faced with in telecommunication applications;
- be easy to calibrate;
- be mostly insensitive against the positioning of (test)-objects in the simulated sound field; - be applicable to all typical terminals used in telecommunication;
- be available at reasonable costs.
4.2 Surround
Sound
Techniques
The basics of surround techniques are found in cinema applications. The virtual image provided by stereophonic presentation of sounds seemed not to be sufficient for the large screen display in cinema. In the 1950s 4-channel and 6-channel soundtracks recorded on magnetic stripes associated to the films were developed, 4-channel and 6-channel loudspeaker systems were installed in cinemas to reproduce the multichannel sounds. The newer techniques were mostly developed and marketed by Dolby® [i.1]: Dolby Surround, Dolby Surround Pro Logic, Dolby Digital and Dolby Digital Surround are examples for the techniques introduced more recently. The most common configuration is the "5.1-configuration" used in cinema but in home applications as well. The reproduction system consists of left and right channel, a centre speaker, two surround channels (left and right, arranged in the back of the listener) and a low frequency channel for low frequency effects.
The aim of all surround system is to create an artificial acoustical image in the recording studio rather than recording a real acoustical scenario and providing true to original playback possibilities.
On the recording side special surround encoders are used allowing the 5-channel signal to be encoded from a special mixing console to the 5.1 digital data stream. The playback system consists of a special decoder allowing to separate the 5 channels again and distribute them on the 5.1 loudspeaker playback system. The systems are mono and stereo
compatible and can handle the older 4 channel surround techniques by a specific decoder.
Applications:
Typical applications for surround systems are cinemas and home theatres. The source material is produced by
professional recording studios using multi-channel mixing consoles and specific 5.1 decoding techniques. In mostly all cases virtual environments are created which support the visual image by an appropriate acoustical image.
Conclusion:
Surround techniques are designed for creating acoustical images rather than for close to original recording and
reproduction. Although the spatial impression provided by surround techniques is sometimes remarkable the acoustical image created is always artificial. Due to the lack of easy to use recording techniques allowing a spatial recording of a sound field surround sound techniques are not suitable for creation of a background noise database with realistic background noises and calibrated background noise simulation in a lab.
4.3 IOSONO
The IOSONO® sound system (see [i.14] and [i.15]) is based on the Wave-Field Synthesis. It employs Huygens principle of wave theory. Applied to acoustics this principle means that it is possible to reproduce any form of wave front with an array of loudspeakers, so that virtual sound sources can be placed anywhere within a listening area. For practical use it is necessary to position loudspeakers all-round the playback room. In order to generate realistic sound fields the input signal for each loudspeaker has to be calculated separately. For this purpose each single sound source (e.g. voices) has to be recorded individually. If the recordings are done in a room, the characteristics (like reverberation) of the recording room also have to be recorded separately. All resulting sound tracks are then mixed and manipulated during the post-editing process and the reproduction.
The natural and realistic spatial sound reproduction is then achieved in a wide area of the play back room. Common 5.1 stereo systems achieve a "realistic" sound reproduction only in a small area of the reproduction room.
Applications:
Typical applications are sound systems for home use, cinemas and other entertainment events. The IOSONO sound system is also able to play back recordings made in common stereo or 5.1 stereo techniques.
Conclusion:
The drawbacks of this method are the components needed: a sophisticated recording system, a powerful computing unit for real-time mixing the large number of recorded sound tracks and the number of loudspeakers that have to be installed in the listening room. In a common size cinema for example about 200 loudspeakers are needed.
The advantage is that with the IOSONO sound system a very realistic sound reproduction is possible, but it requires an enormous effort, which is too high for daily use in laboratories.
4.4 Eidophonie
This method (see [i.16]) was developed for realistic sound reproduction using the VHF transmission technique. The main principle is to separate the base signal from the part of the signal, which contains the information about the direction of sound incidence.
For recording a 1st order gradient microphone with a cardioid directivity is used. During the recordings its directivity rotates with 38 kHz in the recording plane. This "turning microphone" provides an amplitude-modulated signal at its electrical output. The resulting side bands are out of the transmitted frequency range. But these side bands contain the information of the direction of sound incidence. Using the VHF- transmission techniques this phase information can be transmitted within the 2nd audio-frequency channel.
The sound reproduction is made by a spatial demodulation: a switch is positioned before each loudspeaker and each switches synchronously with the turning directivity. So a low pass filtered short-term section of the signal containing the information of the direction of sound incidence is played back on each loudspeaker. The loudspeakers are positioned all around the playback room.
Applications:
Eidophonie was developed to provide a realistic sound environment using a signal received from a VHF broadcast station. With this technique the common stereo sound reproduction should be improved. Nevertheless Eidophonie is also compatible to common mono and stereo recordings.
Conclusion:
Benefits of this system are that three loudspeakers are sufficient to produce a realistic sound field. Using more loudspeakers (e.g. 16) the spatial sound reproduction gets more and more independent from the listening position. Moreover the independency of the transmitted sound from the acoustics of the reproduction room increases with the number of loudspeakers used. But there are significant limitations of the method: The microphone directivity is frequency dependent and not ideal. Therefore the interference between the different channels is created. A second problem is the loudspeaker directivity, which does not fit the microphone directivity. This problem could be reduced if the number of channels would be increased. This however is not possible due to the limited directivity of the
microphone arrangement used.
Localization of sound sources is hardly possible due to the interference effects of the microphone signals and the loudspeakers. At close to original reproduction depends on the number and distribution of sound sources present. For most of the sound source combinations this goal cannot be achieved.
In general the coding technique needed to record the sound field by a "turning microphone", is complicated and not available commercially. A further drawback of this method is the complicated decoding technique needed on the reproduction side, which is also not commercially available.
4.5 Four-loudspeaker
arrangement
for playback of binaurally
recorded signals
This reproduction procedure was originally investigated to reproduce binaurally signals recorded using artificial head technology. It improves the impressions of direction and distance. Four loudspeakers are typically positioned in a square formation around a central point (listening point) equidistantly e.g. 2 m. The binaural recordings are played back as follows: the two left-hand loudspeakers receive the same free-field equalized artificial head signal of the left-hand channel only. The right-hand side is arranged similarly. For equalization the transfer function from the two left-hand loudspeakers is measured at the artificial heads left ear channel. With this result IIR and FIR filters are designed, with which the input signal of the left-hand loudspeakers during the play back is filtered in such a way that the transfer function then measured at the artificial heads left-hand channel is spectrally flat. The equalization for the right-hand loudspeakers is done similarly.
The equalization procedure does not take into account the correction of crosstalk. This means, the left-hand channel of the artificial head is only equalized for the left-hand loudspeakers, but during the reproduction this left-hand channel will also receive a signal from the right-hand loudspeakers. But despite this simplification the equalization procedure provides a realistic binaural listening impression.
Investigations [i.2], [i.3] carried out in different rooms have shown that directional hearing and distance localization by sound reproduction with this four-loudspeaker arrangement are comparable to those with sound reproduction by headphones.
For equalization there are several strategies. The equalization can either be done for each loudspeaker individually or by pairs left - right or by pairs front - rear.
Applications:
A practical application is the sound reproduction for binaural recordings in a typical office-type room, e.g. for listening tests but objective tests as well. The investigations shown in [i.2], [i.3] indicate that the subjective impression provided by the arrangement corresponds to the headphone reproduction of binaural recordings with respect to the perception of the sound colour, the distance perception and (with some limitations) with respect to the sound source localization. The data provided indicate that the setup could be used for the objective measurements of e.g. telecommunication terminals. This four-loudspeaker arrangement is also used in advanced driving simulators - which typically provide a visual simulation of the driving situation in addition to the acoustical playback system.
Conclusion:
The advantage of this arrangement on the recording side is the compatibility to standard mono and stereo recordings. Due to this it is easily possible to playback either binaural recordings for subjective and objective experiments or mono/stereo recordings in cases where a less realistic reproduction is sufficient. With slight modifications the
geometrical setup can be transferred to other environments like cars for example. Another benefit of this arrangement is the moderate hardware effort.
Concerning the sound reproduction a drawback of this arrangement is that due to the superimposed loudspeaker signals mostly in anechoic rooms interferences appear. This effect obliged test subjects to keep their heads in a mostly fixed position during hearing tests, but also means that an exact sound reproduction is only possible in a small area in anechoic rooms. Another drawback for binaural reproduction is the fact that no exact crosstalk cancellation is possible with this arrangement. However in general this technique seems to be the most promising under the restrictions given (moderate hardware effort on the recording and especially on the reproduction side, close to original reproduction of the scenarios recorded without additional adjustment of the reproduction arrangement).
4.6
NTT Background-Noise Database
The NTT Background Database [i.4], which is commercially available from NTT is typically used for codec tests. The database contains noise files, which were recorded with a 4-channel recording using 4 directional microphones. The microphones were arranged in an angle of 90 degrees with 70 cm diagonal. Although the original signals were recorded with 20 kHz bandwidth, the signals commercially available are specially coded on a CD providing a bandwidth of 11 kHz/15 bit for each channel. A special decoder is needed if the signals are to be presented acoustically over loudspeakers. The loudspeaker arrangement is suggested in a condition list. For calibration a calibration tone is provided, only level calibration is performed, no equalization procedure is described.
For the electrical evaluation of systems a downmix of the 4-channel recording to a mono channel with 8 kHz sampling rate is available. This signal is mostly used for the evaluation of new speech codecs in order to evaluate the influence of background noise on the coder performance.
Applications:
The NTT-database is mostly used for the evaluation of speech coders using the 8 kHz down sampled signals. When using the acoustical 4-channel playback the limitation is mostly due to the bandwidth limitation of 11 kHz, which may be not sufficient for future wideband applications.
Conclusion:
The disadvantage of this arrangement is found on the recording and on the playback side. For the recording a special microphone arrangement and a special coding technique is needed. The signal on the reproduction side is band limited and may not be used in future wideband applications. Currently it is not clear how the playback system can be calibrated and equalized in order to achieve a close to original sound field and which procedure should be followed during recording in order to get the right calibration and setup for the recording. Furthermore microphone arrangement chosen seems to be impractical for the recording of scenarios in small rooms e.g. in a car.
Another drawback is that the background noise database needs to be purchased for each application including a special decoder. It is not clear to what extent the recording and coding technique is commercially available.
4.7 General
conclusions
Although a variety of reproduction techniques exist the usability of such methods within the constraints for laboratory use namely:
• easy and well described recording technique;
• easy to install and easy to use playback technique at reasonable costs;
• installation of the playback technique in a variety of different rooms with different acoustical conditions; is limited. A four-channel loudspeaker setup with associated subwoofer based on binaurally recorded material is selected as the basis for the ETSI background noise simulation arrangement.
5 Recording
arrangement
5.1 Binaural
equalization
The sound field simulation technique described in the present document is generally based on the binaural recording and reproduction technique as has been known for many years (see [i.6]). The general principle of the recording and playback technique is to provide a recording instrument (artificial head or test subject wearing binaural probe microphones) which allows the recording of the ear signals typically received by the human user in a sound field as close to the original as possible. When an artificial head (HATS- head and torso simulator) is used it should represent the "average human". A suitable description of the properties of the artificial head to be used for the recording techniques can be found in ITU-T Recommendation P.58 [i.8], which describes the head and torso simulator for use in telephonometry. Since the directivity characteristics of an artificial head is strongly directionally dependent, the output signals of the microphones of an artificial head can not be directly compared to a standard measurement microphone and an equalization procedure has to be applied in order to get comparable output signals. Various types of equalization procedures for artificial head recordings can be used. The following are known:
Free Field Equalization
The artificial head is equalized in such a way that for frontal sound incidence in anechoic conditions the frequency response of the artificial head is flat.
Diffuse Field Equalization
The artificial head is equalized in a diffuse sound field. For random sound incidence the frequency response of the artificial head is flat (see also microphone diffuse field equalization).
Independent of Direction Equalization
This technique is based on the fact that the transmission characteristics of an artificial head is influenced by components independent of direction (cavum concha resonance, ear canal transfer function) and components which contribute depending on the direction of sound incidence to the measured transfer function. The equalization considers only those components of the head related transfer function which are independent of direction.
5.2 The
equalization
procedure
Generally the artificial head (HATS) used should comply with the requirements as defined in ITU-T Recommendation P.58 [i.8]. Although all equalization methods described below can be used, the preferred method is the diffuse field equalization or (if available) the independent of direction equalization. This is because there are the less sharp peaks and dips in the transfer function of the artificial head compared the freefield transfer function (see also ITU-T
Recommendation P.58 [i.8]).
Free-Field Equalization
The free-field equalization is made for this reference position in an anechoic room. The reference source is placed on the reference axis of the HATS, at a minimum distance of 1,5 m from the HATS lip-ring. When using a binaural microphone this point corresponds to the lip plane of a human user wearing the binaural microphone. The measured free-field response of the HATS is:
Hff(0°, 0°, f) From this the free-field equalization is calculated:
Hff-EQ(0°, 0°, f) = 1/Hff(0°, 0°, f)
The equalization should be correct within ±0,5 dB within the frequency range from 100 Hz to 8 kHz measured in 1/3rd octave bands.
NOTE: The free-field equalization of a HATS requires a very careful set-up of the measurement. Due to the directivity of the HATS small deviations from the reference position (0°, 0°) may cause wrong equalized transfer functions.
Diffuse Field Equalization
The diffuse-field equalization is made for this reference position in a diffuse sound field. Either an echoic room is used or an arrangement of multiple loudspeakers each fed by an uncorrelated noise signal and generating a truly diffusive sound field. The HATS is positioned in the centre of the diffusive sound field.
The measured diffuse-field response of the HATS is: Hdf(f) From this the diffuse-field equalization is calculated:
Hdf-EQ( f) = 1/Hdf(f)
Hdf-EQl(f) is called diffuse-field equalization of left ear; Hdf-EQr(f) is called diffuse-field equalization of right ear. The equalization should be correct within ±0,5 dB within the frequency range from 100 Hz to 8 kHz measured in 1/3rd octave bands.
Independent of Direction Equalization
The independent of direction equalization cannot be measured directly but needs to be calculated by calculating the influence of the non-directional components of the head related transfer functions and generating the equalization function by using the inverse of the ID-transfer function. The influence of the ear canal and the cavum concha is direction independent while the influence of the outer ear, the head, the shoulder and the human body are dependant on the direction of sound incidence. The transfer function of the cavum concha and the ear canal can be modelled by a cavity followed by an acoustical canal which is terminated by the ear drum. The appropriate model and the procedures are described e.g. in [i.12].
The measured free-field response of the HATS can be separated into: Hff(f) = Hdd(f) + Hid(f)
with Hdd(f) - directional dependant part of the head related transfer function. Hid(f) - directional independent part of the head related transfer function. From this the independent of direction equalization is calculated:
Hid-EQ( f) = 1/Hid(f)
Hid-EQl(f) is called ID-equalization of left ear; Hid-EQr(f) is called ID-equalization of right ear.
The equalization should be correct within ±0,5 dB within the frequency range from 100 Hz to 8 kHz measured in 1/3rd octave bands.
All equalization techniques can be applied to an artificial head as well as to a binaural probe microphone, which is worn by the user himself instead of using an artificial head. If probe microphone techniques (so called MIRE techniques - microphone in real ear, see ISO 11904-1 [i.5]) are used the same equalization technique as applied for the HATS needs to be used.
The preferred recording methodology however is the artificial (HATS) technique since the performance characteristics of HATS are well described and problems due to mispositioning, differences for different persons wearing the binaural microphone and equalization errors are unlikely.
The equalization technique chosen for the recording process should be the same, which is used in the equalization process for the loudspeakers (see clause 6.3).
The recording setup is generally described in figure 1.
artificial head equalizer right
AH or BM Equalizer right Artificial Head (AH)
or Binaural Microphone worn by a subject (BM) Upload to Data Base AH or BM Equalizer left
Figure 1: Recording setup
6
Loudspeaker Setup for Background Noise Simulation
6.1
Test Room Requirements
The reproduction technique chosen does not require specific types of rooms such as anechoic rooms. The technique is applicable in typical office rooms as well as in anechoic or semianechoic rooms. The playback room should meet the following requirements:
• Room Size
The room size should be in a range between 2,5 × 3 m and 3,5 × 4 m. The room height should be between 2,20 m and 2,50 m.
• Treatment of The Room
Office type rooms should be equipped with a carpet on the floor and some acoustical damping in the ceiling as typically found in office rooms. A curtain should cover one or two walls in order to avoid strong reflections by hard surfaces in the room. The reverberation time of the room should be less than 0,7 s but higher than 0,2 s between 100 Hz and 8 kHz.
For anechoic or semianechoic no additional treatment is needed.
• Noise Floor
In order to reduce the influence of external noise the noise floor measured in a room should be less than 30 dBSPL(A).
6.2 Loudspeaker
Positioning
The loudspeaker should be positioned as indicated in figure 2. The distance between the centre of the acoustical field (the position which is used for equalization and where the test arrangement is typically placed) should be 2 m. The distance between each loudspeaker and the centre of the simulation setup and between two adjacent loudspeakers should be equal.
The height of the four loudspeakers should be chosen so that the centre of the acoustical field is of the same height as the loudspeaker positions. The positioning of the subwoofer is mostly uncritical, however placing the subwoofer exactly in the corner of a room should be avoided.
Subwoofer
2m 2m
2m 2m
Figure 2: Loudspeaker arrangement in standard office rooms
6.3
Equalization and Calibration
A four-loudspeaker arrangement as described in clause 6.2 is positioned in a standard office room, described in clause 6.1. The complete block diagram of the setup is shown in figure 3.
Subwoofer
τ
≈
τ
≈
τ
≈
τ
≈
τ
≈
2m2m 2m 2m
Playback
Figure 3: General setup of the equalized four loudspeaker arrangement in an office room
For the equalization an artificial head according to ITU-T Recommendation P.58 [i.8] is used. The artificial head (HATS) should be equalized. The equalization shall correspond to the equalization used for the sound field recording (free-field, diffuse-field, ID, see clause 5.2). The artificial head is positioned in the centre of the acoustical field (middle of the four loudspeakers, see figure 3).
In general the equalization is done binaurally: the two left-hand speakers are equalized to the left channel of the artificial head and the right-hand loudspeakers are equalized to the right channel of the artificial head. In practice the signal of the left-hand loudspeakers will also reach the right channel of the artificial head, which impairs the
equalization. The influence of this cross talk cannot be eliminated, but it may be minimized as described in the equalization procedure. In anechoic or semianechoic rooms the following delays are added to the individual
loudspeakers: 0 ms, 11 ms, 17 ms, 29 ms. This additional delays are required in order to increase the diffusitivity of the sound field in anechoic conditions. For further information see annex B. Except the delay compensation described in step 5 below for office type rooms the equalization and calibration procedure is identical for all rooms.
The equalization is made in several steps:
1) Separate equalization for each of the four loudspeakers. 2) Separate level adjustment for each loudspeaker.
3) Equalization for the two left-hand and the two right-hand loudspeakers. 4) Equalization and level adjustment for the subwoofer.
5) Delay compensation.
6) Equalization for all loudspeaker (verification and reduction of cross-talk). Each of the steps is described in the following:
7) Separate Equalization for each of the four loudspeakers
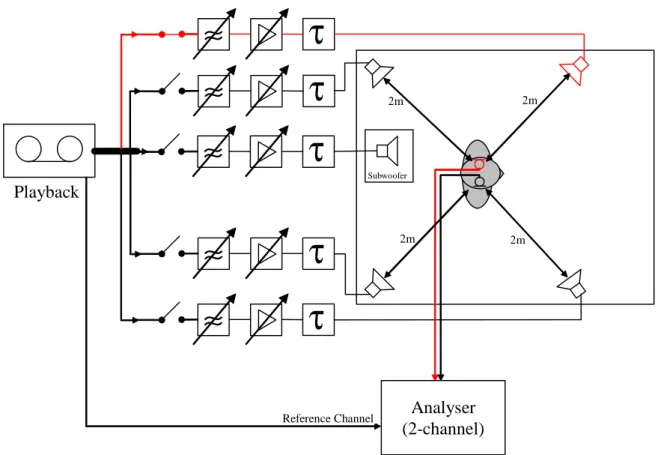
For the equalization of the single loudspeakers a pink (pseudo) noise signal is used. It is fed sequentially to the front-left, the rear-left, the front-right and the rear-right loudspeaker. The feeding shall be done for a frequency range of 120 Hz to 20 000 Hz (for the four loudspeakers only). The subwoofer covers the frequency range below 120 Hz. As an example the equalization is described for the front-left loudspeaker (see figure 4). For the other loudspeakers the process is identical.
Subwoofer
τ
≈
τ
≈
τ
≈
τ
≈
τ
≈
Analyser
(2-channel)
2m 2m 2m 2m Reference ChannelPlayback
NOTE: Signal path for equalizing the front-left loudspeaker is marked red.
Figure 4: Block diagram of equalization setup
The pink (pseudo) noise signal is filtered with a 120 Hz high pass and then is fed to the front-left loudspeaker for at least 2 s. Synchronously the played back signal is recorded at the left ear's output of the artificial head. The power density spectra then are calculated for the recorded ear signal and for the original signal. The averaged magnitude of the two power density spectra are subtracted as follows:
)
(
)
(
)
(
f
S
f
S
f
H
pn LS LS=
HLS(f) is analysed in 3rd octaves. The measured resulting frequency response shall be flat between 120 Hz and 10 kHz within a tolerance of ±3 dB.
To fulfil this condition a filter needs to be designed which compensates the frequency response of the
loudspeaker in the room. The compensating filter frequency response is calculated from the initially measured loudspeaker frequency response by using the inverse filter function:
)
(
1
)
(
f
H
f
H
LS EQ=
The equalized (pseudo) noise signal is applied at the front left loudspeaker. Figure 5 shows an example of the measured loudspeaker frequency response after the equalization process.
L/dB -10 -7.5 -5 -2.5 0 2.5 5 7.5 10 f/Hz 50 100 200 500 2000 5000 10k SND (1) - Source low er upper
Figure 5: Difference of the original signal and the equalized signal played back by the front-left loudspeaker measured with the artificial heads left ear (without subwoofer)
8) Separate level adjustment for each loudspeaker
After each of the loudspeakers is equalized separately, the sound pressure level of each loudspeaker should be adjusted. To reproduce the original level of any sound source with this four-loudspeaker arrangement, the level of each of the four loudspeakers should be 6 dB lower than the level of the original sound source due to the fact that the sound source is now reproduced by four loudspeakers.
This level adjustment can be achieved by recording and analysing the played back signal for each loudspeaker as described in the first step and after that, adjusting the level to a level 6 dB below the original level.
9) Equalization for the two left-hand and the two right-hand loudspeakers
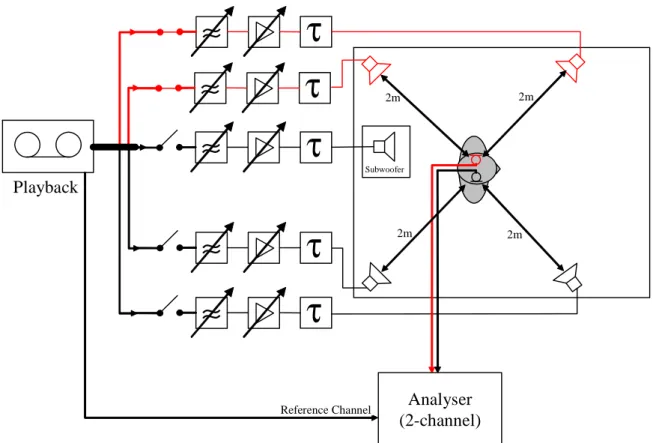
In the third step the equalization is done for the two - separately equalized - left-hand respectively the right-hand loudspeakers in combination (see figure 6). A stationary, realistic broadband noise (e.g. broadband office noise or car noise recorded under constant driving condition) is used as the test signal. This test signal is used in order to achieve the same frequency dependant correlation as for typical artificial head recordings and to avoid disturbing influences due to the periodicity of the pink pseudo noise.
Subwoofer
τ
≈
τ
≈
τ
≈
τ
≈
Analyser
(2-channel)
2m 2m 2m 2mτ
≈
Reference ChannelPlayback
NOTE: Signal path for equalizing the left loudspeakers in combination is marked red.
Figure 6: Block diagram of equalization setup
The test signal is synchronously applied to the left-hand loudspeakers (front and rear) and - similar to step 1 - recorded with the artificial heads left channel and spectrally analyzed in 3rd octaves. Again the measured difference of the recorded and the played back signal should meet the 6 dB tolerance scheme as shown in figure 5.
If the recorded signal fails the tolerance scheme, the filter for one or both of the left-hand loudspeakers is re-designed to pass the tolerance scheme.
NOTE 1: The tolerance scheme for a single loudspeaker might be violated, if the equalization for the combined left loudspeakers passes the tolerance scheme.
The equalization for the right-hand loudspeakers is done similar. 10) Equalization and level adjustment for the subwoofer
The equalization for the subwoofer is done for the frequency range between 30 Hz and 120 Hz. The frequency range above is cut off by a low pass filter providing a roll of characteristics of at least 18 dB / oct. Again a pink pseudo noise is used as test signal. Similar to the equalization for the four loudspeakers, the pink noise is played back by the subwoofer and recorded at the right ear. On the basis of the difference of the recorded and the original pink noises spectrum a filter is designed with which this difference (analyzed in 3rd octaves) is spectrally flat in a 6 dB tolerance scheme.
The level is adjusted to the level of the original sound source. 11) Delay compensation
For the four loudspeaker arrangement including the subwoofer a compensation of the individual loudspeaker delay to the center of the acoustical field is required in order to keep the correlation of the recorded noise material with respect to the center of the acoustical field. Wrong delay adjustment might lead to comb filter effects, which leads to unnatural sounding of the background noise signals. Therefore it is necessary to compensate the delays of all used loudspeakers to one common delay for all.
The following delays are measured and the corresponding signal paths are compensated to the longest delay (mostly caused by the subwoofer):
- delay from the left loudspeakers to the left ear; - delay from the right loudspeakers to the right ear; - delay from the subwoofer to the right ear. 12) Overall equalization for all loudspeakers
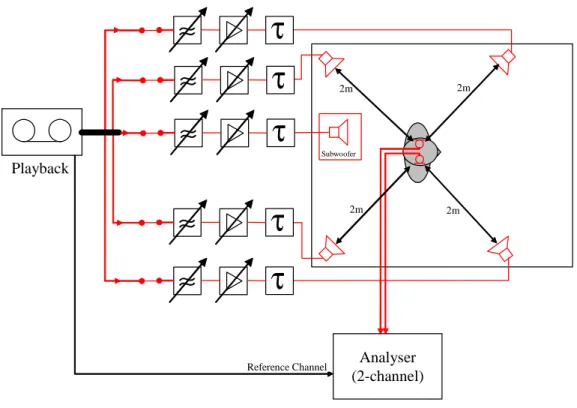
The last step is to verify the equalization process including the delay compensation. Therefore a stationary, realistic pre-recorded broadband background noise signal is fed to the four-loudspeaker arrangement. All equalizers, level and delay adjustments are active, the signal is played back by all loudspeakers including the subwoofer (see figure 7). The reproduced sound field is recorded at both ears of the artificial head. For each ear-channel the recording is spectrally analysed in 3rd octaves and referenced to the spectrum of the original signal. The measured frequency response for the left ear signal and the right ear signal again shall be within a tolerance of ±3 dB for each channel.
Subwoofer Analyser (2-channel) 2m 2m 2m 2m
τ
≈
τ
≈
τ
≈
τ
≈
τ
≈
Reference Channel PlaybackNOTE: Signal paths for overall equalization is marked red.
Figure 7: Block diagram of equalization setup
If the result is outside the tolerance it needs to be checked which of the four loudspeakers is mostly contributing to the equalization error. Typically the tolerance scheme is violated only in a small frequency range.
In the first step it is checked, whether the equalization error is due to the crosstalk signal. Therefore the loudspeakers producing the crosstalk signal are switched off. If now the equalization error disappears, first the front loudspeaker (producing a the crosstalk signal) and then the back loudspeaker (producing the crosstalk signal) is switched on again. By this the loudspeaker mostly contributing to the equalization error is found. The equalization of this loudspeaker then is corrected and overall the equalization is checked again for the left and the right channel. This procedure is repeated until the equalization error is within the required tolerance for both channels. Sometimes the equalizer for the front and the rear loudspeaker needs to be corrected.
If the equalization error is mostly due to the loudspeakers producing the direct sound for the channel under consideration, then the equalizers for these loudspeakers need to be corrected. The procedure is the same as described for the crosstalk loudspeakers as described above.
NOTE 2: In (exceptional cases) an equalization correction needs to be applied to both, the direct sound
loudspeakers and the crosstalk loudspeakers. In such cases the route which should be followed should be to carefully adjust the equalization of the different loudspeakers contributing to the error and not try to minimize the equalization error by correcting the equalization of a single loudspeaker by a strong filter change.
6.4
Accuracy of the reproduction arrangement
During the validation process a variety of experiments was conducted in order to get an estimate of the reproduction accuracy of the four-loudspeaker playback arrangement. This validation was conducted in various steps. All validation was performed by comparing the 1/12th octave spectra and 1/3rd octave spectra. Since the results are not generally different in the following only the 1/3rd octave results are displayed.
6.4.1
Comparison between original sound field and simulated sound field
The data reported below were derived from the following experiment.
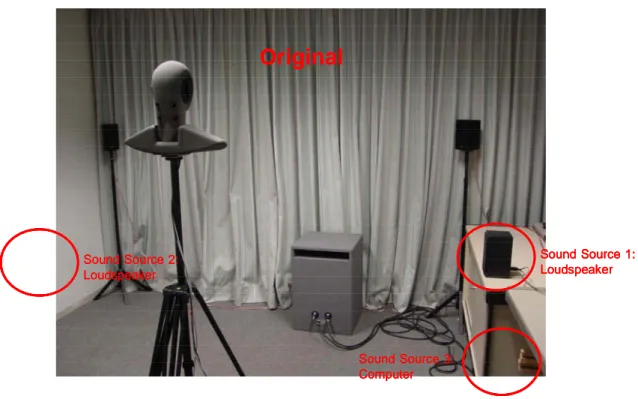
In an office room a background noise sound field was generated. Two loudspeakers and a computer, which produce typical fan noise, were positioned in an office room . The sound field produced by this arrangement was recorded using an artificial head positioned in the middle of the room. The arrangement is shown in figure 8.
Sound Source 1: Loudspeaker Sound Source 2: Loudspeaker Sound Source 3: Computer
Original
Sound Source 1: Loudspeaker Sound Source 2: Loudspeaker Sound Source 3: Computer Sound Source 1: Loudspeaker Sound Source 1: Loudspeaker Sound Source 2: Loudspeaker Sound Source 2: Loudspeaker Sound Source 3: Computer Sound Source 3: ComputerOriginal
Figure 8: Simulation arrangement in a standard office room
In addition the four-loudspeaker arrangement was installed in the same room. The installation was made so that the artificial head was positioned in the centre of the acoustical field of the simulation arrangement.
The comparison was made by recording the original sound field and comparing the recorded signals to the signals recorded when using the four-loudspeaker simulation system.
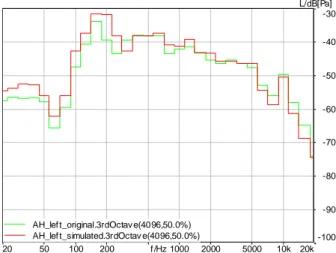
The spectra recorded at the right and the left ear are shown in figures 9 and 10. It can be seen that the spectra of the original and the simulated sound field match quite well.
L/dB[Pa] -100 -90 -80 -70 -60 -50 -40 -30 f /Hz 20 50 100 200 1000 2000 5000 10k 20k AH_lef t_original.3rdOctav e(4096,50.0%)
AH_lef t_simulated.3rdOctav e(4096,50.0%)
NOTE: Original soundfield (green curve), simulated sound field (red curve).
Figure 9: Power density spectra measured at the artificial heads left ear
L/dB[Pa] -100 -90 -80 -70 -60 -50 -40 -30 f /Hz 20 50 100 200 1000 2000 5000 10k 20k AH_right_original.3rdOctave(4096,50.0%) AH_right_simulated.3rdOctave(4096,50.0%)
NOTE: Original soundfield (green curve), simulated sound field (red curve).
Figure 10: Power density spectra measured at the artificial heads left ear
6.4.2
Displacement of the test arrangement in the simulated sound field
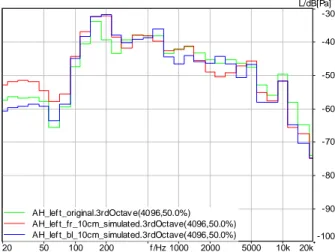
For these experiments the head and torso simulator used for the measurements was displaced by 10 cm to the frontal right and 10 cm backwards left. For these positions in comparison to the centre position of the sound field where the artificial head was equalized to, the spectral differences are displayed in figures 11 and 12. It can be seen that despite of the displacement the recorded spectra still match comparably well the maximum error measured in third octaves, which can be expected due to misplacing of about 5 dB.
L/dB[Pa] -100 -90 -80 -70 -60 -50 -40 -30 f /Hz 20 50 100 200 1000 2000 5000 10k 20k AH_lef t_original.3rdOctav e(4096,50.0%)
AH_lef t_fr_10cm_simulated.3rdOctave(4096,50.0%) AH_lef t_bl_10cm_simulated.3rdOctave(4096,50.0%)
NOTE: Displaced 10 cm to the frontal right (red curve), displaced 10 cm backwards left (blue curve).
Figure 11: Original (green curve) and simulated power density spectra measured at the artificial head's left ear
L/dB[Pa] -100 -90 -80 -70 -60 -50 -40 -30 f /Hz 20 50 100 200 1000 2000 5000 10k 20k AH_right_original.3rdOctave(4096,50.0%) AH_right_fr_10c m_simulated.3rdOctave(4096,50.0%) AH_right_bl_10c m_simulated.3rdOctave(4096,50.0%)
NOTE: Displaced 10 cm to the frontal right (red curve), displaced 10 cm backwards left (blue curve).
Figure 12: Original (green curve) and simulated power density spectra measured at the artificial head's left ear
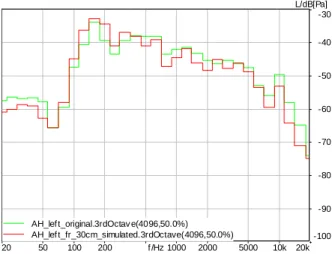
A further test was conducted by moving the artificial head by 30 cm away from the centre of the four-loudspeaker arrangement to the frontal right position. Again the difference of the spectra recorded in this position is displayed for the right and the left output signal of the artificial head, see figures 13 and 14. It can be seen that for the left ear of the artificial head now the maximum difference measured in third octave is increase up to about 7 dB compared to the original position. For the right artificial ear the spectra still match quite well.
L/dB[Pa] -100 -90 -80 -70 -60 -50 -40 -30 f /Hz 20 50 100 200 1000 2000 5000 10k 20k AH_lef t_original.3rdOctav e(4096,50.0%)
AH_lef t_fr_30cm_simulated.3rdOctave(4096,50.0%)
NOTE: Displaced 30 cm to the frontal right (red curve).
Figure 13: Original (green curve) and simulated power density spectra measured at the artificial head's left ear
L/dB[Pa] -100 -90 -80 -70 -60 -50 -40 -30 f /Hz 20 50 100 200 1000 2000 5000 10k 20k AH_right_original.3rdOctave(4096,50.0%) AH_right_fr_30c m_simulated.3rdOctave(4096,50.0%)
NOTE: Displaced 30 cm to the frontal right (red curve).
Figure 14: Original (green curve) and simulated power density spectra measured at the artificial head's left ear
6.4.3
Transmission of background noise: Comparison of terminal
performance in the original sound field and the simulated sound field
Handset terminals
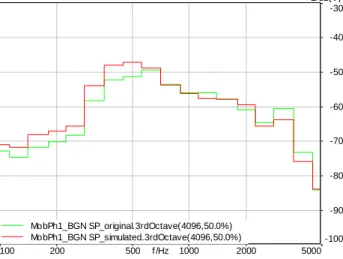
Further experiments were aimed to validate the performance of the four-loudspeaker arrangement with typical terminals applied to the test arrangement. For terminal tests a head and torso simulator according to ITU-T Recommendation P.58 [i.8] equipped with an artificial ear according to ITU-T Recommendation P.57 [i.7], type 3.4 was placed in the centre of the four-loudspeaker arrangement. Different terminals were applied to the HATS, positioned as described in ITU-T Recommendation P.64 [i.10]. For comparison the output signals of the terminals in sending direction were recorded. These recordings were conducted when applying the original background noise field and when applying the simulated background noise field. The typical differences measured in sending direction for a terminal with background noise signal processing is shown in figure 15. The result for a linear terminal without background noise signal
L/dB[V] -100 -90 -80 -70 -60 -50 -40 -30 f /Hz 100 200 500 1000 2000 5000 MobPh1_BGN SP_original.3rdOctave(4096,50.0%) MobPh1_BGN SP_simulated.3rdOctave(4096,50.0%)
NOTE: Original soundfield (green curve), simulated soundfield (red curve).
Figure 15: Power density spectra measured with a common mobile phone (with background noise signal processing) positioned at the artificial heads right ear
L/dB[V] -100 -90 -80 -70 -60 -50 -40 -30 f /Hz 100 200 500 1000 2000 5000 MobPh2_original.3rdOctave(4096,50.0%) MobPh2_simulated.3rdOctave(4096,50.0%)
NOTE: Original soundfield (green curve), simulated soundfield (red curve).
Figure 16: Power density spectra measured with a common mobile phone (without background noise signal processing) positioned at the artificial heads right ear
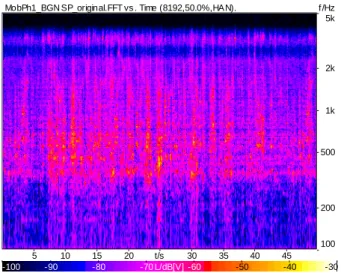
Furthermore, the temporal structure of the transmitted background noise was evaluated. The comparison of the temporal structure when applying the original background noise field to the situation with simulated background noise field is shown in figures 17 and 18. In both figures the spectral presentation of output signal is shown. The characteristics of the temporal structure of the background noise are very comparable. It can be expected that also for other types of terminals with integrated signal processing the simulated noise field will produce similar behaviour than the terminal would show in the original noise field.
MobPh1_BGN SP_original.FFT vs . Time (8192,50.0%,HAN). f /Hz
100 200 500 1k 2k 5k t/s 5 10 15 20 30 35 40 45 L/dB[V] -100 -90 -80 -70 -60 -50 -40 -30
Figure 17: 3D power density spectrum of background noise measured with a common mobile phone (with background noise signal processing): original sound field
MobPh1_BGN SP_simulated.FFT vs . Time (8192,50.0%,HA N). f /Hz
100 200 500 1k 2k 5k t/s 5 10 15 20 30 35 40 45 L/dB[V] -100 -90 -80 -70 -60 -50 -40 -30
Figure 18: 3D power density spectrum of background noise measured with a common mobile phone (with background noise signal processing): simulated sound field
Wideband headset
The same types of experiments as described above were conducted using a wideband headset equipped with a directional microphone. The results - the transmitted noise spectra for the original sound field compared to the
simulated sound field are shown below in figure 19. Since the orientation of the microphone was in such a way that the lowest sensitivity of the microphone was exactly facing one of the noise generating loudspeakers on the left side, the transmitted signal energy of the background noise is lower in the original sound field as compared to the simulated sound field where the sound field is more diffusive. The measured difference of about 5 dB can be regarded as a kind of worst case situation, as the more diffusive the recorded sound field is the less errors are expected in the simulation.
Desktop hands-free terminal
Since the background noise simulation should be suitable for handset terminals and hands-free terminals another experiment was conducted using a desktop hands-free terminal in the same test room. A table was positioned in the test room in front of the artificial head, which was still positioned in the centre of the simulated acoustical field. The hands-free terminal was positioned as described in ITU-T Recommendation P.340 [i.9]. Again the transmitted background noise signal between the original sound field and the simulated sound field are compared. The resulting power density spectra for the transmitted background noise are shown in figure 20. Although the four-loudspeaker arrangement was not reequalized after the table was placed in the room the spectra of the transmitted background noise match rather well. It can be expected that even for desktop hands-free phones placed in the simulation environment the measured performance of background noise transmission is comparable to the one measured in typical office
environments. L/dB[V] -100 -90 -80 -70 -60 -50 -40 -30 f /Hz 20 50 100 200 1000 2000 5000 10k 20k Headset_original.3rdOc tave(4096,50.0%) Headset_simulated.3rdOc tave(4096,50.0%)
NOTE: Original soundfield (green curve), simulated soundfield (red curve).
Figure 19: Power density spectra measured with a common (wideband) headset with directional microphone worn by the artificial head
L/dB[V] -100 -90 -80 -70 -60 -50 -40 -30 f /Hz 100 200 500 1000 2000 5000 DesktopHFT_original.3rdOctav e(4096,50.0%) DesktopHFT_simulated.3rdOctav e(4096,50.0%)
NOTE: Original soundfield (green curve), simulated soundfield (red curve).
Figure 20: Power density spectra measured with a common desktop hands-free telephone positioned in front of the artificial head
Wideband conference system
The conference system was installed like a typical desktop hands-free system. The setup is according to ITU-T Recommendation P.340 [i.9], the setup used is identical to the hands-free setup as described above. The wideband conference system was equipped with a directional microphone (on the table), ITU-T Recommendation G.722 [i.11] coding was used.
The difference between the transmitted background noise of the original sound field and the simulated sound field is shown in figure 21.
As seen already for the narrow band hands-free system, the measured spectra are rather close; the maximum difference is about 6 dB at 3 kHz. L/dB[V] -100 -90 -80 -70 -60 -50 -40 -30 f /Hz 50 100 200 500 1000 2000 5000 10k WB_HFT_original.3rdOctave(4096,50.0%) WB_HFT_simulated.3rdOctave(4096,50.0%)
NOTE: Original soundfield (green curve), simulated soundfield (red curve).
Figure 21: Power density spectra measured with a wideband conference system positioned in front of the artificial head
7
Background Noise Simulation in cars
7.1 General
setup
Some types of terminals are mostly used in a car environment, e.g. portable hands-free units with mobile phones or hands-free terminal systems which are integrated in cars. For portable hands-free phones worn by the user in the car the setup and equalization process is similar to the one described in the office room except that the artificial head is positioned at the drivers seat instead of positioning it in the middle of the room.
For hands-free terminals installed in the car, in principle the same setup is used for background noise simulation in a car and in office rooms. Four loudspeakers and a subwoofer are used. The subwoofer is positioned in the trunk of a car. The two rear loudspeakers are positioned in the back of the car between the headrest and the window respectively the c-pillar. The two front loudspeakers are positioned either above the instrument panel or at the bottom in the footwell (only in cases where the instrument panel position is impossible to realize) - depending on the tested car setup. The block diagram of the setup is shown in figure 22.
It should be noted, that the use of the four loudspeaker arrangement in a car is more sensitive concerning the positioning of the microphone than the simulation in an office room. Due to the smaller car cabin room dimensions and the
surrounding reverberant windows standing waves and interferences appear in the car cabin.
Therefore it is highly recommended to use the same microphone for equalization and terminal testing. This requires that the microphone can be separated from the hands-free terminal and can be used for system equalization as well as in combination with the hands-free terminal. The microphone then shall be located at the position intended for use after installation. The equalization with the terminal's microphone is described in clause 7.3. This proceeding ensures that the soundfield is exactly reproduced for the relevant position.
If the terminal's microphone signal is not accessible for the equalization and calibration system a pair of cardioid microphones shall be used instead. They should be located as close as possible to the expected terminal microphone position to provide the simulated sound field as close as possible to the correct position. The equalization with a pair of cardioid microphones is described in clause 7.4.
In general, the methods described can be applied for other microphone positions in a car. There is high confidence that for any microphone position intended to pickup the drivers or the co-drivers voice the methods described will work with the same accuracy as described. This is also expected when the original microphone is used at other locations in the car for recording and equalization. The stereo cardioid microphone technique at other locations in the car may be applicable but its accuracy was not investigated within the framework of this project.
Subwoofer
HFT
Background noiseLoud-
Speaker
equalizer
Figure 22: General setup of four loudspeaker arrangement and hands-free terminal in a car
7.2 Recording
arrangement
The recording arrangement depends on the microphone setup which is used for the equalization and calibration.
7.2.1
Recording setup with the terminal's microphone
If the equalization and calibration is done with the terminal's microphone the recordings shall also be done with this microphone. The microphone then is positioned at the location intended to be used with the hands-free terminal. The position shall be the same for the recordings, the calibration and equalization and for the testing with the simulation arrangement. A block diagram of the recording arrangement is shown in figure 23.
With this configuration, recordings should be made at different driving speeds as required to simulate the real use conditions. Pass-by effects and road bumps should be avoided.
NOTE: The microphone should be attached firmly to the ceiling to avoid structure borne noise induced by accidental movements of the microphone.
Terminal’s
Upload to Data Base microphone
Figure 23: Setup for recordings with terminal microphones in cars
7.2.2
Recording setup with a pair of cardioid microphones
If a pair of cardioid microphones is used, the recordings should also be done with these microphones. They should be positioned as close as possible to the expected hands-free microphone position, see figure 24. When a microphone array is used as the hands-free microphone, the center of the array should be used as the reference point for positioning the cardioid microphones.
The microphones should be fastened with shock mount to avoid recording structure borne noises.
artificial head equalizer right Cardioid microphone left Upload to Data Base Cardioid microphone right
Figure 24: Setup for recordings with a pair of cardioid microphones in cars
With this configuration recordings should be made for different driving speeds as required to simulate the real use conditions. Pass-by effects and road bumps should be avoided.
7.3
Equalization and Calibration with the terminal's microphone
A four loudspeaker arrangement as described in clause 7.1 is positioned in a car for which the terminal will be tested. A complete block diagram of the setup is shown in figure 25.For the equalization the terminal's microphone should be located at the position of later use by customers, e.g. under the ceiling or in or on top of the rear view mirror.
τ
≈
Subwooferτ
≈
τ
≈
τ
≈
τ
≈
Figure 25: General setup of the equalized four loudspeaker arrangement in a car
The equalization is made in several steps:
1) Separate equalization for each of the four loudspeakers. 2) Separate level adjustment for each loudspeaker.
3) Equalization for the two left-hand and the two right-hand loudspeakers. 4) Equalization and level adjustment for the subwoofer.
5) Delay adjustment. 6) Overall equalization.
Each of the steps is described in the following:
1) Separate equalization for each of the four loudspeakers
For the equalization of the loudspeakers a stationary, realistic broadband noise (e.g. broadband car noise recorded under constant driving conditions) is used. It is sequentially fed to the front-left, the rear-left, the front-right and the rear-right loudspeaker. The feeding should be done for a frequency range of 120 Hz to 20 000 Hz (for the four loudspeakers only). The subwoofer covers the frequency range below 120 Hz. As an example the equalization is described for the front-left loudspeaker (see figure 26). For the other loudspeakers the process is identical.
The stationary, realistic broadband noise is filtered with a 120 Hz high pass and then is fed to the front-left loudspeaker for at least 10 s. Synchronously the played back signal is recorded with the terminal's microphone. The power density spectra then are calculated for the recorded microphone signal and for the original signal. The averaged magnitude of the two power density spectra are subtracted as follows.
Subwoofer Reference Channel Playback Analyser
τ
≈
τ
≈
τ
≈
τ
≈
τ
≈
NOTE: Signal path for equalizing the front-left loudspeaker is marked red.
Figure 26: Block diagram of equalization setup
)
(
)
(
)
(
f
S
f
S
f
H
bbn LS LS=
HLS(f) is analysed in 3rd octaves. The measured resulting frequency response should be flat between 120 Hz and 10 kHz within a tolerance of ±3 dB.
To fulfil this condition a filter needs to be designed which compensates the frequency response of the loudspeaker in the car. The compensating filter frequency response is calculated from the initially measured loudspeaker frequency response by using the inverse filter function:
)
(
1
)
(
f
H
f
H
LS EQ=
The equalized broadband noise is applied at the front-left loudspeaker again. Figure 27 shows an example of the measured loudspeaker frequency response after the equalization process.
![Figure 3: General setup of the equalized four loudspeaker arrangement in an office room For the equalization an artificial head according to ITU-T Recommendation P.58 [i.8] is used](https://thumb-us.123doks.com/thumbv2/123dok_us/9804635.2472564/16.892.112.771.528.861/general-equalized-loudspeaker-arrangement-equalization-artificial-according-recommendation.webp)