Teaching the, Gaussian Distribution with
Computers in Senior
High School
Reishin
Nakamura
-
Nagoya-city, Japan1. Background features
In keeping pace with the development of information science and technology, it is now emphasised in mathematical education how to foster in students the sense of handling and assessing information. We propose a method of teaching probability distributions in order to cultivate a proper attitude towards information; in particular, towards dealing with randomness mathematically.
As the central position among all the probability distributions is occupied by the Gaussian distribution, in the following arguments the Gaussian distribution plays a dominant role.
The basic attitude of students is of great importance. When one measures the length of something, one may wonder how close the value obtained is to the real value. Having measured many values, we become more confident of the location of the true value. It is not until they get many measured values into perspective that students can appreciate the relation between measuring and m e values. At this point students begin to recognise probability distributions behind the measured results.
It is the first step towards acquiring the basic attitude that students need for a correct understanding of probability distributions, and it should be obtained through many examples.
To take the Gaussian distribution as the most important case, we should like to propose two ways for familiarising students with this distribution.
The first is to let students recognise Gaussian distributions as very natural distributions by showing them that the empirical distributions formed from actually collected data are often close to Gaussian. When learning about probability distributions, students begin with collecting data and making histograms. Without actual experience of collecting data, students never understand the real meaning of distributions. So we let them realise probability distributions by getting distributions
from easy experiments.
The second way is to induce the Gaussian distribution fiom the binomial dismbution. Of course, this way is very common in Japan already, but usually we do not spend much time on teaching it because of the tight schedule of the teaching programme. So, very few students understand it well. We are reconsidering this way.
The chief obstacle to the above-mentioned approaches is that they take much time and effort because of dealing with lots of data. This obstacle is one reason why we have not adopted experimental methods positively. But now this problem in Japan is going to be solved with the use of computers. Two particular advantages of the active use of computers at this point in school teaching are:
(i) We can arrange a lot of data and represent them in histograms with great ease and immediateness.
(ii) We can easily call up probability distributions, letting them overlay the obtained histograms, by using the computer's graphic and database functions.
First of all we want to review the present state and analyse some current problems of mathematics education, particularly probability and statistics education, in Japanese senior high schools.
1 -L
I
I 2. Probability and statistics in the present mathematics curricula for Japanese senior high @ools
It is remarkable that the curricula of all subjects for Japanese schools, private schools included, up to senior high schools, are set by the Ministry of Education through the Course of Study, which is a kind of national curriculum. The Course of Study is usually revised every decade. The present one was set in 1979 for senior high schools. Probability and statistics have been designated in the national curriculum since 1952 because the importance of probability and statistics teaching is generally recognised. An idea of the status of probability and statistics in the present Japanese national curriculum can be gained from the articles which outline the mathematics curricula for junior and senior high schools (see Midzuno et al., Session Al).
The contents of textbooks which we use to teach students probability and statistics in high schools are divided into four parts:
A. Numbers of possible outcomes
B. Probability
C
.
Probability distributionD. Statistics and statistical inference
It is noted that " A is fundamental to all mathematics and not limited to probability and statistics alone. Our students learn to acquire skill in computation and use of "C,,
"P,
and so on. However, to study "A" just before "B" may have a bad influence on probability study, because it can produce misunderstanding of the fundamental concept of probability. In fact, determining probability is reduced often to calculating the ratio of numbers of possible outcomes, and students assume that probability is only the numberobtained by the calculation of the number of possible outcomes. Actually, probability is measure expressing certainty of indefinite phenomena As to this point we should try harder to help students not to fall into faults of misunderstanding with the use of computers.
The following are typical examples from "B" of a Probability-Statistics" textbook:
1. If two dice are thrown at the same time, then determine the probability of the sum of the faces being 6.
2. If four balls are taken from a bag which contains five red balls and four white balls, then determine the probability of two being red and two being white.
3. If a coin is tossed five times, then determine the probability of h e . appearing once at least.
More than half the students stop learning after they have learned " A and "B". Therefore the number of students who reach "C" or "D" is actually less than half.
Finally, we mention the contents of "C", which consists of four parts: (i) anangement of data;
(ii) representative values and measures of dispersion; (iii) binomial distribution;
(iv) Gaussian distribution.
With the use of computers or calculators, students cannot learn the contents of "C" within the given time span because they have to deal with a lot of data. With this point under consideration, examples in the textbooks are apt to be easy to calculate. The following are typical examples of "C":
d
1. Let X be the number of coins which come up heads when we toss two coins. Obtain the distribution of the random variable X. 2. Let X be the sum of numbers shown on the faces when two die
are thrown together. Obtain the distribution of the random variable X.
The quantity of material to be dealt with in "C" is smaller than in the other sections and is not enough for students to properly learn "C". One of the reasons is that not only students but also teachers tend to keep off material that is impossible to calculate without using a calculator or computer. So, most of the textbooks avoid such material. Only binomial distributions are rather vigorously dealt with in the textbooks; however, the parameter "n" of B(n,p) is limited to small numbers, 10 or 15 at most. Bernoulli trials, for example, are typical of the material in the textbook, and so become familiar to students and often appear in the entrance examinations. The entrance examinations have to be taken without the use of a computer or calculator. Therefore the problems are to be solved without the use of any aids to computation. In this respect the entrance examinations give influences or distortions to our teaching of mathematics, particularly probability and statistics, though they encourage intensified
learning through and for problem-solving. Binomial distributions are so popular that Gaussian distributions are characterised mainly as a limit of normalised binomial distributions. Moreover, the approximation to the binomial distribution is not taught properly, as mentioned later.
It has been the Japanese traditional style in classrooms from the elementary school level up to the high school level to learn mathematics without the use of any aids to compuxtion. Such style has a bad influence on teaching probability distributions, ofwrhich examples in classrooms are artificial and limited to too large a size to deal with without the use of computing aids. With the use of computers we should give students a correct understanding of the Gaussian distributions.
We would like to show two examples for teaching with the use of computers in mathematics classes.
>
, 3. Two examples for teaching with the use of computers
3.1 Introducing the distribution of experimental errors
In looking for examples of the Gaussian distribution, it is very significant for us to have the distributions of errors from which the Gaussian distribution originated. We let students understand the distributions of errors with the following experiments. The objectives of the experiments are:
(i) to recognise that errors arise in measuring anything;
(ii) to understand the true meaning of mean value through having a birds-eye view of a distribution of errors;
(iii) to recognise the Gaussian distribution as a very natural one by forming various distributions with actual practice to collect data.
The use of the computer enables students to achieve these objectives.
We have two kinds of experiments as below. In each case, special care was taken to ensure the independence of trials so that the empirical distribution is close to a Gaussian distribution.
Experiment A-1: A teacher drops a ball fiom the top of a school building and
lets students measure with a stopwatch the time it takes the ball to reach the ground. The trial is repeated five times and the precision of the measurements is in the units of one hundredth second.
Experiment A-2: Let students measure the time it takes a pendulum to oscillate three times.
Experiment B-1: Each student stops his stopwatch while watching it when five seconds have passed. The students record the actual time the stopwatches have shown.
Experiment B-2: This is the same as B-1 except for stopping stopwatches without watching them. Trials of both B-1 and B-2 are repeated five times.
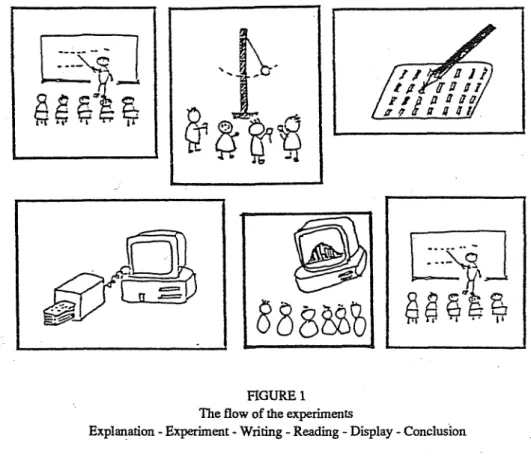
FIGURE 1
The flow of the experiments
Explanation
-
Experiment-
Writing-
R d m g-
Display-
ConclusionNote that the markcard-reader reduces the pain of collecting data and that the computer quickly arranges, classifies, and makes the
data
into histograms.We can get the following output of the results on the display: ) the tables of measured values, mean values and standard deviations;
(ii) the histograms;
(iii) the Gaussian distribution with the same mean values and stand2rd deviation as the above tables, overlaid on the histograms.
Besides this output, we can display also the following:
I!
(iv) the histogram of interesting
data
to students; like their weights and heights (the data are previously stored in the computer's memory);(v) the Gaussian distribution which correspcjnds to the histograms of (iv), overlaid on them.
We can also print out these things for later reference if necessary. 3.2 The normal approximation to the binomial distribution
curve as n of B(n,p) gets larger and larger. It is a typical introduction of the normal approximation to the binomial distribution in textbooks. In some textbooks it is shown also that the normalised binomial distribution tends to the standard Gaussian dism%ution.
To strictly understand the normal approximation to the binomial distribution students need materials concerned with limit theories. But it is beyond most students and even if some students overcome the difficulties it takes too much time. Therefore, we want students to understand the following points:
(i) The binomial distributions with any probability tend to a Gaussian distribution
as
"n" gets larger and larger.(ii) The appearance of the approximations differs for various values of the probab'ility.
(iii) The approximation is better near the mean value than in the tail of the dism%ution.
We specifically stress (iii). The graphical function of computers facilitates teaching of the normal approximation to the binomial distribution with emphasis on these points. For this purpose we have developed software for the normal approximation to the binomial distribution, explained in the figures below. They display the binomial as a broken line graph, first on its original scale and then after resealing, with the standard Gaussian available for comparison. We can set n and p to any value in each figure.
FIGURE 2
Display of B(n,p) and its normalisation (a) original; (b) normalied
FIGURE 3
Comparison between normalised B(nq) and the standard Gaussian distribution
The subject Probability and Statistics should play a basic role in order to cultivate students' ability to go well through the information intensive age.
Once we wish to do something in this direction, we should first let them collect and arrange data. However, as mentioned in Section 2, such a way of teaching is not always fitting for the Japanese style of education, particularly in senior high schools, because of over-heated competition at the entrance examinations, crowded curriculum and so on. Fortunately, the recent diffusion of microcomputers, which is supported by the Ministry of Education, encourages this teaching. We should use computers more actively, not only
as
teaching aids but alsoas
learning aids, in order to help students feel familiar with ideas of Probability and Statistics.With this idea in mind we have shown two examples of the use of computers in Section .3. Indeed, we have found students clearly understand the distributions, in particular the Gaussian distriiution, through the examples. We are sure that most of the students are keenly interested in the examples, except for the e n m c e examinations which they have to face. At the same time, we wonder if some students in senior high schools, used to studying mathematics based on rigid foundations, would have a sense of inconsistency because we have shown the examples at some sacrifice of theoretical accuracy; in brief, where we simulate the normal approximation instead of touching deeply upon the Gaussian density function. In the mathematics class, students learn that they must have proof, so we should always have materials for letting students understand the concept of Probability and Statistics theoretically as well as by using the computer.