April 2013
www.nrmp.org
Results and Data
Requests for permission to use these data as well as questions about the content of this publication or the
National
Resident Matching Program
data may be directed to Mei Liang, Director of Research, NRMP, at [email protected].
Questions about the NRMP should be directed to Mona M. Signer, Executive Director, NRMP,
at [email protected].
Suggested Citation
National Resident Matching Program, Results and Data: 2013
Main Residency Match
®. National Resident Matching
Program, Washington, DC. 2013.
NRMP Board of Directors
NATIONAL RESIDENT MATCHING PROGRAM
2121 K Street, NW
Suite 1000
Washington, DC 20037
The
NRMP
is governed by a 19-member Board of Directors:
President, President-Designate, and Secretary/Treasurer
Two graduate medical education program directors
Three medical students
Three resident physicians, one of whom is an international medical graduate
One public member
Officers
President: Thomas V. Whalen, M.D., Chief Medical Officer, Lehigh Valley Hospital
President-Designate: Hal B. Jenson, M.D., M.B.A, Dean, Western Michigan University School of Medicine
Secretary/Treasurer: Bruce E. Johnson, M.D., Associate Dean of Faculty Affairs, Virginia Tech Carilion Clinic
School of Medicine
Executive Director: Mona M. Signer, M.P.H.
Board Members, 2012-2013
C. Bruce Alexander, M.D., Professor and Vice Chair, Department of Pathology,
University of Alabama at Birmingham
Sameer Ather, M.D., Cardiovascular Disease Fellow, University of Alabama at Birmingham
Jeremy S. Boyd, M.D., Emergency Medicine Resident, University of Cincinnati
Baretta R. Casey, M.D., M.P.H., Professor of Medicine and Director of UK Center for Excellence in Rural Health,
University of Kentucky College of Medicine
Pavan K. Cheruvu, M.D., Internal Medicine Resident, Johns Hopkins University School of Medicine
Rita Kay Cydulka, M.D., M.S., Associate Chair, Academic Affairs, MetroHealth Medical Center
John DePaolo, Louisiana State University
Michael H. Duyzend, University of Washington
Jane L. Eisen, M.D., Department of Psychiatry and Human Behavior, Brown University
Glenn A. Fosdick, F.A.C.H.E., President/Chief Executive Officer, The Nebraska Medical Center
Susan Guralnick, M.D., Director of Graduate Medical Education, Winthrop University Hospital
William S. Johnson, University of Minnesota
Mahendr Kochar, M.D., M.S., M.B.A., J.D., Associate Dean of Graduate Medical Education,
University of California at Riverside
Daniel W. Morrissey, O.P.
Maria C. Savoia, M.D., Dean for Medical Education, University of California San Diego
Steven J. Scheinman, M.D., President, Dean, The Commonwealth Medical College
NRMP Board of Directors ... i
About the NRMP ... v
Figure 1. Applicants and 1st Year Positions in The Match, 1952-2013 ... v
Glossary ... vi
Introduction ... 1
Table 1. Match Summary, 2013 ... 4
Table 2. Matches by Specialty and Applicant Type, 2013 ... 8
Table 3. Positions Offered in the Matching Program, 2009-2013 ... 12
Figure 2. Number of Active Applicants and Percent Matched to PGY-1 Positions, 2009-2013 ... 14
Table 4. Applicants in the Matching Program, 2009-2013 ... 15
Figure 3. Positions per All Active and Active U.S. Senior Applicant, 1976-2013 ... 16
Table 5. Number of PGY-1 Positions per Active Applicant, 1976-2013 ... 17
Figure 4. PGY-1 Match Rates by Applicant Type, 1982-2013 ... 18
Table 6. PGY-1 Match Rates, 1982-2013 ... 19
Table 7. Positions Offered and Number Filled by U.S. Seniors and All Applicants, 2009-2013 ... 22
Figure 5. Number of Positions Offered and Filled for Selected Specialties, 2013 ... 25
Table 8. Positions Offered and Percent Filled by U.S. Seniors and All Applicants, 2009-2013 ... 26
Table 9. All Applicants Matched to PGY-1 Positions by Specialty, 2009-2013 ... 29
Table 10. U.S. Seniors Matched to PGY-1 Positions by Specialty, 2009-2013 ... 30
Table 11. Osteopathic Graduates Matched to PGY-1 Positions by Specialty, 2009-2013 ... 31
Table 12. Foreign-Trained Physicians Matched to PGY-1 Positions by Specialty, 2009-2013 ... 32
Table 13. Applicant Choices by Specialty, 2013 ... 35
Table 14. Match Results for U.S. Seniors and Independent Applicants Who
Ranked Each Specialty as Their Only Choice, 2013 ... 36
Figure 6. Percentages of Unmatched U.S. Seniors and Independent Applicants Who
Ranked Each Specialty as Their Only Choice, 2013 ... 37
Table 15. Matches from U.S. Seniors' and Independent Applicants' Rank Order Lists, 1997-2013 ... 38
Figure 7. Percent of Matches by Choice and Type of Applicant, 2013 ... 39
Table 16. Number of Couples in The Match by Match Outcome, 1987-2013 ... 41
Figure 8. Number of Couples in The Match by Match Outcome, 1987-2013 ... 41
Table 17. Average Number of Ranked Applicants Needed to Fill Each Position by Specialty, 2009-2013 ... 43
Table 18. Participating Programs and Positions Filled in SOAP, 2012-2013 ... 46
Table 19. SOAP Applicants Accepting Positions by Type, 2012-2013 ... 47
Figure 9. Offers Extended in SOAP, 2012-2013 ... 47
NRMP Program Results 2013 Main Residency Match ... 49
About the
NRMP
Total Applicants Total PGY-1 Positions 0 5,000 10,000 15,000 20,000 25,000 30,000 35,000 40,000 45,000 1952 1960 1970 1980 1990 2000 2010Figure 1
Applicants and 1st Year Positions in The Match, 1952 - 2013
The National Resident Matching Program
(
NRMP) is a
private, not-for-profit corporation established in 1952 to
optimize the rank-ordered choices of applicants and
program directors. The NRMP is not an application
processing service; rather, it provides an impartial venue
for matching applicants' and programs' preferences for
each other consistently.
The first Main Residency Match
®
("The Match") was
conducted in 1952 when 10,400 internship positions were
available for 6,000 U.S. graduating seniors. By 1973,
there were 19,000 positions for just over 10,000 U.S.
graduating seniors. Following the demise of internships
in 1975, the number of first-year post-graduate (PGY-1)
positions dropped to 15,700. The number of PGY-1
positions offered gradually increased through 1994 and
then began to decline slowly until 1998. This year saw a
record-high 26,392 PGY-1 positions offered (Figure 1),
marking the eleventh consecutive annual increase in such
positions.
The trend in the total number of applicants since 1952 is
more dramatic, starting with 6,000 in 1952 and rising to a
high of 36,056 in 1999. After a decline of 5,052
applicants from 1999 to 2003, the number of applicants
has increased each year since the 2004 Match. Applicants
registered for the 2013 Match reached an all time high of
40,335, an increase of 1,958 applicants over 2012.
For more information about the NRMP, please visit:
www.nrmp.org. Additional data and reports for the Main
Residency Match and the Specialties Matching Service
®
(SMS
®
) can be found at: www.nrmp.org/data/.
Instructions on how to request NRMP data also are
provided.
Glossary
ACGME
Accreditation Council for Graduate Medical Education
Active Applicant
An active applicant is one who submits a certified rank order list of programs.
Applicant Type
The
NRMP
classifies applicants for the Main Residency Match
®
into seven applicant types:
Seniors of U.S. Allopathic Medical Schools
(U.S. Senior): A fourth-year medical student in an
LCME- accredited U.S. allopathic school of medicine. A student with a graduation date after
July 1 in the year before The Match is considered a U.S. senior. U.S. seniors are sponsored by
their medical schools.
Previous Graduates of U.S. Allopathic Medical Schools
(U.S. Grad): A graduate with a
graduation date before July 1 in the year before The Match is considered a previous U.S.
graduate and is not sponsored by the medical school.
Students/Graduates of Canadian Medical Schools
(Canadian)
Students/Graduates of Osteopathic Medical Schools
(Osteo)
Students/Graduates of Fifth Pathway Programs
(5th Pathway)
U.S. Citizen Students/Graduates of International Medical Schools
(U.S. IMG)
Non-U.S. Citizen Students/Graduates of International Medical Schools
(Non-U.S. IMG)
In some tables and figures in this report, applicant types are combined into a smaller
number of groups.
Foreign-Trained Physicians:
U.S. citizen and non-U.S. citizen students and graduates of
international medical schools.
Independent Applicants (IA)
: All applicant categories excluding U.S. allopathic seniors.
Others
: Includes previous U.S. graduates and Canadian, Osteopathic, and Fifth
Pathway applicants.
Couple
Any two applicants can register as a couple in The Match. The NRMP allows couples to form pairs
of choices on their primary rank order lists, which are considered in rank order in The Match. The
couple will match to the most preferred pair of programs on the rank order lists where each partner
has been offered a position.
NRMP
National Resident Matching Program
PGY-1
Post graduate year one
Introduction
This report summarizes data from the National Resident
Matching Program (NRMP) 2013 Main Residency Match
®
, the
largest in NRMP history when measured by the numbers of
positions offered (29,171) and filled (28,130), as well as by the
numbers of registrants (40,335) and active applicants (34,355)
who submitted certified rank order lists of programs.
The 29,171 positions offered in 2013, an all-time high, is likely
the result of a new NRMP policy that requires
Match-participating programs to register and attempt to fill all
positions in The Match ("All-In Policy”). This change resulted in
1,000 more categorical Internal Medicine positions, 297 more
Family Medicine positions, and 141 more in Pediatrics. All of
those specialties had offered significant numbers of positions
outside The Match.
A successful Match is not measured by volume alone, but also by
how well it matches the preferences of applicants and programs.
One measure of that objective is the percentage of positions
filled. Based on that criterion, the fill rate of 96.4 percent makes
the 2013 Match one of the most successful on record. A
by-product of a high fill rate is fewer positions available in the
Match Week Supplemental Offer and Acceptance Program
℠
(SOAP
℠
). In 2013, only 1,041 first-year and second-year
positions were unfilled, and just over half (533) were PGY-1
only positions in Preliminary Surgery and Preliminary Internal
Medicine. Of the available unfilled positions, 939 were placed in
SOAP and all but 61 were filled.
This year, 34,355 applicants vied for the 26,392 available
first-year and 2,779 second-year residency positions; 17,487 of
those applicants were U.S. allopathic medical school seniors. The
number of U.S. allopathic seniors was 960 more than in 2012, an
increase of 5.8 percent, and resulted from the addition of three
new medical schools, one new campus, and expanding class
sizes in existing medical schools.
Other applicants included are previous graduates of U.S.
allopathic medical schools, U.S. citizen and non-U.S. citizen
international medical school students and graduates, students and
graduates of Canadian medical schools, students and graduates of
osteopathic medical schools, and students and graduates of Fifth
Pathway programs. The total number of active applicants
increased 9.6 percent between 2012 and 2013 due in large part to
significant increases among those applicant groups. U.S. citizen
international medical school students and graduates showed the
largest increase in numbers (816) and the largest percentage
increase (19.1%) of all applicant groups with more than 100
applicants.
In 2013, the match rate for U.S. allopathic seniors was 93.7
percent, down from an all-time high of 95.1 percent in 2012.
Historically, the match rate for U.S. seniors is 92-94 percent.
Other trends of interest include:
The fill rate of 96.4 percent makes the 2013 Match one of
the most successful on record.
Of the U.S. seniors who matched, 78.8 percent matched to
one of their top three choices.
The number of active previous graduates of U.S. allopathic
medical schools increased from 1,317 in 2012 to 1,487 in
2013. Their match rate was 49.0 percent, the highest since
1999.
The number of active osteopathic students/graduates rose
again this year to 2,677, the most in NRMP history. Their
PGY-1 match rate, 75.4 percent, was the highest in thirty
years.
The number of active U.S. citizen IMGs continued to grow,
and at 5,095 was 50 percent more than in 2009. The match
rate for this group was 53.1 percent, an increase of 4
percentage points over last year.
The number of active applicants who were non-U.S. citizen
students/graduates of international medical schools increased
from 6,828 in 2012 to 7,568 this year. The match rate for this
group rose markedly from 40.6 percent in 2012 to 47.6
percent in 2013, the highest since 2006.
Couples have been able to participate together in The Match since
1984. The two partners identify themselves as a couple to the
NRMP and submit rank order lists of identical length. The
algorithm treats the two lists as a unit, matching the couple to the
highest linked program choices where both partners match. A
record 935 couples participated in the 2013 Match. Couples
continued to enjoy great success in The Match, with a match rate
of 95.2 percent.
Match results can be an indicator of career interests among
graduating medical school students. Highlights in 2013 include:
Internal Medicine (Categorical), Family Medicine,
Psychiatry (Categorical), Anesthesiology (1 and
PGY-2), and Pediatrics (Categorical) offered significantly more
positions in 2013 compared to 2012. Collectively, these
specialties accounted for 77.4 percent of the 2,399 new
positions.
3,135 U.S. seniors matched to Internal Medicine
(Categorical), an increase of 194 over last year.
1,837 U.S. seniors matched to Pediatrics (Categorical), an
increase of 105 over last year.
Family Medicine matched 1,355 U.S. seniors, 33 more than
last year. More than 95 percent of Family Medicine positions
were filled.
We hope you find the data contained in the following pages useful
as you reflect on the 2013 Match and prepare for future Matches.
Mona M. Signer, Executive Director
National Resident Matching Program
2121 K Street NW, Suite 1000
Washington, DC 20037
[email protected]
Table 1
Table 1 summarizes the 2013 Match and shows the numbers of participating programs, positions offered, and programs
unfilled. It also provides ranking and matching data for U.S. seniors and all applicants.
Using Anesthesiology PGY-1 as an example:
The first three columns (“No. of Programs,” “Positions Offered,” and “Unfilled Programs”) show that 147
programs offered 1,073 Anesthesiology PGY-1 positions and that 19 of those programs were unfilled.
The numbers of applicants for U.S. seniors and total applicants are provided in the next two columns under
“No. of Applicants.” In 2013, 1,208 U.S. seniors ranked at least one Anesthesiology program, and a total of
1,893 applicants ranked Anesthesiology.
The next two columns (under “No. of Matches”) show that 748 of the 1,073 positions offered for
Anesthesiology PGY-1 were filled by U.S. seniors and 1,029 were filled by all applicants.
The percent fill rates (calculated as positions filled divided by positions offered) can be found in the two
columns under “% Filled.” Of the 1,073 PGY-1 positions offered in Anesthesiology, 69.7 percent were filled
by U.S. seniors, and overall 95.9 percent were filled.
The “Ranked Positions” columns show that collectively U.S. seniors ranked those Anesthesiology programs
9,813 times and the total number of ranks for all applicants was 12,677.
Match Summary, 2013
Total U.S. Seniors Total U.S. Seniors Unfilled Programs % Filled No. of Matches** Total Ranked Positions U.S. Seniors Positions Offered Specialty No. of ProgramsTable 1
Total U.S. Seniors No. of Applicants* PGY- 1 Positions Anesthesiology 147 1,073 19 1,208 1,893 748 1,029 69.7 95.9 9,813 12,677 Child Neurology 85 123 19 91 196 64 102 52.0 82.9 643 973 Dermatology 22 38 1 174 243 21 37 55.3 97.4 260 384 Emergency Medicine 165 1,744 3 1,640 2,430 1,428 1,741 81.9 99.8 17,679 21,184Emergency Med-Family Med 2 4 0 17 29 3 4 75.0 100.0 18 34
Family Medicine 460 3,037 59 1,583 5,946 1,355 2,914 44.6 95.9 13,749 31,900
Family Med-Preventive Med 2 6 1 14 40 3 5 50.0 83.3 14 43
Internal Medicine (Categorical) 393 6,277 14 3,710 11,030 3,135 6,242 49.9 99.4 34,888 69,671
Medicine-Anesthesiology 2 0 0 13 14 0 0 0.0 0.0 14 15 Medicine-Dermatology 6 8 0 38 42 7 8 87.5 100.0 78 84 Medicine-Emergency Med 12 27 0 74 101 23 27 85.2 100.0 289 350 Medicine-Family Medicine 2 4 0 19 36 2 4 50.0 100.0 20 37 Medicine-Medical Genetics 3 2 1 6 10 1 1 50.0 50.0 6 11 Medicine-Neurology 2 2 1 2 4 0 1 0.0 50.0 2 4 Medicine-Pediatrics 77 366 3 391 603 312 363 85.2 99.2 3,354 3,953
Medicine-Preliminary (PGY-1 Only) 307 1,883 37 3,359 5,134 1,429 1,809 75.9 96.1 40,366 49,283
Medicine-Preventive Med 4 7 0 53 140 3 7 42.9 100.0 56 171 Medicine-Primary 56 335 2 756 2,165 200 331 59.7 98.8 2,040 3,812 Medicine-Psychiatry 10 17 1 30 61 12 16 70.6 94.1 93 141 Medical Genetics 1 1 1 0 4 0 0 0.0 0.0 0 4 Neurodevelopmental Disabilities 3 3 1 4 8 1 2 33.3 66.7 4 8 Neurological Surgery 99 204 1 241 314 190 203 93.1 99.5 3,207 3,499 Neurology 89 361 11 374 906 172 345 47.6 95.6 1,930 3,443 Nuclear Medicine 1 1 1 0 2 0 0 0.0 0.0 0 2 Obstetrics-Gynecology 249 1,259 7 1,059 1,783 944 1,248 75.0 99.1 11,275 15,057 Orthopedic Surgery 163 693 1 833 1,038 636 692 91.8 99.9 8,736 9,497 Otolaryngology 107 292 1 387 442 276 290 94.5 99.3 3,834 4,033 Pathology 152 583 15 290 949 263 562 45.1 96.4 2,507 5,574 Pediatrics (Categorical) 191 2,616 6 2,035 3,984 1,837 2,606 70.2 99.6 19,762 28,339 Pediatrics-Anesthesiology 5 8 1 24 26 7 7 87.5 87.5 51 53 Pediatrics-Emergency Med 3 7 0 15 20 6 7 85.7 100.0 31 39 Pediatrics-Medical Genetics 12 9 3 8 16 6 6 66.7 66.7 32 45 Pediatrics-P M & R 3 3 0 8 11 2 3 66.7 100.0 15 18 Pediatrics-Preliminary 44 44 6 131 201 31 37 70.5 84.1 622 778 Pediatrics-Primary 12 83 0 333 984 30 83 36.1 100.0 437 1,269 Peds/Psych/Child Psych 9 19 0 42 50 16 19 84.2 100.0 138 154
Physical Medicine & Rehab 36 103 0 219 444 52 103 50.5 100.0 715 1,226 Plastic Surgery (Integrated) 53 116 1 179 203 111 115 95.7 99.1 1,464 1,536
Preventive Medicine 1 2 1 0 0 0 0 0.0 0.0 0 0 Psychiatry (Categorical) 231 1,360 22 749 2,348 681 1,330 50.1 97.8 6,272 12,628 Psychiatry-Family Medicine 6 11 0 26 32 11 11 100.0 100.0 85 93 Psychiatry-Neurology 2 2 0 2 6 2 2 100.0 100.0 4 9 Radiation Oncology 13 23 0 114 135 17 23 73.9 100.0 205 229 Radiology-Diagnostic 55 164 9 595 820 101 150 61.6 91.5 1,681 2,152 Surgery (Categorical) 246 1,185 3 1,295 2,415 954 1,180 80.5 99.6 13,232 17,119 Surgery-Preliminary (PGY-1 Only) 293 1,278 139 1,058 2,055 454 819 35.5 64.1 2,468 5,674
Thoracic Surgery 21 26 0 52 79 22 26 84.6 100.0 344 410
Transitional (PGY-1 Only) 110 937 10 2,382 3,079 785 908 83.8 96.9 16,135 18,450
Vascular Surgery 39 46 1 49 84 37 45 80.4 97.8 591 705
4,006
Match Summary, 2013 (Continued)
Total U.S. Seniors Total U.S. Seniors Unfilled Programs % Filled No. of Matches** Total Ranked Positions U.S. Seniors Positions Offered Specialty No. of ProgramsTable 1
Total U.S. Seniors No. of Applicants* PGY- 2 Positions Anesthesiology 86 580 9 1,067 1,628 398 562 68.6 96.9 6,644 8,696 Child Neurology 27 37 8 65 122 14 26 37.8 70.3 205 313 Dermatology 109 369 6 442 574 316 362 85.6 98.1 3,288 3,697 Neurodevelopmental Disabilities 5 7 2 7 14 4 5 57.1 71.4 19 27 Neurology 73 331 7 365 817 189 320 57.1 96.7 2,261 3,602 Nuclear Medicine 4 5 2 0 9 0 3 0.0 60.0 0 16Physical Medicine & Rehab 61 294 1 242 593 152 293 51.7 99.7 1,876 3,636
Plastic Surgery 7 11 0 105 108 10 11 90.9 100.0 163 166 Preventive Medicine 2 3 2 0 7 0 1 0.0 33.3 0 7 Psychiatry 2 2 0 2 12 1 2 50.0 100.0 2 12 Psychiatry-Neurology 1 1 0 2 3 0 1 0.0 100.0 2 3 Radiation Oncology 80 160 7 170 211 134 153 83.8 95.6 1,667 1,822 Radiology-Diagnostic 158 979 30 865 1,307 724 928 74.0 94.8 10,094 12,038 615 Total PGY- 2 2,779 74 3,332 5,405 1,942 2,667 69.9 96.0 26,221 34,035 GRAND TOTAL 4,621 29,171 476 29,014 57,960 18,332 28,130 62.8 96.4 245,380 360,805 * Applicants can rank multiple specialties.
Table 2
Table 2 shows the numbers of PGY-1 and PGY-2 matches in each specialty by applicant type. There was considerable
variation in the number and proportion of each applicant group matching to each specialty. The data are described in
more detail in Tables 10-12.
For example, the largest numbers of U.S. allopathic medical school seniors (“U.S. Senior”) matched to:
Internal Medicine (Categorical) (3,135)
Pediatrics (Categorical) (1,837)
Medicine-Preliminary (PGY-1 Only) (1,429)
Emergency Medicine (1,428)
Family Medicine (1,355)
Anesthesiology PGY-1 and PGY-2 (1,146)
Surgery (Categorical) (954)
Obstetrics-Gynecology (944)
Diagnostic Radiology PGY-1 and PGY-2 (825)
Transitional (PGY-1 Only) (785)
For prior graduates of U.S. allopathic medical schools (“U.S. Grad”), the largest numbers were matched to:
Internal Medicine (Categorical) (114)
Family Medicine (103)
Anesthesiology PGY-1 and PGY-2 (89)
Psychiatry (Categorical) (83)
Surgery (Categorical) (57)
For students and graduates of osteopathic medical schools (“Osteo”), the largest numbers were matched to:
Internal Medicine (Categorical) (413)
Family Medicine (380)
Pediatrics (Categorical) (254)
Emergency Medicine (178)
Anesthesiology PGY-1 and PGY-2 (175)
Psychiatry (Categorical) (159)
Obstetrics-Gynecology (130)
Physical Medicine & Rehab PGY-1 and PGY-2 (118)
Medicine-Preliminary (PGY-1 Only) (104)
For U.S. citizen students and graduates of international medical schools (“U.S. IMG”), the largest numbers were matched to:
Internal Medicine (Categorical) (868)
Family Medicine (690)
Psychiatry (Categorical) (219)
Pediatrics (Categorical) (192)
Medicine-Preliminary (PGY-1 Only) (125)
Surgery-Preliminary (PGY-1 Only) (109)
Anesthesiology PGY-1 and PGY-2 (100)
For non-U.S. citizen students and graduates of international medical schools (“Non-U.S. IMG”), the largest numbers were
matched to:
Internal Medicine (Categorical) (1,708)
Family Medicine (385)
Pediatrics (Categorical) (290)
Surgery-Preliminary (PGY-1 Only) (213)
Psychiatry (Categorical) (186)
Neurology PGY-1 and PGY-2 (174)
Pathology (158)
Table 2
Matches by Specialty and Applicant Type, 2013
Specialty Number of Positions Non-U.S. IMG Canadian Osteo U.S. IMG 5th Pathway U.S. Grad U.S. Senior Number Filled Number Unfilled PGY- 1 Positions 44 51 54 0 1 117 58 748 1,029 1,073 Anesthesiology Child Neurology 123 102 64 7 5 0 0 5 21 21 1 1 1 0 0 1 13 21 37 38 Dermatology Emergency Medicine 1,744 1,741 1,428 44 178 1 0 57 33 3 0 0 1 0 0 0 0 3 4 4Emergency Med-Family Med
Family Medicine 3,037 2,914 1,355 103 380 1 0 690 385 123 1 0 1 0 0 1 0 3 5 6
Family Med-Preventive Med
Internal Medicine (Categorical) 6,277 6,242 3,135 114 413 4 0 868 1,708 35 0 0 0 0 0 0 0 0 0 0 Medicine-Anesthesiology Medicine-Dermatology 8 8 7 1 0 0 0 0 0 0 0 0 0 0 0 4 0 23 27 27 Medicine-Emergency Med Medicine-Family Medicine 4 4 2 0 0 0 0 2 0 0 1 0 0 0 0 0 0 1 1 2 Medicine-Medical Genetics Medicine-Neurology 2 1 0 0 1 0 0 0 0 1 3 12 16 0 0 21 2 312 363 366 Medicine-Pediatrics
Medicine-Preliminary (PGY-1 Only) 1,883 1,809 1,429 28 104 1 1 125 121 74 0 4 0 0 0 0 0 3 7 7 Medicine-Preventive Med Medicine-Primary 335 331 200 3 17 0 0 50 61 4 1 1 2 0 0 1 0 12 16 17 Medicine-Psychiatry Medical Genetics 1 0 0 0 0 0 0 0 0 1 1 1 0 0 0 0 0 1 2 3 Neurodevelopmental Disabilities Neurological Surgery 204 203 190 3 2 0 0 2 6 1 16 103 34 0 0 28 8 172 345 361 Neurology Nuclear Medicine 1 0 0 0 0 0 0 0 0 1 11 70 83 0 0 130 21 944 1,248 1,259 Obstetrics-Gynecology Orthopedic Surgery 693 692 636 34 6 0 1 9 6 1 2 6 0 0 0 1 7 276 290 292 Otolaryngology Pathology 583 562 263 45 49 1 0 46 158 21 10 290 192 0 3 254 30 1,837 2,606 2,616 Pediatrics (Categorical) Pediatrics-Anesthesiology 8 7 7 0 0 0 0 0 0 1 0 0 1 0 0 0 0 6 7 7 Pediatrics-Emergency Med Pediatrics-Medical Genetics 9 6 6 0 0 0 0 0 0 3 0 0 0 0 0 1 0 2 3 3 Pediatrics-P M & R Pediatrics-Preliminary 44 37 31 0 1 0 0 1 4 7 0 30 19 0 0 3 1 30 83 83 Pediatrics-Primary Peds/Psych/Child Psych 19 19 16 0 1 0 0 2 0 0 0 7 9 0 0 28 7 52 103 103
Physical Medicine & Rehab
Plastic Surgery (Integrated) 116 115 111 2 0 0 0 0 2 1
2 0 0 0 0 0 0 0 0 2 Preventive Medicine Psychiatry (Categorical) 1,360 1,330 681 83 159 2 0 219 186 30 0 0 0 0 0 0 0 11 11 11 Psychiatry-Family Medicine Psychiatry-Neurology 2 2 2 0 0 0 0 0 0 0 0 0 1 0 0 0 5 17 23 23 Radiation Oncology Radiology-Diagnostic 164 150 101 13 14 0 0 6 16 14 5 58 64 0 0 47 57 954 1,180 1,185 Surgery (Categorical)
Surgery-Preliminary (PGY-1 Only) 1,278 819 454 26 17 0 0 109 213 459
0 2 0 0 0 0 2 22 26 26 Thoracic Surgery
Transitional (PGY-1 Only) 937 908 785 10 33 0 2 36 42 29
1 3 1 0 0 2 2 37 45 46 Vascular Surgery Total PGY-1 26,392 25,463 16,390 729 2,019 14 4 2,706 3,601 929
Table 2
Matches by Specialty and Applicant Type, 2013 (Continued)
Specialty Number of Positions Non-U.S. IMG Canadian Osteo U.S. IMG 5th Pathway U.S. Grad U.S. Senior Number Filled Number Unfilled PGY- 2 Positions Anesthesiology 580 562 398 31 58 1 0 46 28 18 11 8 3 0 0 0 1 14 26 37 Child Neurology Dermatology 369 362 316 37 3 0 0 3 3 7 2 1 0 0 0 0 0 4 5 7 Neurodevelopmental Disabilities Neurology 331 320 189 5 27 0 0 28 71 11 2 1 1 0 0 0 1 0 3 5 Nuclear MedicinePhysical Medicine & Rehab 294 293 152 4 90 0 0 32 15 1
0 0 1 0 0 0 0 10 11 11 Plastic Surgery Preventive Medicine 3 1 0 0 0 0 0 1 0 2 0 0 0 0 0 0 1 1 2 2 Psychiatry Psychiatry-Neurology 1 1 0 0 1 0 0 0 0 0 7 1 2 0 0 2 14 134 153 160 Radiation Oncology Radiology-Diagnostic 979 928 724 37 65 0 0 50 52 51 Total PGY-2 2,779 2,667 1,942 131 246 1 0 167 180 112 GRAND TOTAL 29,171 28,130 18,332 860 2,265 15 4 2,873 3,781 1,041
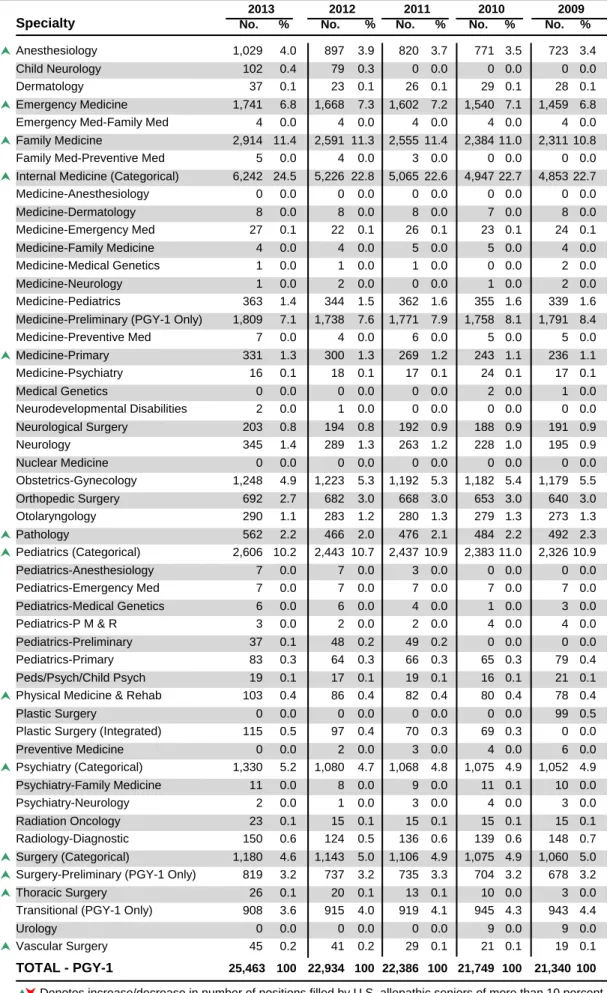
Tables 3 and 4
Table 3 shows the numbers of positions offered by specialty between 2009 and 2013. The 2013 Match offered 29,171
PGY-1 and PGY-2 positions, a combined increase of 15.8 percent over 2009. However, because specialties such as
Anesthesiology and Neurology have been converting their PGY-2 positions to PGY-1, there was only a slight overall
increase in PGY-2 positions in 2013 compared to five years ago.
The increase in the number of positions in 2013 compared to 2012 resulted mainly from expansion of larger specialties
in response to the newly-implemented "All-In" Policy. However, the numbers of positions in Psychiatry (Categorical),
Internal Medicine (Categorical), Anesthesiology (PGY-1 and PGY-2 combined), Family Medicine, and Emergency
Medicine (PGY-1 and PGY-2 combined) have risen every year over the five-year period, with mean annual growth
rates from 3.6 percent (Emergency Medicine (PGY-1 and PGY-2 combined) to 6.7 percent (Psychiatry (Categorical)).
Compared with 2012, there were 2,399 (or 9.0 percent) more positions in 2013. The main contributors to this change
were Internal Medicine (Categorical) (1,000 more positions), Family Medicine (297), Psychiatry (Categorical) (242),
Anesthesiology (PGY-1 and PGY-2) (177) and Pediatrics (Categorical) (141).
Specialties that have increased or decreased by at least 10 percent
and
10 positions in The Match between 2009 and
2013 are highlighted in the Table 3 arrows.
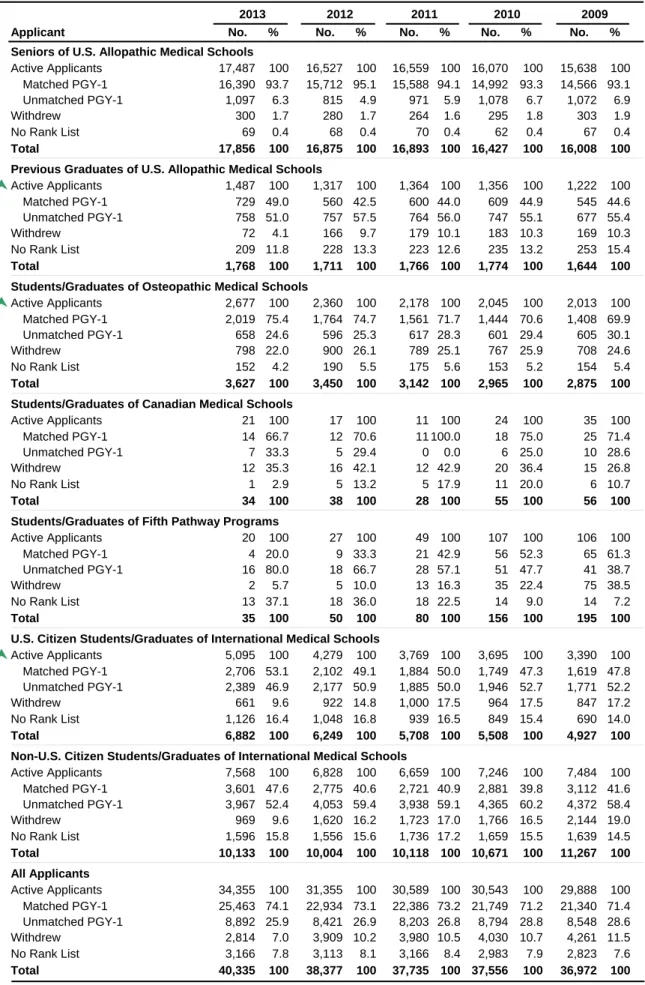
Many applicants in addition to U.S. senior medical students seek residency positions through the NRMP. Trend data
for different applicant categories are shown in Table 4 and Figure 2. The arrows in Table 4 indicate increases in the
numbers of active applicants that were greater than the overall increase of 14.9 percent between 2009 and 2013.
Table 4 shows an upward trend of total registrants and total active applicants* for the past five years. The number of
active applicants in 2013 (34,355) was 3,000 more than in 2012 (31,355), an increase of 9.6 percent.
After a small decrease in 2012, the number of active U.S. seniors in 2013 increased 5.8 percent from 2012 and 11.8
percent over 2009. Active independent applicants increased 13.8 percent from 2012 to 2013 and 18.4 percent over the
past five years, largely due to the considerable increases among U.S. IMGs (19.1 percent from 2012 to 2013 and 50.3
percent over five years) and Osteopathic students and gradutes (13.4 percent from 2012 to 2013 and 33.0 percent over
five years).
The overall 2013 PGY-1 match rate increased 1 percent over last year, and at 74.1 is the highest PGY-1 match rate
since 2006. At 93.7 percent, the PGY-1 match rate for U.S. seniors decreased 1.4 percent from an all-time high in
2012, but remained the highest among all applicant types. Independent applicants' PGY-1 match rate increased 5.1
percent in 2013 (53.8 percent) compared to 2012 (48.7 percent). The 2012 and 2013 PGY-1 match rates for
independent applicants are calculated by dividing the the number of matched independent applicants (Total matches
minus U.S. senior matches) by the number of independent applicants (Total active applicants minus U.S. senior active
applicants).
Table 3
Specialty No. % No. % No. % No. % No. %Positions Offered in the Matching Program, 2009 - 2013
2009 2013 2012 2011 2010 PGY-1 Positions Anesthesiology 1,073 4.1 919 3.8 841 3.6 797 3.5 733 3.3 Child Neurology 123 0.5 99 0.4 0 0.0 0 0.0 0 0.0 Dermatology 38 0.1 23 0.1 28 0.1 31 0.1 28 0.1 Emergency Medicine 1,744 6.6 1,668 6.9 1,607 6.9 1,556 6.8 1,472 6.6
Emergency Med-Family Med 4 0.0 4 0.0 4 0.0 4 0.0 4 0.0
Family Medicine 3,037 11.5 2,740 11.4 2,708 11.6 2,608 11.4 2,535 11.3
Family Med-Preventive Med 6 0.0 6 0.0 4 0.0 0 0.0 0 0.0
Internal Medicine (Categorical) 6,277 23.8 5,277 22.0 5,121 21.9 4,999 21.9 4,922 21.9
Medicine-Anesthesiology 0 0.0 0 0.0 0 0.0 0 0.0 0 0.0 Medicine-Dermatology 8 0.0 9 0.0 9 0.0 7 0.0 8 0.0 Medicine-Emergency Med 27 0.1 26 0.1 26 0.1 23 0.1 24 0.1 Medicine-Family Medicine 4 0.0 4 0.0 5 0.0 5 0.0 5 0.0 Medicine-Medical Genetics 2 0.0 1 0.0 1 0.0 0 0.0 2 0.0 Medicine-Neurology 2 0.0 2 0.0 0 0.0 2 0.0 3 0.0 Medicine-Pediatrics 366 1.4 362 1.5 365 1.6 359 1.6 354 1.6 Medicine-Preliminary (PGY-1 Only) 1,883 7.1 1,861 7.7 1,900 8.1 1,863 8.2 1,880 8.4
Medicine-Preventive Med 7 0.0 5 0.0 6 0.0 7 0.0 8 0.0 Medicine-Primary 335 1.3 311 1.3 286 1.2 259 1.1 247 1.1 Medicine-Psychiatry 17 0.1 20 0.1 19 0.1 26 0.1 20 0.1 Medical Genetics 1 0.0 0 0.0 0 0.0 2 0.0 3 0.0 Neurodevelopmental Disabilities 3 0.0 3 0.0 0 0.0 0 0.0 0 0.0 Neurological Surgery 204 0.8 196 0.8 195 0.8 191 0.8 191 0.9 Neurology 361 1.4 292 1.2 266 1.1 228 1.0 196 0.9 Nuclear Medicine 1 0.0 0 0.0 0 0.0 0 0.0 0 0.0 Obstetrics-Gynecology 1,259 4.8 1,240 5.2 1,205 5.1 1,187 5.2 1,185 5.3 Orthopedic Surgery 693 2.6 682 2.8 670 2.9 656 2.9 641 2.9 Otolaryngology 292 1.1 285 1.2 283 1.2 280 1.2 275 1.2 Pathology 583 2.2 521 2.2 518 2.2 503 2.2 522 2.3 Pediatrics (Categorical) 2,616 9.9 2,475 10.3 2,482 10.6 2,428 10.6 2,392 10.7 Pediatrics-Anesthesiology 8 0.0 7 0.0 3 0.0 0 0.0 0 0.0 Pediatrics-Emergency Med 7 0.0 7 0.0 7 0.0 7 0.0 7 0.0 Pediatrics-Medical Genetics 9 0.0 7 0.0 8 0.0 4 0.0 5 0.0 Pediatrics-P M & R 3 0.0 2 0.0 3 0.0 5 0.0 4 0.0 Pediatrics-Preliminary 44 0.2 55 0.2 53 0.2 0 0.0 0 0.0 Pediatrics-Primary 83 0.3 67 0.3 66 0.3 65 0.3 79 0.4 Peds/Psych/Child Psych 19 0.1 18 0.1 19 0.1 17 0.1 22 0.1 Physical Medicine & Rehab 103 0.4 86 0.4 86 0.4 87 0.4 82 0.4
Plastic Surgery 0 0.0 0 0.0 0 0.0 0 0.0 101 0.5
Plastic Surgery (Integrated) 116 0.4 101 0.4 70 0.3 69 0.3 0 0.0
Preventive Medicine 2 0.0 4 0.0 5 0.0 6 0.0 6 0.0 Psychiatry (Categorical) 1,360 5.2 1,118 4.7 1,097 4.7 1,091 4.8 1,063 4.7 Psychiatry-Family Medicine 11 0.0 10 0.0 9 0.0 13 0.1 11 0.0 Psychiatry-Neurology 2 0.0 2 0.0 4 0.0 5 0.0 3 0.0 Radiation Oncology 23 0.1 15 0.1 16 0.1 15 0.1 15 0.1 Radiology-Diagnostic 164 0.6 135 0.6 144 0.6 141 0.6 151 0.7 Surgery (Categorical) 1,185 4.5 1,146 4.8 1,108 4.7 1,077 4.7 1,065 4.7 Surgery-Preliminary (PGY-1 Only) 1,278 4.8 1,221 5.1 1,179 5.0 1,165 5.1 1,151 5.1
Thoracic Surgery 26 0.1 20 0.1 13 0.1 10 0.0 3 0.0
Transitional (PGY-1 Only) 937 3.6 941 3.9 952 4.1 980 4.3 981 4.4
Urology 0 0.0 0 0.0 0 0.0 9 0.0 9 0.0 Vascular Surgery 46 0.2 41 0.2 30 0.1 22 0.1 19 0.1 100 100 100 100 100 24,034 23,421 22,809 22,427 26,392 TOTAL - PGY1
Table 3
Specialty No. % No. % No. % No. % No. %Positions Offered in the Matching Program, 2009 - 2013 (Continued)
2009 2013 2012 2011 2010 PGY-2 Positions Anesthesiology 580 20.9 557 20.3 563 20.6 588 21.7 641 23.2 Child Neurology 37 1.3 47 1.7 0 0.0 0 0.0 0 0.0 Dermatology 369 13.3 340 12.4 344 12.6 329 12.1 310 11.2 Emergency Medicine 0 0.0 0 0.0 19 0.7 19 0.7 43 1.6 Neurodevelopmental Disabilities 7 0.3 7 0.3 0 0.0 0 0.0 0 0.0 Neurology 331 11.9 346 12.6 339 12.4 357 13.2 385 14.0 Nuclear Medicine 5 0.2 4 0.1 6 0.2 4 0.1 0 0.0
Physical Medicine & Rehab 294 10.6 281 10.3 287 10.5 280 10.3 288 10.4
Plastic Surgery 11 0.4 20 0.7 38 1.4 37 1.4 0 0.0 Preventive Medicine 3 0.1 1 0.0 1 0.0 2 0.1 3 0.1 Psychiatry 2 0.1 3 0.1 4 0.1 3 0.1 3 0.1 Psychiatry-Neurology 1 0.0 0 0.0 1 0.0 1 0.0 0 0.0 Radiation Oncology 160 5.8 156 5.7 155 5.7 142 5.2 141 5.1 Radiology-Diagnostic 979 35.2 976 35.6 980 35.8 949 35.0 944 34.2 100 100 100 100 100 2,738 2,737 2,711 2,758 2,779 TOTAL - PGY2 GRAND TOTAL 29,171 100 26,772 100 26,158 100 25,520 100 25,185 100 Denotes increase/decrease in matched applicants of more than 10 percent and 10 positions between 2009 and 2013. Neurological Surgery joined in 2009. ACGMEcreated a new PGY-1 Plastic Surgery (Integrated) specialty in 2009. Combined/coordinated Plastic Surgery progams (which are not integrated) now appear under PGY-2 positions. Many Anesthesiology and Emergency Medicine programs have converted their positions from Advanced (PGY-2) to Categorical (PGY-1) over the period, affecting the trends in those specialties.
Figure 2
Number of Active Applicants and Percent Matched to PGY-1 Positions, 2009 - 2013
All Applicants 0 7,000 14,000 21,000 28,000 35,000 2009 2010 2011 2012 2013 0% 20% 40% 60% 80% 100% Percent MatchedSeniors of U.S. Allopathic Medical Schools
15,638 16,070 16,559 16,527 17,487 0 7,000 14,000 21,000 28,000 35,000 2009 2010 2011 2012 2013 0% 20% 40% 60% 80% 100%
Students/Graduates of Osteopathic Medical Schools
2,013 2,045 2,178 2,360 2,677 0 7,000 14,000 21,000 28,000 35,000 2009 2010 2011 2012 2013 0% 20% 40% 60% 80% 100% Foreign-Trained Physicians* 10,874 10,941 10,428 11,107 12,663 0 7,000 14,000 21,000 28,000 35,000 2009 2010 2011 2012 2013 0% 20% 40% 60% 80% 100%
Previous Graduates of U.S. Allopathic Medical Schools
1,222 1,356 1,364 1,317 1,487 0 7,000 14,000 21,000 28,000 35,000 2009 2010 2011 2012 2013 0% 20% 40% 60% 80% 100%
Applicant No. % No. % No. % No. % No. %
2011 2010 2009
2012 2013
Table 4
Applicants in the Matching Program, 2009 - 2013
Seniors of U.S. Allopathic Medical Schools
Active Applicants 17,487 100 16,527 100 16,559 100 16,070 100 15,638 100 Matched PGY-1 16,390 93.7 15,712 95.1 15,588 94.1 14,992 93.3 14,566 93.1 Unmatched PGY-1 1,097 6.3 815 4.9 971 5.9 1,078 6.7 1,072 6.9 Withdrew 300 1.7 280 1.7 264 1.6 295 1.8 303 1.9 No Rank List 69 0.4 68 0.4 70 0.4 62 0.4 67 0.4 Total 17,856 100 16,875 100 16,893 100 16,427 100 16,008 100 Previous Graduates of U.S. Allopathic Medical Schools
Active Applicants
1,487 100 1,317 100 1,364 100 1,356 100 1,222 100 Matched PGY-1 729 49.0 560 42.5 600 44.0 609 44.9 545 44.6 Unmatched PGY-1 758 51.0 757 57.5 764 56.0 747 55.1 677 55.4 Withdrew 72 4.1 166 9.7 179 10.1 183 10.3 169 10.3 No Rank List 209 11.8 228 13.3 223 12.6 235 13.2 253 15.4 Total 1,768 100 1,711 100 1,766 100 1,774 100 1,644 100 Students/Graduates of Osteopathic Medical SchoolsActive Applicants
2,677 100 2,360 100 2,178 100 2,045 100 2,013 100 Matched PGY-1 2,019 75.4 1,764 74.7 1,561 71.7 1,444 70.6 1,408 69.9 Unmatched PGY-1 658 24.6 596 25.3 617 28.3 601 29.4 605 30.1 Withdrew 798 22.0 900 26.1 789 25.1 767 25.9 708 24.6 No Rank List 152 4.2 190 5.5 175 5.6 153 5.2 154 5.4 Total 3,627 100 3,450 100 3,142 100 2,965 100 2,875 100 Students/Graduates of Canadian Medical SchoolsActive Applicants 21 100 17 100 11 100 24 100 35 100 Matched PGY-1 14 66.7 12 70.6 11100.0 18 75.0 25 71.4 Unmatched PGY-1 7 33.3 5 29.4 0 0.0 6 25.0 10 28.6 Withdrew 12 35.3 16 42.1 12 42.9 20 36.4 15 26.8 No Rank List 1 2.9 5 13.2 5 17.9 11 20.0 6 10.7 Total 34 100 38 100 28 100 55 100 56 100
Students/Graduates of Fifth Pathway Programs
Active Applicants 20 100 27 100 49 100 107 100 106 100 Matched PGY-1 4 20.0 9 33.3 21 42.9 56 52.3 65 61.3 Unmatched PGY-1 16 80.0 18 66.7 28 57.1 51 47.7 41 38.7 Withdrew 2 5.7 5 10.0 13 16.3 35 22.4 75 38.5 No Rank List 13 37.1 18 36.0 18 22.5 14 9.0 14 7.2 Total 35 100 50 100 80 100 156 100 195 100
U.S. Citizen Students/Graduates of International Medical Schools Active Applicants
5,095 100 4,279 100 3,769 100 3,695 100 3,390 100 Matched PGY-1 2,706 53.1 2,102 49.1 1,884 50.0 1,749 47.3 1,619 47.8 Unmatched PGY-1 2,389 46.9 2,177 50.9 1,885 50.0 1,946 52.7 1,771 52.2 Withdrew 661 9.6 922 14.8 1,000 17.5 964 17.5 847 17.2 No Rank List 1,126 16.4 1,048 16.8 939 16.5 849 15.4 690 14.0 Total 6,882 100 6,249 100 5,708 100 5,508 100 4,927 100 Non-U.S. Citizen Students/Graduates of International Medical SchoolsActive Applicants 7,568 100 6,828 100 6,659 100 7,246 100 7,484 100 Matched PGY-1 3,601 47.6 2,775 40.6 2,721 40.9 2,881 39.8 3,112 41.6 Unmatched PGY-1 3,967 52.4 4,053 59.4 3,938 59.1 4,365 60.2 4,372 58.4 Withdrew 969 9.6 1,620 16.2 1,723 17.0 1,766 16.5 2,144 19.0 No Rank List 1,596 15.8 1,556 15.6 1,736 17.2 1,659 15.5 1,639 14.5 Total 10,133 100 10,004 100 10,118 100 10,671 100 11,267 100 All Applicants Active Applicants 34,355 100 31,355 100 30,589 100 30,543 100 29,888 100 Matched PGY-1 25,463 74.1 22,934 73.1 22,386 73.2 21,749 71.2 21,340 71.4 Unmatched PGY-1 8,892 25.9 8,421 26.9 8,203 26.8 8,794 28.8 8,548 28.6 Withdrew 2,814 7.0 3,909 10.2 3,980 10.5 4,030 10.7 4,261 11.5 No Rank List 3,166 7.8 3,113 8.1 3,166 8.4 2,983 7.9 2,823 7.6 Total 40,335 100 38,377 100 37,735 100 37,556 100 36,972 100 Denotes that the percentage increase in active applicants for this group was greater than the overall increase of 14.9% for all active applicants between 2009 and 2013.
Note: Match rates are based on all active applicants regardless of their ranking behavior. Therefore, applicants who matched to PGY-1 positions are counted as matched even if they ranked and did not match to a PGY-2 position. Applicants who ranked only PGY-2 programs are
Table 5
U.S. Seniors
Total Active
Applicants
0.00
1.00
2.00
1976
1980
1985
1990
1995
2000
2005
2010
Figure 3
Positions per All Active and Active U.S. Senior Applicant, 1976 - 2013
Table 5 shows the ratios of PGY-1 positions to active applicants from 1976 through 2013. The same data are shown
graphically in Figure 3. The red line in Figure 3 represents the point at which there are equal numbers of applicants and
positions; above the red line represents more positions than applicants, below the line more applicants than positions.
Active applicants are defined as those who submitted and certified rank order lists.
In 2013, the ratio of PGY-1 positions per active U.S. senior was 1.51, the highest since 1976 and higher than the
overall average of 1.40 between 1976 and 2013. Historically, the ratio declined from 2.0 to 1 in 1972 (not
shown) to a low of 1.25 to 1 in 1984 and 1985.
The ratio of PGY-1 positions to total applicants (rather than only U.S. seniors) roughly followed the trend of the
U.S. seniors because more than half of all applicants were U.S. seniors. In 2013, for the third consecutive year,
the ratio was 0.77, which was below the overall average of 0.91 between 1976 and 2013.
Positions Per Active Applicant Active Total Positions Per U.S. Senior Active U.S. Seniors Number of Positions
Number of PGY-1 Positions per Active Applicant, 1976 - 2013
Year
Table 5
1976 16,112 11,735 1.37 16,728 0.96 1977 16,574 11,898 1.39 15,854 1.05 1978 17,219 12,666 1.36 15,354 1.12 1979 17,824 13,036 1.37 14,985 1.19 1980 18,055 13,322 1.36 15,129 1.19 1981 18,331 13,705 1.34 16,104 1.14 1982 18,300 14,144 1.29 18,410 0.99 1983 17,952 13,969 1.29 20,044 0.90 1984 18,457 14,741 1.25 22,052 0.84 1985 18,535 14,849 1.25 22,386 0.83 1986 18,770 14,737 1.27 21,357 0.88 1987 19,047 14,466 1.32 20,054 0.95 1988 19,513 14,499 1.35 19,808 0.99 1989 19,955 14,117 1.41 19,207 1.04 1990 20,101 13,908 1.45 19,004 1.06 1991 20,192 13,943 1.45 18,450 1.09 1992 20,394 14,030 1.45 19,519 1.04 1993 20,598 14,094 1.46 20,916 0.98 1994 20,772 14,207 1.46 22,352 0.93 1995 20,751 14,621 1.42 22,936 0.90 1996 20,563 14,539 1.41 24,718 0.83 1997 20,209 14,614 1.38 26,323 0.77 1998 20,299 14,610 1.39 26,360 0.77 1999 20,453 14,607 1.40 26,462 0.77 2000 20,598 14,358 1.43 25,056 0.82 2001 20,642 14,455 1.43 23,981 0.86 2002 20,602 14,336 1.44 23,459 0.88 2003 20,908 14,332 1.46 23,965 0.87 2004 21,192 14,609 1.45 25,246 0.84 2005 21,454 14,719 1.46 25,348 0.85 2006 21,659 15,008 1.44 26,715 0.81 2007 21,845 15,206 1.44 27,944 0.78 2008 22,240 15,242 1.46 28,737 0.77 2009 22,427 15,638 1.43 29,888 0.75 2010 22,809 16,070 1.42 30,543 0.75 2011 23,421 16,559 1.41 30,589 0.77 2012 24,034 16,527 1.45 31,355 0.77 2013 26,392 17,487 1.51 34,355 0.77Table 6
Percent Matched
U.S. Seniors Others U.S. IMGs Non-U.S. IMGs0%
25%
50%
75%
100%
1982 1985 1990 1995 2000 2005 2010PGY-1 Match Rates by Applicant Type, 1982 - 2013
Figure 4
Table 6 displays the match rates to PGY-1 positions for U.S. allopathic seniors, U.S. citizens trained in international
medical schools (U.S. IMGs), non-U.S. citizens trained in international medical schools (Non-U.S. IMGs), and other
applicants (Canadian medical school students/graduates, osteopathic medical school students/graduates, Fifth Pathway
applicants, and U.S. physicians who are prior-year graduates of U.S. allopathic medical schools). The data are shown
graphically in Figure 4. Match rate is defined in Table 6 and Figure 4 as the percentage of active participants who
matched to PGY-1 positions.
93.7 percent of U.S. allopathic seniors were matched to PGY-1 positions in 2013, well within the historical
92-95 percent matched rate .
53.1 percent of U.S. citizens trained in international medical schools were matched, up from 49.1 percent in
2012. This year marked the highest match rate since 2005.
The match rate for non-U.S. citizens trained in international medical schools increased dramatically from 40.6
percent in 2012 to 47.6 percent in 2013.
Percent Matched Non-U.S.
IMGs
U.S. IMGs Others
U.S. Seniors Total Active Applicants Number of Positions
PGY-1 Match Rates, 1982 - 2013
Year
Table 6
All Applicants 1982 18,300 18,410 92.1 56.8 31.4 68.6 81.2 1983 17,952 20,044 92.2 49.3 26.2 65.2 75.9 1984 18,457 22,052 92.2 44.4 21.9 60.5 73.1 1985 18,535 22,386 92.6 39.7 21.6 60.7 72.8 1986 18,770 21,357 93.3 38.6 24.0 60.3 75.6 1987 19,047 20,054 94.0 43.0 34.2 58.9 79.8 1988 19,513 19,808 93.1 49.0 44.1 57.3 81.4 1989 19,955 19,207 93.6 53.3 54.2 56.7 83.4 1990 20,101 19,004 93.3 55.6 59.7 56.0 83.7 1991 20,192 18,450 93.1 58.6 63.4 54.5 84.9 1992 20,394 19,519 92.4 58.7 63.0 55.5 83.3 1993 20,598 20,916 92.4 57.2 58.4 53.0 92.1 1994 20,772 22,352 93.0 47.5 50.9 54.7 77.9 1995 20,751 22,936 92.7 49.8 50.5 56.1 77.9 1996 20,563 24,718 92.1 48.5 40.9 59.0 72.8 1997 20,209 26,323 92.7 43.5 34.5 54.8 69.0 1998 20,299 26,360 93.5 45.5 31.4 60.8 69.0 1999 20,453 26,462 93.8 47.5 32.2 61.3 69.5 2000 20,598 25,056 93.9 51.4 38.5 61.3 73.4 2001 20,642 23,981 93.7 52.4 44.8 64.0 76.5 2002 20,602 23,459 94.1 53.8 51.3 60.3 78.6 2003 20,908 23,965 93.2 54.6 55.7 59.5 78.5 2004 21,192 25,246 92.9 55.4 52.4 58.7 76.8 2005 21,454 25,348 93.7 54.7 55.6 58.0 78.0 2006 21,659 26,715 93.7 50.6 48.9 57.6 75.1 2007 21,845 27,944 93.4 50.0 45.5 58.5 73.4 2008 22,240 28,737 94.2 51.9 42.4 60.5 72.9 2009 22,427 29,888 93.1 47.8 41.6 60.5 71.4 2010 22,809 30,543 93.3 47.3 39.8 60.2 71.2 2011 23,421 30,589 94.1 50.0 40.9 60.9 73.2 2012 24,034 31,355 95.1 49.1 40.6 63.0 73.1 2013 26,392 34,355 93.7 53.1 47.6 65.8 74.1Tables 7 and 8
Table 7 displays the numbers of positions offered by specialty, as well as the numbers filled by U.S. seniors and by an
aggregate of all other applicants from 2009 through 2013. The data in Table 7 are shown graphically in Figure 5 for
specialties that offered at least 100 positions. Table 8 displays the same information in percentages.
In 2013, 28,130 matches were made to PGY-1 and PGY-2 positions, an increase of 2,604 (or 10.2%) over
2012.
The position fill rate for all programs increased 1.1 percent to 96.4 percent, the highest fill rate in NRMP
history.
Internal Medicine (Categorical) offered 6,277 positions, of which 49.9 percent were filled by U.S. seniors
(the lowest fill rate in the last 30 years) and 99.4 percent by all applicants (the highest in the last 30 years).
The Psychiatry (Categorical) fill rate for all applicants increased 1.2 percentage points from 96.6 percent in
2012 to 97.8 percent in 2013, but the percentage of positions filled by U.S. seniors declined from 55.1
percent in 2012 to 50.1 percent in 2013, the lowest fill rate by U.S. seniors since 1998 (46.7 percent).
Other specialties of note are:
Specialties and specialty tracks with at least 10 positions in The Match and 100 percent fill rates:
Medicine-Emergency Medicine
Pediatrics-Primary
Peds/Psych/Child Psych
Physical Medicine and Rehabilitation (PGY-1)
Plastic Surgery (PGY-2)
Psychiatry-Family Medicine
Radiation Oncology (PGY-1)
Thoracic Surgery
Specialties with at least 10 positions in The Match and filled more than 90 percent by U.S. seniors:
Psychiatry-Family Medicine: 100 percent
Plastic Surgery (Integrated) (PGY-1): 95.7 percent
Otolaryngology: 94.5 percent
Neurological Surgery: 93.1 percent
Orthopedic Surgery: 91.8 percent
Plastic Surgery (PGY-2): 90.9 percent
Top five specialties with at least 10 positions in The Match and filled with significant numbers of
independent applicants (calculated from table):
Pediatrics-Primary: 63.9 percent
Family Medicine: 51.3 percent
Pathology: 51.3 percent
Internal Medicine (Categorical): 49.5 percent
Specialty
Offered #U.S.
Positions Offered and Number Filled by U.S. Seniors and All Applicants, 2009 - 2013
#Tot
Filled Filled Offered #U.S. #Tot
Filled #Tot #U.S. Offered
Filled Offered #U.S. #Tot
Filled Offered #U.S. #Tot
2013 2012 2011 2010 2009
Table 7
PGY-1 Positions 733 797 841 919 1,073 Anesthesiology 748 1,029 725 897 671 820 626 771 612 723 Child Neurology 123 64 102 99 58 79 0 0 0 0 0 0 0 0 0 28 31 28 23 38 Dermatology 21 37 22 23 26 26 23 29 27 28 Emergency Medicine 1,744 1,428 1,741 1,668 1,335 1,668 1,607 1,268 1,602 1,556 1,182 1,540 1,472 1,146 1,459 4 4 4 4 4Emergency Med-Family Med 3 4 2 4 1 4 1 4 3 4
Family Medicine 3,037 1,355 2,914 2,740 1,322 2,591 2,708 1,301 2,555 2,608 1,169 2,384 2,535 1,071 2,311 0 0 4 6 6
Family Med-Preventive Med 3 5 1 4 3 3 0 0 0 0
Internal Medicine (Categorical) 6,277 3,135 6,242 5,277 2,941 5,226 5,121 2,940 5,065 4,999 2,722 4,947 4,922 2,632 4,853 0 0 0 0 0 Medicine-Anesthesiology 0 0 0 0 0 0 0 0 0 0 Medicine-Dermatology 8 7 8 9 8 8 9 8 8 7 7 7 8 7 8 24 23 26 26 27 Medicine-Emergency Med 23 27 17 22 22 26 20 23 19 24 Medicine-Family Medicine 4 2 4 4 2 4 5 3 5 5 4 5 5 3 4 2 0 1 1 2 Medicine-Medical Genetics 1 1 1 1 1 1 0 0 2 2 Medicine-Neurology 2 0 1 2 2 2 0 0 0 2 1 1 3 2 2 354 359 365 362 366 Medicine-Pediatrics 312 363 276 344 309 362 299 355 241 339
Medicine-Preliminary (PGY-1 Only)1,883 1,429 1,809 1,861 1,427 1,738 1,900 1,503 1,771 1,863 1,493 1,758 1,880 1,504 1,791 8 7 6 5 7 Medicine-Preventive Med 3 7 2 4 2 6 2 5 1 5 Medicine-Primary 335 200 331 311 186 300 286 166 269 259 156 243 247 155 236 20 26 19 20 17 Medicine-Psychiatry 12 16 12 18 9 17 18 24 8 17 Medical Genetics 1 0 0 0 0 0 0 0 0 2 2 2 3 1 1 0 0 0 3 3 Neurodevelopmental Disabilities 1 2 0 1 0 0 0 0 0 0 Neurological Surgery 204 190 203 196 170 194 195 175 192 191 173 188 191 172 191 196 228 266 292 361 Neurology 172 345 173 289 159 263 113 228 123 195 Nuclear Medicine 1 0 0 0 0 0 0 0 0 0 0 0 0 0 0 1,185 1,187 1,205 1,240 1,259 Obstetrics-Gynecology 944 1,248 913 1,223 893 1,192 915 1,182 879 1,179 Orthopedic Surgery 693 636 692 682 641 682 670 621 668 656 598 653 641 587 640 275 280 283 285 292 Otolaryngology 276 290 277 283 269 280 259 279 263 273 Pathology 583 263 562 521 262 466 518 269 476 503 327 484 522 321 492 2,392 2,428 2,482 2,475 2,616 Pediatrics (Categorical) 1,837 2,606 1,732 2,443 1,768 2,437 1,711 2,383 1,682 2,326 Pediatrics-Anesthesiology 8 7 7 7 7 7 3 3 3 0 0 0 0 0 0 7 7 7 7 7 Pediatrics-Emergency Med 6 7 6 7 7 7 5 7 4 7 Pediatrics-Medical Genetics 9 6 6 7 4 6 8 4 4 4 1 1 5 2 3 4 5 3 2 3 Pediatrics-P M & R 2 3 2 2 2 2 4 4 4 4 Pediatrics-Preliminary 44 31 37 55 43 48 53 41 49 0 0 0 0 0 0 79 65 66 67 83 Pediatrics-Primary 30 83 27 64 28 66 30 65 46 79 Peds/Psych/Child Psych 19 16 19 18 13 17 19 12 19 17 15 16 22 18 21 82 87 86 86 103
Physical Medicine & Rehab 52 103 51 86 42 82 45 80 41 78
Plastic Surgery 0 0 0 0 0 0 0 0 0 0 0 0 101 87 99 0 69 70 101 116
Plastic Surgery (Integrated) 111 115 87 97 65 70 61 69 0 0
Preventive Medicine 2 0 0 4 1 2 5 1 3 6 1 4 6 2 6 1,063 1,091 1,097 1,118 1,360 Psychiatry (Categorical) 681 1,330 616 1,080 640 1,068 670 1,075 656 1,052 Psychiatry-Family Medicine 11 11 11 10 8 8 9 9 9 13 10 11 11 6 10 3 5 4 2 2 Psychiatry-Neurology 2 2 1 1 2 3 2 4 2 3 Radiation Oncology 23 17 23 15 15 15 16 15 15 15 14 15 15 15 15 151 141 144 135 164 Radiology-Diagnostic 101 150 90 124 115 136 120 139 132 148 Surgery (Categorical) 1,185 954 1,180 1,146 914 1,143 1,108 897 1,106 1,077 895 1,075 1,065 824 1,060 1,151 1,165 1,179 1,221 1,278
Surgery-Preliminary (PGY-1 Only) 454 819 478 737 466 735 430 704 401 678
Thoracic Surgery 26 22 26 20 19 20 13 12 13 10 8 10 3 3 3 981 980 952 941 937
Transitional (PGY-1 Only) 785 908 785 915 811 919 832 945 840 943
Urology 0 0 0 0 0 0 0 0 0 9 9 9 9 7 9 19 22 30 41 46 Vascular Surgery 37 45 38 41 29 29 19 21 15 19 22,427 22,809 TOTAL - PGY-1 26,392 16,390 25,463 24,034 15,712 22,934 23,42115,588 22,386 14,992 21,749 14,566 21,340
Specialty
Offered #U.S.
Positions Offered and Number Filled by U.S. Seniors and All Applicants, 2009 - 2013 (Continued)
#Tot
Filled Filled Offered #U.S. #Tot
Filled #Tot #U.S. Offered
Filled Offered #U.S. #Tot
Filled Offered #U.S. #Tot
2013 2012 2011 2010 2009
Table 7
PGY-2 Positions Anesthesiology 580 398 562 557 397 540 563 431 533 588 420 558 641 498 625 0 0 0 47 37 Child Neurology 14 26 23 35 0 0 0 0 0 0 Dermatology 369 316 362 340 288 329 344 283 339 329 270 325 310 262 309 43 19 19 0 0 Emergency Medicine 0 0 0 0 9 19 6 19 25 43 Neurodevelopmental Disabilities 7 4 5 7 6 6 0 0 0 0 0 0 0 0 0 385 357 339 346 331 Neurology 189 320 181 326 206 325 201 335 192 375 Nuclear Medicine 5 0 3 4 0 3 6 1 1 4 0 1 0 0 0 288 280 287 281 294Physical Medicine & Rehab 152 293 142 277 138 278 130 271 129 279
Plastic Surgery 11 10 11 20 19 20 38 34 38 37 33 37 0 0 0 3 2 1 1 3 Preventive Medicine 0 1 0 0 0 0 0 0 0 0 Psychiatry 2 1 2 3 0 0 4 3 3 3 2 2 3 2 2 0 1 1 0 1 Psychiatry-Neurology 0 1 0 0 1 1 1 1 0 0 Radiation Oncology 160 134 153 156 153 155 155 140 150 142 123 135 141 121 129 944 949 980 976 979 Radiology-Diagnostic 724 928 741 901 773 947 799 945 816 937 2,758 2,711 TOTAL - PGY-2 2,779 1,942 2,667 2,738 1,950 2,592 2,737 2,019 2,634 1,985 2,629 2,045 2,699 GRAND TOTAL 29,171 18,332 28,130 26,772 17,662 25,526 26,15817,607 25,020 25,52016,977 24,378 25,185 16,611 24,039
Denotes increase/decrease in number of positions filled by U.S. allopathic seniors of more than 10 percent and 10 positions between 2009 and 2013. Neurological Surgery joined in 2009. ACGMEcreated a new PGY-1 Plastic Surgery (Integrated) specialty in 2009. Combined/coordinated Plastic Surgery progams (which are not integrated) now appear under PGY-2 positions. Many Anesthesiology and Emergency Medicine programs have converted their positions from Advanced (PGY-2) to Categorical (PGY-1) over the period, affecting the trends in those specialties.
Figure 5
Number of Positions Offered and Filled for Selected Specialties,* 2013
* Specialties offering at least 100 positions.
127
160
183
204
292
335
366
397
407
583
692
693
937
1,143
1,185
1,259
1,278
1,362
1,653
1,744
1,883
2,616
3,037
6,277
126
128
176
203
290
331
363
396
399
562
665
692
908
1,078
1,180
1,248
819
1,332
1,591
1,741
1,809
2,606
2,914
6,242
121
78
151
190
276
200
312
204
337
263
361
636
785
825
954
944
454
682
1,146
1,428
1,429
1,837
1,355
3,135
0
2,000
4,000
6,000
8,000
Plastic Surgery (PGY
‐
1 and PGY
‐
2)
Child Neurology (PGY
‐
1 and PGY
‐
2)
Radiation Oncology (PGY
‐
1 and PGY
‐
2)
Neurological Surgery
Otolaryngology
Medicine
‐
Primary
Medicine
‐
Pediatrics
Physical Medicine & Rehab (PGY
‐
1 and PGY
‐
2)
Dermatology (PGY
‐
1 and PGY
‐
2)
Pathology
Neurology (PGY
‐
1 and PGY
‐
2)
Orthopedic Surgery
Transitional (PGY
‐
1 Only)
Radiology
‐
Diagnostic (PGY
‐
1 and PGY
‐
2)
Surgery (Categorical)
Obstetrics
‐
Gynecology
Surgery
‐
Preliminary (PGY
‐
1 Only)
Psychiatry (PGY
‐
1 and PGY
‐
2)
Anesthesiology (PGY
‐
1 and PGY
‐
2)
Emergency Medicine
Medicine
‐
Preliminary (PGY
‐
1 Only)
Pediatrics (Categorical)
Family Medicine
Internal Medicine (Categorical)
Number Filled by U.S. Allopathic Seniors Total Number Filled
%Tot %U.S. Offered Filled %Tot %U.S. Offered Filled Offered %U.S. %Tot
Filled %Tot %U.S. Offered Filled Filled %Tot
Positions Offered and Percent Filled by U.S. Seniors and All Applicants, 2009 - 2013
%U.S. Offered Specialty
Table 8
2013 2012 2011 2010 2009 PGY-1 Positions 733 797 841 919 1,073 Anesthesiology 69.7 95.9 78.9 97.6 79.8 97.5 78.5 96.7 83.5 98.6 Child Neurology 123 52.0 82.9 99 58.6 79.8 0 0.0 0.0 0 0.0 0.0 0 0.0 0.0 28 31 28 23 38 Dermatology 55.3 97.4 95.7 100.0 92.9 92.9 74.2 93.5 96.4 100.0 Emergency Medicine 1,744 81.9 99.8 1,668 80.0 100.0 1,607 78.9 99.7 1,556 76.0 99.0 1,472 77.9 99.1 4 4 4 4 4Emergency Med-Family Med 75.0 100.0 50.0 100.0 25.0 100.0 25.0 100.0 75.0 100.0 Family Medicine 3,037 44.6 95.9 2,740 48.2 94.6 2,708 48.0 94.4 2,608 44.8 91.4 2,535 42.2 91.2 0 0 4 6 6
Family Med-Preventive Med 50.0 83.3 16.7 66.7 75.0 75.0 0.0 0.0 0.0 0.0
Internal Medicine (Categorical) 6,277 49.9 99.4 5,277 55.7 99.0 5,121 57.4 98.9 4,999 54.5 99.0 4,922 53.5 98.6 0 0 0 0 0 Medicine-Anesthesiology 0.0 0.0 0.0 0.0 0.0 0.0 0.0 0.0 0.0 0.0 Medicine-Dermatology 8 87.5 100.0 9 88.9 88.9 9 88.9 88.9 7 100.0 100.0 8 87.5 100.0 24 23 26 26 27 Medicine-Emergency Med 85.2 100.0 65.4 84.6 84.6 100.0 87.0 100.0 79.2 100.0 Medicine-Family Medicine 4 50.0 100.0 4 50.0 100.0 5 60.0 100.0 5 80.0 100.0 5 60.0 80.0 2 0 1 1 2 Medicine-Medical Genetics 50.0 50.0 100.0 100.0 100.0 100.0 0.0 0.0 100.0 100.0 Medicine-Neurology 2 0.0 50.0 2 100.0 100.0 0 0.0 0.0 2 50.0 50.0 3 66.7 66.7 354 359 365 362 366 Medicine-Pediatrics 85.2 99.2 76.2 95.0 84.7 99.2 83.3 98.9 68.1 95.8
Medicine-Preliminary (PGY-1 Only)1,883 75.9 96.1 1,861 76.7 93.4 1,900 79.1 93.2 1,863 80.1 94.4 1,880 80.0 95.3 8 7 6 5 7 Medicine-Preventive Med 42.9 100.0 40.0 80.0 33.3 100.0 28.6 71.4 12.5 62.5 Medicine-Primary 335 59.7 98.8 311 59.8 96.5 286 58.0 94.1 259 60.2 93.8 247 62.8 95.5 20 26 19 20 17 Medicine-Psychiatry 70.6 94.1 60.0 90.0 47.4 89.5 69.2 92.3 40.0 85.0 Medical Genetics 1 0.0 0.0 0 0.0 0.0 0 0.0 0.0 2 100.0 100.0 3 33.3 33.3 0 0 0 3 3 Neurodevelopmental Disabilities 33.3 66.7 0.0 33.3 0.0 0.0 0.0 0.0 0.0 0.0 Neurological Surgery 204 93.1 99.5 196 86.7 99.0 195 89.7 98.5 191 90.6 98.4 191 90.1 100.0 196 228 266 292 361 Neurology 47.6 95.6 59.2 99.0 59.8 98.9 49.6 100.0 62.8 99.5 Nuclear Medicine 1 0.0 0.0 0 0.0 0.0 0 0.0 0.0 0 0.0 0.0 0 0.0 0.0 1,185 1,187 1,205 1,240 1,259 Obstetrics-Gynecology 75.0 99.1 73.6 98.6 74.1 98.9 77.1 99.6 74.2 99.5 Orthopedic Surgery 693 91.8 99.9 682 94.0 100.0 670 92.7 99.7 656 91.2 99.5 641 91.6 99.8 275 280 283 285 292 Otolaryngology 94.5 99.3 97.2 99.3 95.1 98.9 92.5 99.6 95.6 99.3 Pathology 583 45.1 96.4 521 50.3 89.4 518 51.9 91.9 503 65.0 96.2 522 61.5 94.3 2,392 2,428 2,482 2,475 2,616 Pediatrics (Categorical) 70.2 99.6 70.0 98.7 71.2 98.2 70.5 98.1 70.3 97.2 Pediatrics-Anesthesiology 8 87.5 87.5 7 100.0 100.0 3 100.0 100.0 0 0.0 0.0 0 0.0 0.0 7 7 7 7 7 Pediatrics-Emergency Med 85.7 100.0 85.7 100.0 100.0 100.0 71.4 100.0 57.1 100.0 Pediatrics-Medical Genetics 9 66.7 66.7 7 57.1 85.7 8 50.0 50.0 4 25.0 25.0 5 40.0 60.0 4 5 3 2 3 Pediatrics-P M & R 66.7 100.0 100.0 100.0 66.7 66.7 80.0 80.0 100.0 100.0 Pediatrics-Preliminary 44 70.5 84.1 55 78.2 87.3 53 77.4 92.5 0 0.0 0.0 0 0.0 0.0 79 65 66 67 83 Pediatrics-Primary 36.1 100.0 40.3 95.5 42.4 100.0 46.2 100.0 58.2 100.0 Peds/Psych/Child Psych 19 84.2 100.0 18 72.2 94.4 19 63.2 100.0 17 88.2 94.1 22 81.8 95.5 82 87 86 86 103
Physical Medicine & Rehab 50.5 100.0 59.3 100.0 48.8 95.3 51.7 92.0 50.0 95.1
Plastic Surgery 0 0.0 0.0 0 0.0 0.0 0 0.0 0.0 0 0.0 0.0 101 86.1 98.0 0 69 70 101 116
Plastic Surgery (Integrated) 95.7 99.1 86.1 96.0 92.9 100.0 88.4 100.0 0.0 0.0 Preventive Medicine 2 0.0 0.0 4 25.0 50.0 5 20.0 60.0 6 16.7 66.7 6 33.3 100.0 1,063 1,091 1,097 1,118 1,360 Psychiatry (Categorical) 50.1 97.8 55.1 96.6 58.3 97.4 61.4 98.5 61.7 99.0 Psychiatry-Family Medicine 11 100.0 100.0 10 80.0 80.0 9 100.0 100.0 13 76.9 84.6 11 54.5 90.9 3 5 4 2 2 Psychiatry-Neurology 100.0 100.0 50.0 50.0 50.0 75.0 40.0 80.0 66.7 100.0 Radiation Oncology 23 73.9 100.0 15 100.0 100.0 16 93.8 93.8 15 93.3 100.0 15 100.0 100.0 151 141 144 135 164 Radiology-Diagnostic 61.6 91.5 66.7 91.9 79.9 94.4 85.1 98.6 87.4 98.0 Surgery (Categorical) 1,185 80.5 99.6 1,146 79.8 99.7 1,108 81.0 99.8 1,077 83.1 99.8 1,065 77.4 99.5 1,151 1,165 1,179 1,221 1,278
Surgery-Preliminary (PGY-1 Only) 35.5 64.1 39.1 60.4 39.5 62.3 36.9 60.4 34.8 58.9 Thoracic Surgery 26 84.6 100.0 20 95.0 100.0 13 92.3 100.0 10 80.0 100.0 3 100.0 100.0 981 980 952 941 937
Transitional (PGY-1 Only) 83.8 96.9 83.4 97.2 85.2 96.5 84.9 96.4 85.6 96.1
Urology 0 0.0 0.0 0 0.0 0.0 0 0.0 0.0 9 100.0 100.0 9 77.8 100.0 19 22 30 41 46 Vascular Surgery 80.4 97.8 92.7 100.0 96.7 96.7 86.4 95.5 78.9 100.0 22,427 22,809 TOTAL - PGY-1 26,392 62.1 96.5 24,034 65.4 95.4 23,421 66.6 95.6 65.7 95.4 64.9 95.2
%Tot %U.S. Offered Filled %Tot %U.S. Offered Filled Offered %U.S. %Tot
Filled %Tot %U.S. Offered Filled Filled %Tot
Positions Offered and Percent Filled by U.S. Seniors and All Applicants, 2009 - 2013 (Continued)
%U.S. Offered Specialty
Table 8
2013 2012 2011 2010 2009 PGY-2 Positions Anesthesiology 580 68.6 96.9 557 71.3 96.9 563 76.6 94.7 588 71.4 94.9 641 77.7 97.5 0 0 0 47 37 Child Neurology 37.8 70.3 48.9 74.5 0.0 0.0 0.0 0.0 0.0 0.0 Dermatology 369 85.6 98.1 340 84.7 96.8 344 82.3 98.5 329 82.1 98.8 310 84.5 99.7 43 19 19 0 0 Emergency Medicine 0.0 0.0 0.0 0.0 47.4 100.0 31.6 100.0 58.1 100.0 Neurodevelopmental Disabilities 7 57.1 71.4 7 85.7 85.7 0 0.0 0.0 0 0.0 0.0 0 0.0 0.0 385 357 339 346 331 Neurology 57.1 96.7 52.3 94.2 60.8 95.9 56.3 93.8 49.9 97.4 Nuclear Medicine 5 0.0 60.0 4 0.0 75.0 6 16.7 16.7 4 0.0 25.0 0 0.0 0.0 288 280 287 281 294Physical Medicine & Rehab 51.7 99.7 50.5 98.6 48.1 96.9 46.4 96.8 44.8 96.9 Plastic Surgery 11 90.9 100.0 20 95.0 100.0 38 89.5 100.0 37 89.2 100.0 0 0.0 0.0 3 2 1 1 3 Preventive Medicine 0.0 33.3 0.0 0.0 0.0 0.0 0.0 0.0 0.0 0.0 Psychiatry 2 50.0 100.0 3 0.0 0.0 4 75.0 75.0 3 66.7 66.7 3 66.7 66.7 0 1 1 0 1 Psychiatry-Neurology 0.0 100.0 0.0 0.0 100.0 100.0 100.0 100.0 0.0 0.0 Radiation Oncology 160 83.8 95.6 156 98.1 99.4 155 90.3 96.8 142 86.6 95.1 141 85.8 91.5 944 949 980 976 979 Radiology-Diagnostic 74.0 94.8 75.9 92.3 78.9 96.6 84.2 99.6 86.4 99.3 2,758 2,711 TOTAL - PGY-2 2,779 69.9 96.0 2,738 71.2 94.7 2,737 73.8 96.2 73.2 97.0 74.1 97.9 GRAND TOTAL 29,171 62.8 96.4 26,772 66.0 95.3 26,158 67.3 95.6 25,520 66.5 95.5 25,185 66.0 95.4 Neurological Surgery joined in 2009. ACGMEcreated a new PGY-1 Plastic Surgery (Integrated) specialty in 2009. Combined/coordinated Plastic Surgery progams (which are not integrated) now appear under PGY-2 positions. Many Anesthesiology and Emergency Medicine programs have converted their positions from Advanced (PGY-2) to Categorical (PGY-1) over the period, affecting the trends in those specialties.