Abstract-- The recent introduction of the competitive electricity market in many countries has sparked a renew trend in connecting small-size generators into distribution networks. Those new generators together with different other types of equipment such as On-load Tap Changing (OLTC) transformer, shunt capacitors, shunt reactors, etc, will all participate into the voltage regulation process in the power systems. Poor coordination between these devices may cause unnecessary operations, and consequently unnecessary wear, unnecessary energy consumption as well as poor voltage quality. In this paper, we present an innovative strategy to coordinate the voltage control actions in a distribution system with more than one voltage regulating device. The method for voltage control coordination is developed based on the priority level of each regulating device and implemented through communication. A sensitivity-based technique for determining the control zones of the regulating devices has been developed. A practical system with tap changers and distributed generator has been chosen to test the developed control method. Simulations have been carried out extensively on a practical distribution system to show the effectiveness of the method.
Index Terms-- Distributed Generation, Power Distribution System, Voltage Control, Control Zone, On-load Tap Changing Transformer.
I. INTRODUCTION
Ne of the most important duties of a distribution system is to maintain the voltage supplied to customers within the acceptable limits, under any loading circumstances. Failure to meet this responsibility may result in malfunctions or damage of customers’ equipment. Voltage fluctuations occurring in the network is essentially the result of changing loads due to varying demands of customers at different times throughout the day. In order to keep these fluctuations within the statutory limits, indirect method with distributed generations (DG), shunt reactors/capacitor banks, Static VArs Compensators
This research has been financially supported by the Australian Research Council under ARC Linkage Grant K0014223 “Integration of Distributed and Renewable Power Generation into Electricity Gird Systems”, collaboration with Aurora Energy, Tasmania.
Ms. An D.T. Le, Dr. Mohammad A. Kashem, and Prof. Michael Negnevitsky are with the School of Engineering, University of Tasmania, Hobart, Australia, and Prof. Gerard Ledwich is with the School of Engineering Systems, Queensland University of Technology, Brisbane, Australia, (emails: [email protected]; [email protected]; [email protected]; [email protected]).
(SVC), etc., and direct method with On-load Tap Changing (OLTC) transformer, regulators, etc. are used [1].
In this paper, the voltage regulation task is accomplished by using the OLTC in conjunction with the DG. While the OLTC is already available in most distribution feeders, the DG is chosen here as voltage regulatory equipment for the many benefits such as voltage support, line loss reduction, improvement of supply reliability and security. A problem that arises in this kind of voltage control system, however, is the possibility of excessive operations of the OLTC and/ or the DG. This might happen due to insufficient voltage control method or a lack of proper coordination between the two devices in their simultaneous operation. Unnecessary actions of the OLTC (or voltage regulator) and DG are undesirable because of economic reasons. Changing tap position of the OLTC causes transients and mechanical wear on the OLTCs themselves [2]. Operation of the DG consumes energy resources (some of them are expensive, such as fuel) and also reduces the operational age of the machine.
The voltage control coordination is therefore necessary in the distribution network and has been a subject of interest in many research papers. H.M. Ma et al in [3] have used the hierarchical genetic algorithm (HGA) to optimise the power voltage control systems according to the number of control actions. In [4], an integrated voltage control called Coordinated Secondary Voltage Control (CSVC) has been proposed for controlling the OLTC positions to ensure that voltage and loading constraints are satisfied during normal and emergency conditions. Another voltage regulation method in power distribution systems including DG systems has been developed in [5] through optimizing sending voltages using the Least Square method. Authors in [6] have coordinated the operations of switched capacitors and OLTC in a radial distribution system by approximating the problem as a constrained discrete quadratic optimization. In [7], the coordination method for the DG and step voltage regulator operations for improved distribution system voltage regulations has been presented. However, none of these coordination methods has considered the priority/selectivity of different voltage regulating devices in the system with the presence of DG. This concept is incorporated in this paper for the purpose of increasing the effectiveness as well as reducing the operating cost of the control actions.
The aim of this paper is to build up a complete, sufficient and applicable voltage regulation method for the OLTC and
Response Coordination of Distributed
Generation and Tap Changers for Voltage
Support
An D.T. Le, Student Member, IEEE, K.M. Muttaqi, Senior Member, IEEE, M. Negnevitsky, Member,
IEEE,and G. Ledwich, Senior Member, IEEE
the DG in their simultaneous operation during peak load hours. The objective of the coordination controller is to reduce, or eliminate the number of counter-acting operations between the two devices.
II. VOLTAGE REGULATION METHOD
Conventionally, the voltage on any distribution feeder is controlled by the OLTC placed at the substation. The main purpose of this voltage regulation is to keep the voltages of all the customers within the acceptable limits, which is ± 5% for Australia distribution system. However, with the rapidly increase of load, the OLTC can not always guarantee that it will be able to keep the regulation requirement satisfied. The recent trend of introducing DG into the distribution networks has become a potential solution for solving voltage problem, especially during peak hour. In this section, we introduce a coordinated voltage control technique using parallel operation of the OLTC and the DG with minimum level of communication system.
A. Simple System Model
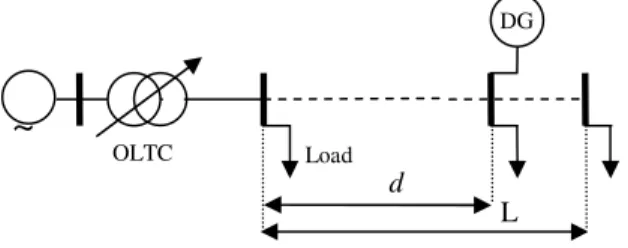
To analyze the operation of the OLTC and the DG, as well their effects on the distribution feeder, a simplified model has been used as shown in Fig.1.
Fig. 1 Simplified model of distribution feeder
The distribution feeder is connected to the substation, which is modelled as a Thevenin source, at the point of common coupling. For simplicity, distribution line of length L is represented as series resistance and reactance with load represented by equivalent lumped values at N number of nodes. The network is equipped with an OLTC at the substation. The OLTC has provision for correcting the voltage from -5% to +15%, each step represents a 1.25% change in voltage. A DG connected to the distribution line through a load bus d km from the substation. It is modelled as a current source and able to inject both real and reactive power to the system.
B. Voltage Regulation by OLTC
The operation of the OLTC includes five major steps, which are described in details below:
Step 1 - Status determination: The OLTC recognizes the current voltage condition, which is represented by the value of voltage error. The voltage error of the OLTC controller, Verr1
depends on two inputs, the actual voltage at the target bus of the OLTC, Vt1, and the reference voltage Vref. It can be
calculated using (1):
1
1 ref t
err
V
V
V
=
−
(1)It should be noted that Vref is normally set at 1.0 p.u. The
target bus of the OLTC is referred to as the furthest bus from the substation which belongs to the control zone of the OLTC. In other words, the OLTC is meant to regulate the weakest voltage point within their zone of responsibility. Definition of “control zone” will be discussed later on in this paper. Step 1 produces an output called Si, which takes a value of 0, or -1, or
+1 depending on how difference the Verr1 compared to the
deadband a is, as shown in (2).
−
<
>
+
≤
≤
=
for
1
for
1
-for
0
1 1 1a
V
a
V
a
V
a
S
err err err i (2)Value of the deadband defines the total voltage range, around the voltage setting Vref, which the OLTC controller will
consider as a satisfied condition. Choice of a small deadband will result in more tap changes to occur, but will provide a better regulation. On the contrary, a larger deadband causes fewer tap changes, but at the expense of a closely regulated line.
Step 2 – Comparison of current and previous voltage status: in this step, the current status Si will be compared to the previous
status Si-1. This is done to keep track of the changes of voltage
status at the target bus.
Step 3 – Counter setting: A counter is employed to determine the time duration of the voltage error exceeding the deadband. The counter basically starts accumulating the time when voltage error is outside of the deadband. It will be reset in three cases: the voltage error fluctuates below and above the deadband, the voltage error changes sign, or the voltage error is currently within the deadband. Output of the counter is determined based on the results of the comparison in Step 2:
=
∆
+
=
≠
=
− − −for
0
for
0
for
0
1 1 1 i i i i i i iS
S
t
C
S
S
S
C
(3)Where ∆t is the time step.
Step 4 – Time delay setting: In this step, value of the counter will be compared to the time delay setting DT, and the control action will take place only if the time delay is elapsed. The time delay varies depend on the control coordination algorithm, which has a great impact on the performance of the system. Selection of the DT value will be discussed in more details in the section of “Coordinated voltage control”. Step 5 – Action of tap changer: if there is a requirement of a tap change and the counter value is equal or greater than the time delay setting (Ci≥ DT), a signal will be sent to the
tap-changer motor to move the tap up or down. The actual tap ratio is:
( )
max min max min 1and
if
V
V
V
n
n
n
n
u
n
n
local i i i≤
≤
≤
≤
∆
+
=
− (4) Where ni and ni-1 are the current and previous actual tap ratio,respectively, ∆n is the tap step, and u is the desired tap ratio
which is +1 for requirement of a tap up, -1 for requirement of a tap down, and 0 for no requirement of tap action. nmin and nmax
DG OLTC Load d L
~
represent the working band of the OLTC, Vmin and Vmax are the
lower and upper voltage limits, respectively.
C. Voltage Regulation by DG
The DG controller operates in a much similar manner with a sequence of 5 steps. The steps and their outputs are as followings:
Step 1 - Status determination: The DG status SDGi can be
determined by (5);
−
<
>
+
≤
≤
=
for
1
for
1
-for
0
2 2 2b
V
b
V
b
V
b
S
err err err DGi (5)and
V
err2=
V
ref−
V
t2 (6) Where, Verr2 is voltage error of the DG controller, Vt2 is actualvoltage at the target bus of the DG, b is the voltage deadband of Vt2.
Step 2 – Comparison of current and previous voltage status:
SDGi is compared to SDGi-1.
Step 3 – Counter setting: Counter value is calculated as:
=
∆
+
=
≠
=
− − −for
0
for
0
for
0
1 1 1 DGi DGi DGi DGi DGi DGi DGiS
S
t
C
S
S
S
C
(7)Step 4 – Time delay setting: Time delay of the DG is denoted as TDDG. Setting for time delay of the DG controller will be
described later in section 2.4.
Step 5 – Action of the DG: The desired output of the DG, IDG,
is calculated using the proportional controller as in (8): 2
err P
DG
K
V
I
=
(8)Where KP is the proportional constant.
In this work, however, the DG is set to step-by-step update its output towards to desired value, instead of making a substantial change. This is done to allow time for the other regulating devices (OLTC in this case) to take part into the regulating process. Also, it helps to avoid unnecessary extra energy delivered by the DG in case when the later change of the load demand would possibly eliminate the voltage violation. By controlling DG output in this way, we would be able to reduce the operation cost of the DG. However, it causes increasing time of the DG response to voltage violation if the current load condition maintains sufficiently long.
D. Coordinated Voltage Control
In order to avoid hunting between the units, proper coordination is needed. The coordination makes sure that all regulating devices in the system will response to any voltage violation in a correct order. As we have mentioned earlier, the task of coordinating responses of the OLTC and DG in this paper is done using a definition of “control zone”.
Idea of the control zone is that the area subject to voltage control is divided into two zones. Each device is mainly responsible for controlling voltage in one zone, where its control action has higher influence to the voltage. The other device will act as a supporter in case the action of the main is not satisfactory or fails.
In this work, we propose a method for determination of voltage control zones according to the sensitivity analysis. From the network equation YBUSVBUS = IBUS, for a N+1-load bus system with bus 1, bus n, and bus n+1 represent the substation, the remote load bus, and the internal bus which connects the DG into the system, respectively, we obtain:
(
S DG)
T NY
Y
V
Y
V
V
2 2 5 1 3 3=
−
−+
− − (9) Where,
=
− n NV
V
V
M
3 3 ,
=
n ny
y
y
y
Y
, 2 3 , 2 , 1 3 , 1 2K
K
=
− 2 2V
V
V
S S , and VDG is voltage at the DG connection point.The relative changes of V3-N due to the DG injection and the
tap operation can be obtained with substituting VS = 0 into (9)
and examining individually the response of the system to 1.0 p.u. voltage at the DG connection point and 1.0 p.u. voltage at
V2, which is the secondary side of the OLTC, using the
superposition principle. The results are: 5 1 3
Y
Y
s
DG −−
=
(10)
−
=
−1
0
2 1 3 T TXY
Y
s
(11)If values of (10) & (11) are graphically plotted with respect to the load bus from 3 to N, their intersection point could be defined as the boundary for control zones of the OLTC and the DG. Let the ordinate of the intersection is Cb. The
responsibility of each device is defined by following rules: - If the voltage sensitivity of bus i with respect to DG voltage is greater than Cb ( b
i
DG
C
s
≥
), bus i is belong to the control zone of DG.- If the voltage sensitivity of bus i with respect to the V2 is
greater than Cb ( b i
tx
C
s
≥
), bus i is belong to the control zone of the OLTC.The main purpose of voltage control zone determination is that we will be able to assign higher opportunity to a more efficient device to operate. Thus, the voltage drop will be compensated more quickly with less number of control actions. Let us assume that the boundary bus is bus m. In other words, the control zone of the OLTC is from bus 2 to bus m, while DG control zone is from bus (m+1) to bus n, which is the remote bus. Delay time values of the OLTC and DG, which are denoted as DT and DTDG, respectively, are not constant,
but changing from time to time depending on the network conditions. The delay time could be one of the following types:
- Transient time (TT for OLTC and TTDG for DG): the time
that has to elapse before any voltage correction is permitted to take place. This setting is to avoid voltage correction to occur due to temporary voltage excursions.
- Grading time (GT for OLTC and GTDG for DG): the time in
the equipment with higher priority to complete their voltage correction. In this paper, since the operation cost of the OLTC is less than that of the DG, we assume that the default Grading Time of the DG is two times higher than the OLTC’s Grading Time.
- Second-action time (ST for OLTC and STDG for DG): the
time delay before any further action can take place, if required. The next action has to be in the same direction with the previous one for the Second-action time to apply. Otherwise, the time delay with be either Transient Time or Grading Time. It should be noted that Second-action Time is always shorter than Transient Time.
The algorithm for the control coordination has been proposed with a set up of communication system as follows: - One way communication from the target load buses to its corresponding controller, which is depending on the control zones.
- Two way communication betweens controllers of regulating devices in the system.
The first part of the communication system is built to provide highly accurate feedback signal to the controller, which is the voltage status at target buses. The later part of the communication system, on the other hand, is used to inform status of one device to another. This would be very helpful in the case that when one device fails to operate, their responsibility could then be passed on to other equipment within the shortest time, and thus reduce the duration of voltage rise/drop.
The priority of controller in this coordination scheme has been determined based on the idea of control duty. This means that if more significant load change occurs in the control zone of one regulating device, it then has more priority to operate than the other. However, taking into account that operation of the DG is more expensive than the OLTC, the DG, in case of higher priority, will only issue one step change in its output then wait until the Grading Time has passed before doing any further voltage correction. This will allow time for the OLTC to operate if necessary. Moreover, by using the communication system, a signal could be sent from one controller to another to inform their status. If one device is exceeding its capacity or fails to carry out the desired action, the other one will operate with minimum delay time, regardless its priority.
The time delay of the OLTC and the DG for this control coordination is calculated as in (12) & (13) using “IF” statements. It should be noted that the equations applied only if
Si≠ 0 and SDGi≠ 0, respectively. Vr and Vm are used to denote
the actual remote voltage and the actual voltage at boundary bus m, respectively.
Time delay for the OLTC: if Si≠ 0 if
TD
≤
TT
thenTD
=
TT
else thenTD
=
ST
end end if SDGi≠ 0 ifVD
post−
VD
pre≤
w
ifTD
≤
TT
thenTD
=
TT
else thenTD
=
ST
end elseif the DG fails to operate if
TD
≤
TT
thenTD
=
TT
else thenTD
=
ST
end else ifTD
≤
TT
DG+
TT
thenTD
=
TT
DG+
TT
else thenTD
=
ST
end end end end (12) Time delay for the DG:if
VD
post−
VD
pre≤
w
if the OLTC fails to operate
if
TD
DG≤
TT
DG thenTD
DG=
TT
DG else thenTD
DG=
ST
DG end end else ifTD
DG≤
TT
DG thenTD
DG=
TT
DG else ifTT
DG<
TD
DG≤
GT
DG thenTD
DG=
GT
DG else thenTD
DG=
ST
DG end end (13) Where, VDpre and VDpost are the simulated voltage dropsbefore and after voltage excursion. ω is a threshold value to
determine the priority of the regulating equipment.
In (12) & (13), the three variables VDpre, VDpost, and ω are
used to determine the knowledge of where the causes of voltage violation are. This knowledge is used as a criterion to assign the time delay values for the OLTC as well as the DG. When the remote voltage is outside the deadband, this is due to one or both of the following reasons:
- A voltage change upstream the DG - A load change downstream the DG
The distinction between those two can be found by monitoring the local voltage and current at DG point, as well as the upstream feeder impedance. This information could provide us a simulated voltage drop, from which we are able to define if there is any load change has occurred in the voltage control zone of the DG [8]. If the difference between simulated voltage drop before and after voltage excursion is large, then the second cause is more likely to occur.
III. CASE STUDY
The proposed coordination method has been tested on a system, which is modified from a distribution feeder of Aurora Energy. The main feeder is 48 km long with 1.0136 MVA load distributed along the line. Loads are assumed to be lumped at 69 nodes, in which node 1 is represented for the substation and node 69 is denoted for the remote load bus. There are nine laterals attached to the main, which is shown in Fig.2.
Fig. 2: Smithton - Woolnorth test feeder
In order to properly illustrate how the coordination methods work, modified form of the system has been used. The feeder has an automatic OLTC at the substation and a DG 36 km from the substation.
IV. SIMULATION RESULTS
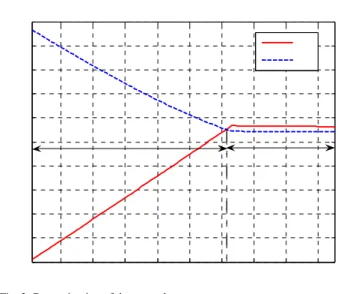
Firstly, we demonstrate how to determine the control zones for each regulating unit by the approach of zone determination with the system offline load data. The sensitivity values of load bus voltages with respect to voltage at the secondary side of the OLTC (sTX) and with respect to voltage of the DG
connection point (sDG) have been plotted on the same graph, as
shown in Fig.3. The intersection of sTX and sDG divides the
feeder into two parts. The upstream part from bus 2 to bus 52 is belong to the OLTC control zone, while the downstream part from bus 53 to the remote end belongs to the DG control zone. We should note that the sensitivity analysis here is carried out for those load buses located on the main feeder only. For the laterals, those attach to the backbone at points which belongs to the OLTC control zone, will also be the major regulating duty of the OLTC. Otherwise, the DG will be the main responsible regulating unit.
12 22 32 42 52 62 72 82 92 0 0.1 0.2 0.3 0.4 0.5 0.6 0.7 0.8 0.9 1
Load bus number
S e n s it iv it y v a lu e s
Determination of control zone
s
DG
sTX
Control zone of the OLTC Control zone of the DG
Fig. 3: Determination of the control zones
The load variation, as shown in Fig.4, has been used to test the proposed method of voltage control coordination. Total simulation time is 400 seconds. During this period of time, the total load demand increases from 1.02 MVA up to 4.02 MVA. At each second, there are a number of random load buses changing their load demand with a random magnitude. This has been done to imitate the practical situation of load fluctuations, which are random and non-uniform. Since under-voltage situations are more likely to occur in the distribution systems, an increasing load profile has been used in the simulation. By doing this test, we would be able to know how much the maximum loading capacity is before the system voltage fails to meet the safety margins.
0 50 100 150 200 250 300 350 400 0 0.5 1 1.5 2 2.5 3 3.5 4 4.5 Time (sec) P ( M W ) a n d Q (M V a rs )
Real and reactive power of load demand
Real power Reactive power
Fig. 4: Dynamic load profile
Normally, the time delay of an automatic OLTC would be around 20 secs for the first tap and 5 secs for the consequent ones. However, since our simulation time is relatively short, we assume that the time delay values are as follows:
TT = 10 secs, GT = 10 secs, and TT = 2 secs TTDG = 3 secs, GTDG = 20 secs, and TTDG = 1 sec
In all simulations, the reference voltage Vref is 1.0 p.u. The
variables a and b are set to be 0.025p.u. and 0.045 p.u., which SMITHTON WOOLNORTH A B C D E F G H
represent the variation limits of bus 52 and bus 69, respectively. Since bus 52 is at around two-third of the feeder from the substation, we would like to keep its voltage at a reasonable level (±0.025 variation is chosen here) in order that further voltage drops along the line will not cause the remote end to fall below 0.95 p.u. The variable b is chosen to be 0.045 instead of 0.05 to give some levels of tolerance to the control system.
Figs.5, 6 and 7 show the results of the coordination method using communication system, including the tap response, the DG response, and the voltage at the remote end, respectively. In Fig.5, we can see that the OLTC alters its ratio according to the voltage variation at bus 52. At first, it increases with the increase of load. After that, at t = 220 seconds, tap ratio stops rising at the value of 1.063. Even though the capacity of the OLTC has not exceeded yet, further increase of tap ratio is not allowed because of upper voltage constraint at the secondary side of the OLTC.
0 50 100 150 200 250 300 350 400 0.94 0.96 0.98 1 1.02 1.04 1.06 1.08 Time (sec) T a p r a ti o / V o lt a g e a t ta rg e t b u s (p .u .) Tap position Tap ratio
Actual voltage at bus 52
Fig. 5: Tap response and voltage at the target bus – bus 52
0 50 100 150 200 250 300 350 400 0 0.02 0.04 0.06 0.08 0.1 0.12 0.14 0.16 0.18 Time (sec) P ( M W ) a n d Q (M V a rs )
Real and reactive power of DG
Real power Reactive power
Fig. 6: DG response
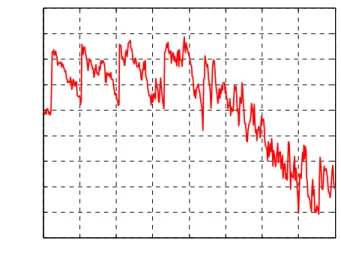
By observing the voltage at the remote end (Fig.7), which is controlled by the DG, we can see that the voltage drops below the deadband at t = 335 seconds. However, the DG has not responded at that time since the duration of voltage violation is
not sufficient enough to activate the DG controller. When t = 352 seconds, the DG starts responding to the excursion at the remote bus. After that, from t = 360 seconds, the DG output increases rapidly to compensate the voltage drop as it detects the saturation condition of the OLTC.
Voltage profile of system shows that the voltage is well regulated most of the simulation time. Actions of the OLTC has maintained the voltage within the safety margins, and thus kept the DG offline for more than 85% of time. The DG only participates into the control process when the voltage drops below the limit, and the OLTC fails to operate further. This can be considered as a desired solution for solving voltage problems in a distribution system, which maximises the capacity of the OLTC and utilises the DG only in real need.
0 50 100 150 200 250 300 350 400 0.945 0.95 0.955 0.96 0.965 0.97 0.975 0.98 0.985 0.99 Time (sec) V o lt a g e ( p .u .)
Voltage at the remote end
Fig. 7: Remote end voltage profile
V. CONCLUSION
In this paper, an algorithm for the control action coordination between the OLTC and the DG has been developed with the utilization of communication system. The method works by incorporating several concepts, including the control zones, settings of reference voltage, voltage deadband, as well as time delay. Selection of these settings has been discussed in details in the paper, which makes it easier for the control engineers to design their systems. The coordination method offers a reasonable recovery time for the system voltage. At the same time, it tries to minimize the operating cost of regulating devices by maximizing the capacity of the OLTC, which is cheaper, and minimizing the control action of the DG. Simulations have been conducted and the results prove that the algorithm works well and also very flexible. The approach can be expanded to be applicable for more complex systems with more number of regulating devices, such as voltage regulator. With the rapid growth of new technologies and the decrease in their cost, it is believed that in the near future, communication system will become popular and affordable for most of utilities. As the result, the proposed method can be used widely for satisfactory operation of the distribution networks.
VI. ACKNOWLEDGMENT
The authors gratefully acknowledge the support and cooperation of Aurora Energy personnel in providing data and advice on the operation of distribution systems.
VII. REFERENCES
[1] M. Larsson, “Coordination of Cascaded Tap Changers using a Fuzzy-Rule Based Controller”, Fuzzy Sets and Systems, Vol. 102, Issue 1, pp.113 – 123.
[2] G.W. Kim, and K.Y. Lee, “Coordination Control of ULTC Transformer and STATCOM Based on an Artificial Neural Network”, IEEE Transactions on Power Systems, May 2005, Vol. 20, Issue 2, pp. 580 – 586.
[3] H.M. Ma, K.F. Man, and D.J. Hill, “Control Strategy for Multi-objective Coordinate Voltage Control Using Hierarchical Genetic Algorithms”, IEEE International Conference on Industrial Technology, ICIT 2005, 14-17 Dec. 2005, pp. 158 – 163.
[4] F.A.B. Lemos, L.C. Werberich, J.S. Freitas, and M.A. da Rosa, “A Strategic for Voltage Coordinated Control to Improve System Operation”, 2001 IEEE Porto Power Tech Proceedings, 10-13 Sept. 2001, Vol. 2.
[5] D. Rho, H. Kita, J. Hasegawa, and K. Nishiya, “A Study on the Optimal Voltage Regulation Methods in Power Distribution Systems Interconnected with Dispersed Energy Storage and Generation Systems”, Proceedings of EMPD '95., 1995 International Conference on Energy Management and Power Delivery, 1995, 21-23 Nov. 1995, Vol. 2, pp. 702 – 707.
[6] R. Baldick and F.F. Wu, “Efficient Integer Optimization Algorithms for Optimal Coordination of Capacitors and Regulators”, IEEE Transactions on Power Systems, Aug. 1990, Vol. 5, Issue 3, pp. 805 – 812.
[7] L.A. Kojovic, “Coordination of Distributed Generation and Step Voltage Regulator Operations for Improved Distribution System Voltage Regulation”, 2006 IEEE Power Engineering Society General Meeting, 18-22 June 2006.
[8] C.A. Smith, M.A. Redfern, and S.Potts, “Improvement in the Performance of On-Load Tap Changer Transformers Operating in Series”, IEEE Power Engineering Society General Meeting, 13-17 July, 2003, Vol. 3.
VIII. BIOGRAPHIES
An D.T. Le received the B.E. (Hons.) from the University of Tasmania, Australia, in 2004. She is currently pursuing the PhD degree at the University of Tasmania. Her special fields of interests are power system analysis, renewable energy, distributed generation, power system control and protection.
K.M. Muttaqi (A’00–SM’05) received the Ph.D. degree from Multimedia University, Malaysia, in 2001. Currently, he is a Senior Lecturer at the School of Engineering, University of Tasmania, Australia. He was associated with the Queensland University of Technology, Australia as a Postdoctoral Research Fellow from 2000 to 2002. Previously, he also worked for Multimedia University as a Lecturer for three years. His special fields of interests include distributed generation, renewable energy, distribution system automation, power system planning, and artificial intelligence. He has published more than 50 technical papers in these areas.
Michael Negnevitsky (M’95) received the B.S.E.E. (Hons.) and Ph.D. degrees from Byelorussian University of Technology, Minsk, Belarus, in 1978 and 1983, respectively. Currently, he is Professor, Chair in Power Engineering and Computational Intelligence, in the School of Engineering at the University of Tasmania, Hobart, Australia. From 1984 to 1991, he was a Senior Research Fellow and Senior Lecturer in the Department of Electrical Engineering, Byelorussian University of Technology. After arriving in Australia, he was with Monash University, Melbourne, Australia. His interests are power system analysis, power quality, and intelligent systems applications in power systems. Dr. Negnevitsky is a Chartered Professional Engineer, a Senior Member of the Institution of Engineers Australia, and a
Member of CIGRE AP36 (Electromagnetic Compatibility), Australian Technical Committee.
Gerard Ledwich (M’73–SM’92) received the Ph.D. in electrical engineering from the University of Newcastle, Australia, in 1976. He has been Chair Professor in Electrical Asset Management at Queensland University of Technology, Australia, since 1998. He was Head of electrical engineering at the University of Newcastle from 1997 to 1998. Previously, he was associated with the University of Queensland from 1976 to 1994. His interests are in the areas of power systems, power electronics, and controls. Prof. Ledwich is a Fellow of the Institution of Engineers Australia.