The study of the multi-line-signal s
2
state of the
oxygen evolving complex of the photosystem-II.
Leonard Akofang
Department of Chemical & Forensic Science
Botswana International University of Science and Technology
Palapye, Botswana
Bernard Baituti
Department of Chemical & Forensic Science
Botswana International University of Science and Technology
Palapye, Botswana [email protected]
Abstract
The world is currently facing an increased need for clean and renewal energy sources due to global warming and rapid depletion of crude oil reserves. Production of hydrogen fuel from water could be a possible future solution as it is renewable and burns cleanly to produce only energy and water. Current hydrogen production techniques including water electrolysis have been rendered uneconomical due to high energy requirement, however looking at natural processes; green organism can oxidize water to oxygen and hydrogen using sunlight by oxygenic photosynthesis. Understanding the photo oxidation mechanism of water could enable mimicking the reaction in laboratory and ultimately a full scale production plant. Oxygenic photosynthesis is a process whereby organic compounds especially sugars and molecular oxygen are produced, the latter as a waste product, while consuming water and carbon dioxide in the presence of sunlight. Understanding the structure of oxygen evolving complex (OEC) fully still remains a challenge. The aim of this study was to characterize the multiline signal in detail, which can help increase our understanding of how the manganese atoms in the catalytic cluster of the PSII magnetically interact. Photosystem II contains the water oxidizing complex (WOC), which utilizes the interaction of four manganese ions and calcium ion (Mn4/Ca catalytic
cluster) for its function. The WOC (also known as Oxygen Evolving Complex- OEC) proceeds via five redox intermediate states known as ‘S’ states, categorized into four meta-stable states (S0, S1, S2 and S3)
and one transient state (S4). The subscripts in the ‘S’ states
correspond to the stored oxidizing equivalents. The S1 state is
normally called the dark stable state of the WOC. Specific low temperature illumination procedures were applied to set the PSII samples into the S2 state, without advance to the S3 state in this study.
The S2 state was studied using Electron Paramagnetic Resonance
(EPR) spectroscopy at X-band frequencies. The S2 state generates a
visible “𝐠𝟐 multiline” signal (ML), unstructured “𝐠𝟒. 𝟏” EPR signals known to involve the Mn ions in the +3 and +4 oxidation states. The manganese ions in the OEC are known to be anti-ferromagnetically coupled, yielding a net spin ½ ground state in the illumination induced S2 intermediate (associated with the Mn ions) of the catalytic
cycle and are therefore paramagnetic. The experimental temperature dependence of the ML signal is observed to be essentially that for the S= ½ ground state of a simple MnIII
-MnIV
dimer, with estimated exchange coupling, J ~-2.0 cm-1
.
Keywords: Oxygen evolving complex, Photosystem II, multiline, temperature, exchange coupling
I. INTRODUCTION
Photosystem II is a large protein complex found in the thylakoid membranes of oxygenic photosynthetic organisms, including algae, cyanobacteria and higher plants. Photosystem II (PSII) is believed to perform the photo-oxidation of water to dioxygen through the action of the manganese containing catalytic site, within the membrane-bound protein complex [1]. The oxygen-evolving complex (OEC) is located within PSII and is where oxidation of water occurs. The OEC is found within the luminal side of PSII, and it consists of four manganese atoms, cofactors Cl-1 and Ca2+ [2, 3]. During the oxygen formation reaction, the OEC cycles through five redox intermediate states (S states) named the Kok cycle [4], labelled S0→S4, where the subscript represents
the number of stored oxidizing equivalents in the cluster. The S1 state is normally called the dark stable state of the
OEC, and at low temperatures the Mn cluster becomes diamagnetic for dark-adapted samples [5]. The resolution of the X-ray crystallographic structures corresponds to the S1
“dark stable” state [6, 7, 8, 9, 10, and 11]. The mean oxidation state of S1 dark stable state of OEC has long been predicted to
be above +2 from X-ray absorption near edge structure (XANES) and photo-assembly measurements [12]. The S1
state is predicted to have the oxidation of MnIII4 or MnIII
2-MnIV2 or equivalent combinations described as ‘low’ and ‘high’ oxidation possibilities respectively [13]. The S0 state is
MnIII-MnIII-MnIII-MnII as well approximated by the ‘low’ oxidation state paradigm, evident by the pronounced peak at 6447 eV, which is characteristic of MnII in an aqua like
environment [14]. The mean Mn oxidation level is assumed to be +3.0 in the S1 state according to the computational studies
by Gatt et al., (2012), therefore oxidation state pattern MnIII -MnIII-MnIII-MnIII (1.9Å resolution structure) or MnIII-MnIV
-MnIII-MnII (2.9Å resolution structure), and their calculated
model is in favor of 1.9Å XRD structure [15].
The S0 →S1, S1 →S2, S2 →S3 transitions are activated by
photochemical oxidation of P680+. P680+ is highly unstable, and is stabilized by donation of electrons from the donor side of PSII, from the catalytic cluster Mn4Ca via a mediator. The
D1 peptide which in turn oxidizes the OEC [16, 17]. S4 is a
transient state, while S0 up to S3 states are called metastable
states, can be freeze trapped by rapid freezing after exposing PSII samples (cores and membranes) to different number of laser flashes [18]. Water remains exchangeable up to S3 in the catalytic site and molecular oxygen released after the final oxidation of two water molecules in the four electron concerted steps [19]. The S0 and S2 states have net odd spin ½
ground states arising from antiferromagnetic coupling of the four Mn ions [20], hence are paramagnetic and EPR active. Dismukes and Siderer discovered the S2 “multiline” signal
(Mn hyperfine structured signal), which is centered on ≈2 featuring many hyperfine peaks [21]. The existence of the newly found multiline signal by Dismukes and Siderer, was again confirmed by Hansson et al., (1982) who generated the signal through continuous illumination of the broken chloroplast. The confirmation that multiline signal arose from S2 state was made by Brudvig et al., (1983), who used
increased intensity xenon flashes and continuous illumination on multiline signal formation at cryogenic temperatures up to 160K, and single flash illumination was less effective at temperatures below 240K in forming MLS. The S2 state
X-band CW-EPR generated multiline signal exhibits between 18 and 20 peaks with superhyperfine structures observed. The Mn hyperfine structured signal at Q-band exhibits the same number of peaks with less superhyperfine structure, which indicates the increase in dominance of the Zeeman interaction as well as linewidth effects [22, 23].
Il. MATERIALS AND METHODS A. PSII sample preparations.
The protocol used in isolating the PSII containing thylakoids membranes was based on Bricker et al., (1985) with modifications by P. Smith [23]. The homogenization, incubation steps as well as centrifugation were carried out in dim green light cold room, with temperature of about 4ºC. The chlorophyll concentration determination was determined by using the method by Porra et al., (1989). The light haversting complex (LHC II) contains almost 80% of chlorophyll in PSII membrane, and the separation of this LHC II will result in attaining the PSII core complex, which is embedded inside. The isolation of the PSII core and reaction center was done following the protocol by van Leeuwen et al., (1991) with modifications by Smith et al., (2002). The PSII core complex samples were isolated from freshly thawed PSII membranes. The eluted PSII core complexes were then concentrated using a Centriprep 30Kda cut-off concentrators to concentration of 1.5-4 mg/ml chlorophyll a in the eluting buffer containing 400mM sucrose, 20mM Bis Tris pH 6.5 and 0.3% β-D-DDM (BTS 400) and stored at -80 ºC for later use. The total chlorophyll of 3-5% was yielded in the eluted PSII core complexes. The chl a/b and Chl content were determined following Porra et al., (1989) protocol, using 80% acetone as a solvent. The oxygen evolution measurements were carried out
using a Hansatech Oxygen electrode thermostated at 25 ºC. The p-phenylbenzoquinone (pPBQ-350µM) was used as electron acceptor which results in considerable enhancement of the multiline signal, [24] while the oxygen evolution buffer consisted of the Elution fraction buffer without DDM and MgSO4.
B. Illumination
The PSII samples prepared as above were thawed on ice/water mix (0 ºC/273K) for 1 hour before use. Aliquots of 250 µl were carefully loaded into 4 mm O.D. quartz EPR tubes (Wilmad quartz), and subsequently frozen in liquid nitrogen. If bubbles were found in the sample, it was immediately thawed, the bubble removed then re-frozen in liquid nitrogen (about 77 K). The annealing of PSII sample was done by storing the sample in ice/water mix (0 ºC/273K) covered with a black cloth to minimize stray light entering. The sample was annealed for approximately 10 to 30 minutes, this ensured a full relaxation to the S1 state, and subsequently
freeze trapped in the S1 state using liquid nitrogen. The S1
state generates the background EPR spectrum, which is subtracted from an illumination spectrum to achieve the difference spectrum. The tyrosine radical (YD) signal was also removed from the difference spectrum. Otherwise the remaining tyrosine radical signal was subtracted using the Bruker WIN EPR system software package.
To generate the S2 state through S1 → S2 turnover, from PSII
core complexes, the temperature of the sample was monitored and controlled by a nitrogen gas flow system. Samples were subjected to 12 seconds illumination (PSII core samples ~240 K) using a Kodak Ektalite 1500 slide projector fitted with Halogen lamp. The light was passed through a 10cm water path IR filter, filtered using a combination of yellow and blue filters to allow a narrow window green light to pass. The sample was rapidly freeze trapped in the S2 state immediately
after illumination in liquid nitrogen (77 K). C. EPR Measurements
The experiments were performed using the X-band continuous wave (CW) Bruker Biospin ELEXSYS E500 spectrometer using Bruker SHQX resonant cavity and super X-EPR Microwave Bridge. The spectrometer was fitted with Oxford - ES900 continuous flow helium cryostat with temperatures controlled using Oxford Instruments ITC-4 temperature controller. The experiments were carried out at cryogenic temperatures (~5 K to ~20 K). The EPR parameters used are listed in the figure legends; the magnetic field was calibrated with Bruker ER035M NMR Gauss meter.
D. X-band CW-EPR spectra analysis and simulations The acquisition and control of the EPR spectra using the Bruker ELEXSYS-II E500 spectrometer as well as some level of processing was done using the proprietary Bruker Xepr
software. The majority of the spectra analysis was performed using the Bruker WinEPR system software package.
IIl. RESULTS AND DISCUSSIONS
X-Band CW-EPR generated signals generated by ~240K green light illumination.
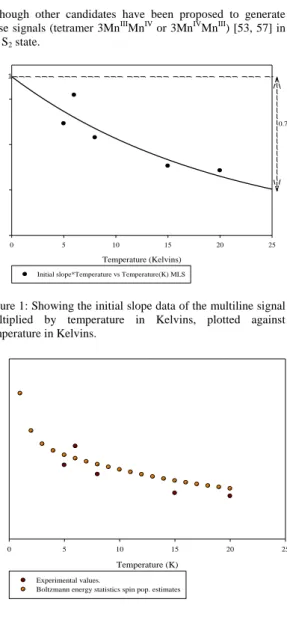
The temperature dependence plots of both the ML signal was generated using sucrose cryoprotectant PSII core samples in the S2 state (~240 K illuminated), which will give an indication on the spin states of excited states detected as well as the exchange interaction associated with each signal. The temperature dependence plot of ML signal (Fig.1), demonstrate that the multiline signal arises from center showing a strict ground state behavior over the temperatures range from 5 K to ~14 K. The energy at 15 K (where the depopulation of the spin ½ state is evident from Fig.1) can be obtained by solving the following Boltzmann equation 1:
ML spin = (2S1+1)e−∆E(1) k⁄ T
(2S1+1)e−∆E(1)kT+(2S2+1)e−∆E(2) k⁄ T(S1= ½, S2=3/2) (1) Where ML spin is the multiline spin population, ΔE(1) is the energy of the spin ½ (ML) state, relative to some reference and ΔE(2) is the energy of the next higher spin state, assumed S = 3/2 (e.g. the g4.11 ). For convenience we may take
ΔE(1) = 0 and ΔE = ΔE(2).
A simple analysis then gives, from Fig.1 and equation 1
Relative ML = 2
2+4e−∆E k⁄ T let x = e−∆E k
⁄ T (1b) = 1/(1 + 2x) ~ 0.4 at 25K 1 = 0.4 + 0.8x x~ 0.7 at 25K (from Fig. 5) lnx = −0.3567 = −ΔE/k ∗ 25 ΔE = 25 ∗ 0.0083 ∗ 0.3567 = 0.07401KJ/mol ~74.01 J/mol = 6.17 cm−1
NB: 1 cm-1 = 12 J/mol, k = 8.3 J K-1/mol, therefore
1 cm − 1 = 1.44 K ( 8.3JK12J/mol−1/mol)
Using the simplest Mn magnetic exchange system, which may give rise to MLS and the g4.11 signals (first excited state g4.1 signal), the anti-ferromagnetically coupled MnIII-MnIV dimer
(total spin 7/2), can give rise to their respective temperature dependence behavior. The MLS results from the ground state (S= ½) state while the g4.11 signal, also generated at ~240 K
by green light, is the first excited state (S=3/2). Fig.2 below shows the experimental temperature dependence plot of the multiline signal compared with the calculated spin populations using the Boltzmann distribution law for the MnIII-MnIV dimer
model developed below (equation 4). Firstly however, the above value of ΔE, which is the energy difference between the spin ½ and 3/2 states can be used to obtain an initial estimate of the exchange constant J for this effective dimer model, using Heisenberg spin Hamiltonian:
ℋ = − ∑ 2𝑱𝑖𝑗 𝑖𝑗. 𝐒𝑖. 𝐒𝑗 i ≠ j (2) For the dimer, take i = spin 1 (Mn1) and j = spin 2 (Mn2). Since the two spins are coupled into S= ½ and S= 3/2 states, it will be convenient to express everything in terms of the total spin. Therefore for the ground state spin ½ MLS excited state spin 3/2 g4.11 ( ℋ = − ∑ 2𝑱𝑖𝑗 𝑖𝑗. 𝐒𝑖. 𝐒𝑗) ST= total spin 𝐒𝐓𝟐= (S1 + S2) 2 = (S1 + S2) (S1+S2) = 𝐒𝟏𝟐+S1.S2 + S2.S1 + 𝐒𝟐𝟐 (2a) 𝑺𝑻𝟐 = 2 S1.S2 + 𝑺𝟏𝟐 +𝑺𝟐𝟐 S1 = S1x + S1y + S1z S2 = S2x + S2y + S2z ST = Sx + Sy + Sz 𝑺𝑻𝟐 = ST (ST +1), 𝑺𝟏𝟐 = S1 (S1+1) and 𝑺𝟐𝟐 = S2 (S2 +1). Therefore using the expression above, the energy of the ground state spin ½ can be calculated (i.e. the value of 2 S1.S2), for the simple MnIII-MnIV dimer considered here:
where MnIII is S
1= 2; MnIV is S2=3/2, hence
𝐒𝐓𝟐 = ½ (½ + 1) = ¾ 𝐒𝟏𝟐 = 2(2 + 1) =6 𝐒𝟐𝟐 = 3/2 (3/2 + 1) = 15/4
Energy for the MLS spin ½ will be
2 S1a.S2a=𝐒𝐓𝟐 - 𝐒𝟏𝟐 - 𝐒𝟐𝟐 = ¾ - 6 – 15/4 =-36/4=-9. (2b) The same method can be used again in calculating the energy of first excited g4.11 state spin 3/2, which will be
Hence having calculated the energy difference from above in equation 2b to be 74.01 J/mol, then using the expression below, the value of J can be obtained:
∆E = −2J (S1b∙ S2b− S1a∙ S2a) (3) 74.01 J/mol = -J (-6 + 9)
J= -24.6. J/mol = ~ -2.0 cm-1.
This estimated J value, using the method above, perfectly fit the ML signal, as will be seen later. Therefore other energy differences can be calculated using the J-value above, and following the same procedure in calculating the value of 2 S1S2.
Energy difference between S= ½ and S = 5/2: 𝐸 (5
2) − 𝐸 (
1
2) = −2𝐽(𝑆1𝑐∙ 𝑆2𝑐− 𝑆1𝑎∙ 𝑆2𝑎)
=24.6 x (-1 + 9) =197 J/mol = 16.4 cm-1 Energy difference between S= ½ and S = 7/2:
𝐸 (7 2) − 𝐸 (
1
2) = −2𝐽 (𝑆1𝑑∙ 𝑆2𝑑− 𝑆1𝑎∙ 𝑆2𝑎)
= 24.6 x (6 + 9) = 370.2 J/mol = 30.8 cm-1. Knowing the energy differences between the states, then the Boltzmann distribution law was applied to calculate the spin populations for all the states based on the fact that the EPR signal intensities (Initial slopes) multiplied by temperature is proportional to spin population:
Spin population (Spin i) ∝ 𝑆(𝑆𝑖+1)𝑒−∆𝐸𝑖⁄𝑘𝑇 ∑ 𝑆(𝑆𝑖+1)𝑒−∆𝐸𝑖⁄𝑘𝑇
7 2 1 2
Spin population (Spin i) =
A
𝑆(𝑆𝑖+1)𝑒−∆𝐸𝑖⁄𝑘𝑇 ∑ 𝑆(𝑆𝑖+1)𝑒−∆𝐸𝑖⁄𝑘𝑇 7 2 1 2 (4)(Where i = ½, 3/2, 5/2, 7/2). The program in “Fig.S1 in
supporting material” of this paper was developed and used in computing the theoretical values using sigma plot software, which were later compared with experimental values. The theoretical values correspond to the spin ½ systems; hence clearly from the Fig.2, MLS arises from the ground spin ½ state of the assumed simple MnIII-MnIV dimer, which is anti-ferromagnetically coupled. The curve (orange circles) through the experimental data points (red circles) in Fig.2 was generated with an estimated value of J = - 24.6 J/mol value, which was the best overall fit, with a scaling factor of 14 x 105, which is arbitrary due to the different methods of signal quantification used for the individual signal types. The other anti-ferromagnetically coupled dimer (MnIII-MnIII or
MnIV-MnIV) of the OEC gives net spin zero (or close to it).
Although other candidates have been proposed to generate these signals (tetramer 3MnIIIMnIV or 3MnIVMnIII) [53, 57] in
the S2 state.
Figure 1: Showing the initial slope data of the multiline signal multiplied by temperature in Kelvins, plotted against temperature in Kelvins.
Figure 2: Temperature dependence plot of the Curie corrected (Initial slope * T) S2 multiline signal (S= ½) generated in PSII cores using sucrose buffer as cryoprotectant, illuminated at ~240 K. The experimental values were taken from Fig.1 above, and Boltzmann energy statistics spin population values were estimated for MLS with J = - 24.6 J/mol (~-2.0cm-1), and an arbitrary value of 14x10^5 as a scaling factor. lV CONCLUSIONS
The temperature dependence plot of MLS (figure 1), demonstrates that the multiline signal arises from a centre
The curve of initial slope from figure 29 *Temperature versus Temperature.
Temperature (Kelvins) 0 5 10 15 20 25 In it ia l Sl o p e* Te mp er at u re
Initial slope*Temperature vs Temperature(K) MLS
1
0.7
Temperature dependence plot of the S2 MLS of PSIINoAdds.
Temperature (K) 0 5 10 15 20 25 Init ia l S lop e *Te mpe ra tur e Experimental values.
showing a strict ground state behaviour over temperatures ranging from 5 K to ~14 K. However the presence of a nearby excited state is evident from the non-Curie behavior seen at temperatures above ~ 10K, where depopulation of the spin ½ state is evident. The energy gap to this excited state (assumed to be spin 3/2) at 15 K can be estimated by solving the Boltzmann equation 4. This energy was estimated to be equivalent to 15 degree Kelvin (~0.12 kJ/mol). This estimate is similar to that obtained from fitting the simple MnIII-MnIV dimer model to the temperature dependences of the ML signals, as discussed above, with the effective exchange coupling value, J12 of – 2.0 cm-1.
V REFERENCES
1. Dismukes, G.C. Photochem.Photobiol.1986, 43, 99-115. 2. Debus, R.J. Biochim.Biophys.Acta, 1992, 1102, 269-352. 3. Yachandra, V.K.; Sauer, K.; Klein, M.P. Chem.rev. 1996,
96, 2927-2950.
4. Debus,R.J.; Barry, B.A.; Babcock, G.T.; McIntosh, L.
Proceedings of the National Academy of Science, USA.1988a, 85, 427-430.
5. Kok, B.; Forbush, B.; McGloin, M.
Photochem.Photobiol.1970, 11,457.
6. Brudvig, G. W.; McEvoy, J. P. Water splitting Chemistry of Photosystem II.2006, 106, 4455-4483.
7. Styring, S.;Rutherford,
W.Biochim.Biophys.Acta.1988,933,480-483.
8. Hillier, W.; Wydrzynski, T. Biochim.Biophys. Acta,
2001, 1503, 197-209
9. Åhrling,K. Pace, R.J.; A.;Evans, C.W., In Photosystem
II: The Light –Driven Water: Plastoquinone
Oxidoreductase, Wydrzynski,T.J ., Satoh,K.,Eds,
Advances in Photosynthesis and Respiration 22:Springer-Verlag:Dordrecht,The Netherlands, The Netherlands, 2005,285-305.
10. Dismukes, G.C.; Siderer, Y. Proceedings of the National Academy of Science,USA.1981, 78,274.
11. Åhrling, K.A.; Pace, R.J. Biophysical Journal. 1995, 68,
2081-2090.
12. Smith, P.J.; Åhrling,K. A.;Pace, R. J. J Chem Soc,Faraday Trans, 1993, 89, 2863-2868.
13. Koulougliotis, D.; Hirsh, D.J.; Brudvig, G.W.
J.Am.Chem.Soc. 1992, 114, 8322-8323.
14. Loll, B.; Kern, J.; Saenger, W.; Zouni, A.; Biesiadka, J.Nature 2005, 438, 1040-1044.
15. Ferreira, K.N.; Iverson, T.M.; Maghlaoui, K.; Barber, J.; Iwata, S.Science 2004,303,1831-1838
16. Zouni, A.; Witt, H.T.; Kern, J.; Fromme, P.; Krauss, N.; Saenger, W.; Orth, P. Nature (London). 2001,409,739. 17. Kamiya, N.; Shen, J.R. Proceedings of the National
Academy of Science, USA.2003, 100, 98.
18. Guskov, A.; Kern, J.; Gabdulkhakov, A.; Broser, M.; Zouni, A.; Saenger, W. Nature Structural & Molecular Biology. 2009, 16,334-342.
19. Umena, Y.; Kawakami, K.; Shen, J. –R.; Kamiya. N.
Nature. 2011, 473, 55-60.
20. Yachandra, V. K.; Sauer, K.; Klein, M. P.
Chem.Rev.1996, 96, 2927.
21. Petrie, S.; Pace, R.J.; Stranger, R. J.Chem.Eur.J. 2010, 16,
14026-14042.
22. Pace, R.J.; Stranger, R. Aust. J. Chem. 2012, 65,597-607 23. Gatt, P.; Petrie, S.; Stranger, R.; Pace, R.J.
Angew.Chem.Int.Ed.2012, 51, 12025-12028.
24. Hansson, O.; Andreásson, L. –E. Biochim.Biophys.Acta. 1982, 679, 261-268.
25. Brudvig, G.W.; Sauer, K.; Casey, J. L.
Biochim.Biophys.Acta. 1983, 723, 366-371.
26. Bricker, T.M.; Pakrasi, H.B.; Sherman, L.A. Archives of Biochemistry and Biophysics.1985, 237,170-176. 27. Porra, R.J.; Thompson, W.A.; Kriedemann, P.E.
Biochim.Biophys.Acta.1989, 975,384-394.
28. van Leeuwn, P.J.; Maaike, C.N.; van de Meent, E.J.; Dekker, J.P.; van Gorkom, H.J. Photosynthesis Research.1991,28,149-153.
29. Smith, P.J.; Masters, V.M.; Peterson, S.; Wydrzynski, T.; Styring, S.; Pace, R.J.; Krausz, E. Biochemistry. 2002, 41, 1981-1989.