Procedia Engineering 154 ( 2016 ) 158 – 167
1877-7058 © 2016 Published by Elsevier Ltd. This is an open access article under the CC BY-NC-ND license (http://creativecommons.org/licenses/by-nc-nd/4.0/).
Peer-review under responsibility of the organizing committee of HIC 2016 doi: 10.1016/j.proeng.2016.07.437
ScienceDirect
12th International Conference on Hydroinformatics, HIC 2016
EVALUATION OF HIGH-RESOLUTION SATELLITE
RAINFALL DATA OVER SINGAPORE
Jina Hur, Srivatsan V Raghavan*, Ngoc Son Nguyen, Shie-Yui Liong
Tropical Marine Science Institute, National University of Singapore, SingaporeCenter for Environmental Sensing and Modeling, SMART, Singapore
Abstract
The uncertainties of two high-resolution satellite precipitation products (TRMM 3B42 v7.0 and GSMaP v5.222) were investigated by comparing them against rain gauge observations in Singapore on sub-daily scales. The satellite-borne precipitation products are assessed in terms of diurnal cycle and extreme precipitation for 10 years from Dec. 2000 to Nov. 2010. The satellite products agree well on the late afternoon maximum and heavier rainfall of gauge-based data in winter season when the ITCZ is located in Singapore. However, they fail in estimating diurnal cycle in summer. The disagreement in summer can be accounted for by the dominant satellite overpass time (about 14:00 SGT) later than the diurnal peak time (about 09:00 SGT) of gauge precipitation. According to analysis of extreme precipitation indices, both satellite datasets tend to overestimate the light rain and frequency but underestimate high intensity precipitation and the length of dry spell over all stations. In particular, the uncertainty of extreme precipitation is higher in GSMaP than in TRMM, possibly due to the several effects such as satellite merging algorithm, the finer spatio-temporal scale of high intensity precipitation, and swath time of satellite. Such discrepancies between satellite-born and gauge-based precipitations at sub-daily scale can possibly lead to distorting analysis of precipitation characteristics and/or application model results, this research on quantification of their uncertainty is useful in many respects, especially that the satellite products can stand scrutiny overplaces/stations where there are no good data to be compared against.
© 2016 The Authors. Published by Elsevier Ltd.
Peer-review under responsibility of the organizing committee of HIC 2016.
Keywords: TRMM, TMPA-3B42; GSMaP; extreme precipitation; diurnal cycle; Singapore precipitation
* Corresponding author. Tel.: +65-8408-3020; fax: +65-6776-1455. E-mail address: [email protected]
© 2016 Published by Elsevier Ltd. This is an open access article under the CC BY-NC-ND license (http://creativecommons.org/licenses/by-nc-nd/4.0/).
1. Introduction
Singapore has a tropical rainforest climate with abundant annual rainfall of above 2,300 mm. Due to its geographical location, precipitation behaviour in Singapore is deeply influenced by the complex factors such as the large-scale monsoon systems, the tropical modes of variability and the mesoscale convective systems (MCS) [1, 2]. In addition to various precipitation mechanisms, the small land area of Singapore (about 719.1 km2) causes difficulties in obtaining
accurate rainfall information well reflected temporal and spatial variation over the region.
On account of the limitations of ground-based observations in spatial coverage, satellite-derived rainfall data evenly distributed over a wide range have been developed in the last two decades [e.g., 3, 4, 5, 6, 7, 8]. Especially, multisatellite rainfall products at high resolutions (finer than 0.25°-degree 3-hourly scale) have matured considerably at quasi-global scales since the launch of the Tropical Rainfall Measuring Mission (TRMM). Representative satellite-based data with high resolution derived from multiple sensors (e.g., multiple passive microwave (PMW) sensors and infrared (IR) radiometers) and algorithms are TRMM Multi-satellite Precipitation Analysis (TRMM-TMPA) [3], the Climate Prediction Center Morphing Technique (CMORPH) [5] products, Precipitation Estimation from Remotely Sensed Information using Artificial Neural Networks (PERSIANN) [7] and Global Satellite Mapping of Precipitation (GSMaP) [8] outputs [9]. Owing to the great efforts on the advancement of estimation algorithms, data accuracies have been steadily improving, on both temporal and spatial resolutions.
However, the data still involve uncertainties with inhomogeneous patterns over diverse regions due to the indirect nature of satellite measurements, influenced by inaccuracies in cloud top reflectance, thermal radiance and infrequent satellite overpasses [10]. In this regard, lot of studies have evaluated satellite-derived precipitation over area of interest by comparing to rain gauge rainfall data. As to Southeast Asia, [11], [12] and [13] showed that TRMM products has better performance compared to CMORPH and PERSIAN over Malaysia, Indonesia and the Philippines. [14] showed that TMPA-3B42 V7 has lesser uncertainties than TMPA-3B42 RT over the Mekong River and these biases are propagated into the hydrological simulation. [15] stated that the relatively recent version of TMPA productions (TMPA-3B42 V6) with a negative bias (-0.15 mm/day) better correspond to ground-based data over Thailand compared to V5 at daily timescale. These studies confirmed that 1) satellite-derived estimations also have uncertainties over Southeast Asia, which have a negative effect on comprehension of hydrologic characteristics and its utilization, but 2) TRMM-based products, especially the updated version, have relatively higher reliability over the region compared to other contemporary multi-satellite datasets.
To date, only a few studies have conducted intercomparison using the latest version of GSMaP-MVK data (i.e., GSMaP v5.222) based on the TRMM, over the region. [16] stated that GSMaP-MVK v4.8.4 was not able to capture the characteristics of precipitation extremes over the maritime continent due to a weighted spatial averaging in algorithm. As the weighted spatial averaging is not used in the recent version, reliability of GSMaP v5.222 can be improved in estimating extreme precipitations. Furthermore, uncertainty of estimating torrential precipitation in a short time, well known as general limitation of satellite-derived products, has not been studied at the multi-time scales over tropics where the region is hard to obtain reliable proxies for ground-based observations. Therefore, the objective of this study is to assess the uncertainties of the high resolution TRMM-based precipitation products, namely TMPA-3B42 v7.0 and GSMaP v5.222, with emphasis on diurnal and extreme rainfall over Singapore because satellite data agree well with the gauge precipitation at monthly and annual time scales (appendix A). Throughout this paper, these capabilities to represent rainfall behaviours are evaluated by comparing the satellite data against rain gauge data, at sub-daily scales, over the period December 2000-November 2010.
2. Data and Methodology 2.1. TMPA-3B42 rainfall data
The National Aeronautics and Space Administration (NASA) and Japan Aerospace Exploration (JAXA) unitedly launched TRMM in 1997 to better understand and study the distribution and variability of rainfall over the tropics. TRMM rainfall data have been improved over the last decade in various respects thorough TMPA which is designed to combine estimations from multiple satellites [3]. TMPA are based on both PMW in a low-earth orbit and IR in a geo-stationary orbit. PMW are corrected by TRMM/Microwave Imager (TMI), DMSP/The Special Sensor Microwave
Imager (SSMI), Aqua/the Advanced Microwave Scanning Radiometer (AMSR-E), the National Oceanic and Atmospheric Administration (NOAA)/the Advanced Microwave Sounding Unit-B (AMSU-B), whereas IR are from CPC merged IR datasets with half-hourly 4km grid system. The TMPA is computed two times for real-time monitoring (RT) and post-real-time research (3B42). In the study, we analyzed the recent version (v7) of TMPA-3B42 for the period of December 2000 to November 2010 at 3 hourly intervals. The data cover latitude bands 50°N-°S at a 0.25 degree grid spacing (1400 ×400 pixels).
2.2. GSMaP rainfall data
The GSMaP project started in 2002 with purposes of development of rainfall rate retrieval algorithms and production of high resolution global precipitation maps from satellite data [17]. To obtain finer spatial and temporal resolutions, GSMaP adopted multiple sensor data (i.e., microwave radiometers and IR radiometers) through the infrared-microwave radiometer combined algorithm. TRMM/TMI, Aqua/AMSR-E, ADEOS-II/AMSR, DMSP/SSMI are corrected as PMW data, whereas the global (60°N - 60°S) IR dataset provided by NCEP/CPC are used as IR dataset. Owing to such combination of multi-sensors, GSMaP covers quasi global (60°N -60°S) with horizontal grid spacing of 0.1 degree (3600x1200 pixels) and one hour interval. To match with TMPA-3B42 v7, the updated version (v5.222) of GSMaP-MVK dataset is used for the available period from December 2000 to November 2010.
2.3. Rain gauge observation data
To assess the uncertainties of both satellite-borne precipitation estimations, we analyzed rainfall data from 25 stations on hourly basis over Singapore. Since Singapore has relatively denser observation network with average distance of about 1.7 km (Max: 5.3 km, Min: 0.6 km), hourly rain gauge data over the region enable researchers to evaluate indirect proxies for precipitation data. We used the in-situ observations having same temporal coverage (2000-2010) as the existence of satellite estimation. Due to time zone differences, the station data were adjusted from Singapore time (SGT; UTC+8 hours) to Coordinated Universal Time (UTC). Extreme precipitation indices
To investigate the ability of satellite data in capturing extreme cases, several precipitation indices were computed from satellite-derived and ground-measured rainfall. Table 1 describes the definitions of the ten precipitation indices used in the study. The long-term Rx1day, 95th, frequency and intensity are calculated on a long-term basis, whereas
the others (i.e., R10mm, R20mm, Rx1day, Rx5day, CDD and CWD) are annual-based indices. Annual-based indices are calculated at each station and then averaged over the stations. Long-term indices are merely computed at every station in order to explore the robustness of the precipitation characteristics in the space. In order to minimize the errors from preprocessing method (e.g., interpolation, average), the satellite estimations are merely extracted to the nearest grid points to station sites.
Table 1. Definitions of the ten precipitation indices used in the study. Indicator name Definitions (units)
1 R10mm Number of days when precipitation is greater than or equal to 10 mm/day in a year (days) 2 R20mm Number of days when precipitation is greater than or equal to 20 mm/day in a year (days) 3 Rx1day Maximum daily rainfall in a year (mm)
4 Rx5day Maximum cumulative rainfall during consecutive five days in a year (mm) 5 CDD Maximum number of consecutive dry days in a year (days)
6 CWD Maximum number of consecutive wet days in a year (days) 7 Long-term Rx1day Maximum daily rainfall over the whole period (mm) 8 Long-term 95th 95th percentile precipitation over the whole period (mm)
9 Long-term frequency Long-term precipitation frequency (i.e., the whole period is divided by the number of rainy days) (no units) 10 Long-term intensity Long-term precipitation intensity (i.e., the total rainfall amount is divided by the number of rainy days) (mm)
3. Results and Discussion 3.1. Uncertainty in diurnal rainfall
Firstly, the reproducibility of diurnal rainfall variability over Singapore is investigated. In comparison between datasets with different spatial scales, we use satellite-derived estimations by averaging grid points over Singapore.
Figure 1 shows 6-hourly diurnal precipitation cycles derived from TMPA-3B42, GSMaP and stations. It is noticeable that the satellite estimations show the late afternoon maximum over the whole months. Many previous studies [e.g., 16, 17] on diurnal rainfall cycle have indicated that the late afternoon or early evening maximum is a general characteristic over land because daytime heating of surface can frequently induce a convective precipitation in late afternoon. In this regard, satellite- rainfall data consistently peak at 06:00 UTC (accumulated over 05:00 -10:00 UTC) in agreement with a general behaviour of diurnal rainfall cycle over land.
On the contrary, the rain gauge data peak in the late afternoon only over seven months (October-April) due to month-to-month variability. The timing of the maximum precipitation in summer season shifts earlier in the winter season. This can be interpreted into two ways: 1) the rainfall in summer has different behaviour with those in winter; 2) both satellite data are unable to capture the temporal variations of observed rainfall in Singapore. Through further analysis in this section, we attempt to identify both rainfall temporal variation and the cause of disagreements between observation and satellite data.
Figure 1. Average 6-hour accumulated precipitation (mm) derived from station (black solid line), TRMM TMAP-3B42 (red dashed line) and GSMaP (blue dotted line).
To explore the temporal variation, the change of diurnal rainfall cycle over the months is examined (Fig.2). Here, the station and GSMaP are based on hourly rainfall while TRMM, on a 3-hourly basis. It is interesting to note that station apparently shows monthly variations even though Singapore does not have distinct rainy or dry seasons. Heavy rainfall occurs from October to April and has a clear late afternoon peak around 7:00 -10:00 UTC (i.e., 15:00-18:00 SGT). During summer, the diurnal amplitude and hourly rainfall intensity decrease over the time and the timing of maximum rainfall advances in the morning (01:00 UTC). This could be due to the presence of the Intertropical Convergence Zone (ITCZ) which can trigger heavy rainfall in tropics. Bain et al (2011) found that the diurnal cycle of cloud top temperature (i.e., cloud height) is closely related with the one of rainfall within ITCZ. They also suggested that the late afternoon peak of high cloud (deep convective system) became more obvious when the ITCZ is more extensive. The ITCZ position over land also changes according to variations of the sun's zenith point. Since ITCZ is located over Singapore during winter season, heavier rainfall peaking in late afternoon is more pronounced over the months. To better understand seasonal variation, change of spatial rainfall patterns over the time are described in Appendix B.
While the satellite estimates are able to reproduce diurnal pattern in winter, they are incapable of capturing the timing of the rainfall maximum in summer. Both satellite estimates consistently show the late afternoon peak even though diurnal amplitude is reduced during summer season.
In order to understand the cause of such discrepancy, we calculate a dominant timing of the daytime satellite overpass in Singapore (1.38°N, 103.88°S) using the satellite observation time offered by TRMM (Fig. 4). Satellite sweeps Singapore mostly at 05:00-07:00 UTC (13:00-15:00 SGT) in daytime. Dominant overpass time does not have seasonal variations. Therefore, such differences may arise from observational sampling errors. Since the satellite took over the region intermittently, they cannot detect short-lived intense rainfall, especially at the rest of satellite overpass time. Although GSMaP uses the Kalman filtering to overcome the limited PMW revisit time, the method does not affect rainy pixel because it merely adjusts rain rate.
3.2. Uncertainty in extreme rainfall
To assess the uncertainty in extreme events, several precipitation indices are computed and compared (Fig. 4). In the R10mm and CWD, satellite data values are generally larger than rain gauge data. However, in cases of Rx1day, Rx5day and CDD, rain gauge data are larger than satellite data. It indicates that satellite estimations tend to overestimate the occurrence of light rain (about 10 mm) events and the length of wet spell, but underestimate the high Figure 2. Month-to-month variation of rainfall diurnal cycle derived from (a) station, (b) GSMaP and (c) TRMM TMPA-3B42. Unit is mm/hour.
Figure 3. Number of times when satellite observation time is greater than or equal to 30 minutes in three hourly time bins in Singapore.
rain rate and the length of dry spell. In particular, GSMaP does not estimate the magnitude of extreme precipitations observed by rain gauge, compared to TRMM. It can be explained by the difference of a merging algorithm. As aforementioned, GSMaP adopts Kalman filtering which can relatively offset the extreme values by averaging the forward- and backward-propagated PMW estimates [16, 17]
To investigate the robustness of such characteristics in space, the long-term indices are explored at every station (Fig. 5). In terms of Long-term Rx1day and 95th percentile, both satellite data cannot capture the extreme rainfall
observed at individual stations. In station observations, the amount of annual precipitation and frequency (wetdays) is less than that of satellite data but the rainfall intensity of rain gauge data is higher than other products. Satellite estimates, therefore, tend to overestimate the frequency of rain events compared to rain gauge data but underestimate rainfall intensity. That is, satellite-derived products estimate light rain (drizzle) frequently occurs but not torrential rains.
Figure 4. Annual-basis precipitation extreme indices averaged over Dec. 2000-Nov. 2010 in Singapore
4. Summary and Conclusion
The TRMM-based high resolution precipitation data TMPA-3B42 v7 and GSMaP v5.222, are assessed in terms of diurnal cycle and extreme precipitation at sub-daily scale. Satellite-borne products are able to capture the late afternoon maximum and heavier rainfall during winter season when ITCZ is located in Singapore. However, the diurnal cycles between satellite estimates and gauge precipitation show mismatch during the summer season. It is also seen from the analysis of extreme precipitation indices, the both satellite datasets tend to overestimate the light rain and frequency but underestimate high intensity precipitation and the length of dry spell over all stations. Overall, uncertainty of GSMaP is higher than TRMM in extreme case, possibly because the Kalman filter technique in the merging algorism can average the heavy precipitations.
Although the satellite data can capture the general precipitation behaviour at monthly and annual scales (Appendix A), both datasets fail at representing diurnal cycle in the summer season and extreme rainfall. There are plausible reasons for uncertainties at sub-daily scales. 1) High intensity precipitation has finer spatiotemporal scale than that of satellite products. 2) The individual satellite sensors have deficiencies in some respects. For instance, AMSU-B have disadvantage in addressing the oceanic light-precipitation and AMSR-E cannot often detect the non-convective precipitation over land [3, 16]. 3) Satellites do not pass over Singapore at the time of occurring high intensity rainfall. 4) The merging algorithm possibly induces to offset the extreme precipitation. 5) IR does not directly represent rainfall amounts, which is highly correlated with cloud top layers.
Comprehensive uncertainty characterization of satellite-derived rainfall products is important in various aspects. For instance, these biases in satellite data may distort interpretation of the precipitation’s behaviour as well as
Figure 5. Long-term precipitation extreme indices for the period of Dec. 2000-Nov. 2010 at 25 stations in Singapore
simulation results by propagating into the meteorological, crop and hydrological models. Furthermore, these results can help to improve on multi-satellite merging algorism as a reference.
This work on quantification of satellite data uncertainty is useful in many respects, especially that the satellite products can stand scrutiny overplaces/stations where there are no good data to be compared against. This has strong implications for climate model evaluations and when studying historical data and trends, given precipitation is the most sensitive climate variable used in many impact studies. As there are constant developments to such satellite data, improving our understanding in the physical mechanisms of rainfall are also key to understand climate and its change.
Appendix A. Uncertainties in monthly and seasonal scales
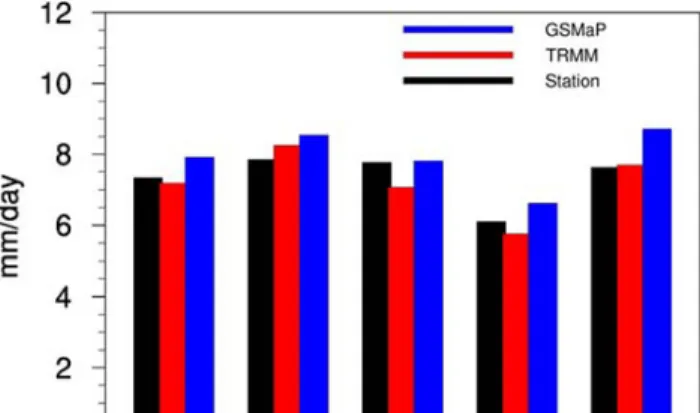
Figure A-1 shows monthly mean precipitation averaged over 10 years (December 2000 to November 2010) in Singapore. The satellite-borne precipitation can generally capture a temporal variation of rain gauge data in monthly time scale, although GSMaP has discrepancies in winter time. Figure A-2 presents long-term annual and seasonal mean precipitation derived from satellite-derived and ground-based rainfall. Observation shows no distinct seasons but relatively low rainfall in summer season. Satellite data are capable of estimating the seasonal- and annual-basis precipitation features appeared in station observation. Overall, satellite-derived precipitation agrees well against the gauge precipitation at coarser time scale.
Figure A-1. Long-term monthly mean precipitation (mm/day) derived from station (black solid line), TRMM TMAP-3B42 (red dashed line) and GSMaP (blue dotted line).
Figure A-2. Long-term annual and monthly mean precipitation (mm/day) derived from station (black), TRMM TMAP-3B42 (red) and GSMaP (blue).
Appendix B. Rainfall seasonal variation related with ITCZ
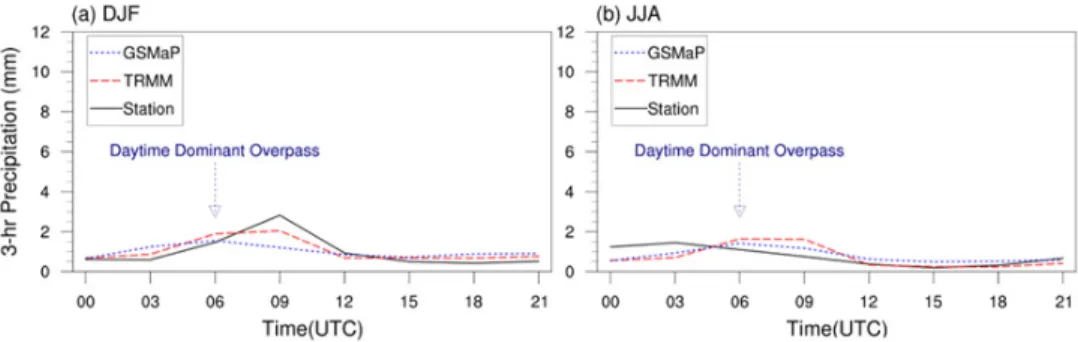
Figure B-1 shows the spatial distribution of DJF and JJA mean precipitation averaged over 10 years. The cloud belt related with ITCZ is located over Singapore in winter. In summer season, this shifts northwards according to the sun's zenith point. The movement can be clearly shown in Hovmöller diagram (Fig. B-2). Owing to ITCZ, Singapore has relatively abundant rainfall in winter. It can also affect the change of the maximum rainfall time and amplitude in the diurnal cycle (Fig. B-3).
Figure B-2. Hovmöller diagram for daily mean precipitation (mm/day) over the maritime continent (90°E -140°E)
Figure B-1. Mean precipitation (mm/day) over the Southeast Asia in (a) DJF and (b) JJA season
Figure B-3. Average 3-hour accumulated precipitation (mm) derived from station (black solid line), TRMM TMAP-3B42 (red dashed line) and GSMaP (blue dotted line) in (a) DJF and (b) JJA.
Acknowledgement
This research is supported by the National Research Foundation Singapore under its Campus for Research Excellence and Technological Enterprise programme. The Center for Environmental Sensing and Modeling is an interdisciplinary research group of the Singapore MIT Alliance for Research and Technology.
References
[1] Xavier, P., R. Rahmat, W. K. Cheong, and E. Wallace, 2014: Influence of Madden-Julian Oscillation on Southeast Asia rainfall extremes: Observations and predictability, Geophys. Res. Lett., 41, 4406–4412, DOI:10.1002/2014GL060241.
[2] Vaid B H, 2013: Numerical Simulations and Analysis of June 16, 2010 Heavy Rainfall Event over Singapore Using the WRFV3 Model Int. J. Atmos. Sci., 2013, 1-8, DOI: 10.1155/2013/825395
[3] Huffman, G. J., and Coauthors, 2007: The TRMM Multi-satellite Precipitation Analysis (TMPA): Quasi-global, multiyear, combined-sensor precipitation estimates at fine scales. J. Hydrometeor., 8, 38–55.
[4] Turk, F. J., and S. D. Miller, 2005: Toward improved characterization of remotely sensed precipitation regimes with MODIS/AMSR-E blended data techniques. IEEE Trans. Geosci. Remote Sens., 43, 1059–1069.
[5] Joyce, R. J., J. E. Janowiak, P. A. Arkin, and P. Xie, 2004: CMORPH: A method that produces global precipitation estimates from passive microwave and infrared data at high spatial and temporal resolution. J. Hydrometeor., 5, 487–503.
[6] Kidd, C. K., D. R. Kniveton, M. C. Todd, and T. J. Bellerby, 2003: Satellite rainfall estimation using combined passive microwave and infrared algorithms. J. Hydrometeor., 4, 1088–1104.
[7] Sorooshian, S., K-L. Hsu, X. Gao, H. Gupta, B. Imam, and D. Braithwaite, 2000: Evaluation of PERSIANN system satellite-based estimates of tropical rainfall. Bull. Amer. Meteor. Soc., 81, 2035–2046
[8] Aonashi, K., and Coauthors, 2009: GSMaP passive microwave precipitation retrieval algorithm: Algorithm description and validation. J. Meteor. Soc. Japan, 87A, 119–136.
[9] Chen, Y., E. E. Ebert, K. J. E. Walsh, and N. E. Davidson, 2013: Evaluation of TMPA 3B42 daily precipitation estimates of tropical cyclone rainfall over Australia, J. Geophys. Res. Atmos., 118, 11,966–11,978
[10] AghaKouchak, A., N. Nasrollahi, E. Habib, 2009: Accounting for Uncertainties of the TRMM Satellite Estimates. Remote Sens. 2009, 1, 606-619.
[11] Tan M. L., A. L. Ibrahim, Z. Duan, A. P. Creacknell, V. Chaplot, 2015: Evaluation of Six High-Resolution Satellite and Ground-Based Precipitation Products over Malaysia, Remote Sens. 2015, 7, 1504-1528.
[12] Vernimmen, R. R. E., A. Hooijer, Mamenun, E. Aldrian, A. I. J. M. van Dijk, 2012: Evaluation and bias correction of satellite rainfall data for drought monitoring in Indonesia, Hydrol. Earth Syst. Sci. 16, 133-146
[13] Jamandre and Narisma, 2013: Spatio-temporal validation of satellite-based rainfall estimates in the Philippines, Atmos. Res., 122, 599-608. [14] Wang W., H. Lu, 2015: Evaluation and hydrological applications of TRMM rainfall products over the Mekong river basin with a distributed
model, Geoscience and Remote Sensing Symposium (IGARSS), 2015 IEEE International. IEEE, 2015.
[15] Chokngamwong R., L.S. Chiu, 2008: Thailand daily rainfall and comparison with TRMM products, J. Hydrometeorol., 9, 256–266. [16] Turk F. J., P. Xian, 2013: An assessment of satellite-based high resolution precipitation datasets for atmospheric composition studies in the
maritime continent. Atmos. Res., 122, 579-598.
[17] Ushio T and Coauthors, 2009: A Kalman filter approach to the Global Satellite Mapping of Precipitation (GSMaP) from combined passive microwave and Infrared radiometric data, J. Meteorol. Soc. Jpn, 87: 137-151.
[18] Teo, C., T. Koh, J. C. Lo, B. C. Bhatt, 2011: Principal Component Analysis of Observed and Modeled Diurnal Rainfall in the Maritime Continent, J. Climate, 24, 4662-4675.