4688
Performance Analysis Of High Power PF
Corrector By Co-Simulation Using PSIM And
Matlab/Simulink
P.A. Kharade, Dr. M.D. Uplane
Abstract: Presently, circuit simulation in power electronics has become ever more demanding in both speed and accuracy. At the same time, as almost every simulator has its own pros and cons, co-simulations are becoming more prevalent. In this paper, an efficient high power AC to DC converter with power factor correction is analyzed based on co-simulation using PSIM and Matlab/Simulink Software. For the performance comparison, firstly a 5KW PFC converter and its control is realized with Boost and Interleaved Boost topology using PSIM software. In second phase, power circuit is realized using PSIM software, and the control circuit is implemented with Matlab/Simulink. Boost and Interleaved Boost topology PF converters are tested and analyzed using both the platforms and results are shown for comparison purposes. In order to regulate the output voltage and to improve input P F, a cascade controller is used, which is structured with a control toolbox in Matlab/Simulink, and validated through co-simulation with Sim-Coupler Module.
Index Terms: High power PFC converter, Boost, Interleaved Boost topology, PSIM, Matlab, Sim-Coupler Module, Co-Simulation ————————— ◆ ——————————
1
INTRODUCTION
In the present time, a large portion of the electronic devices uses DC power. Transformation of AC to DC is generally utilized in numerous applications, for example, Switched Mode Power Supplies, battery chargers, power supplies to
communication systems, washing machines,
air-conditioners, servers, and so on. Because of the presence of diodes, traditional rectifiers followed by large size capacitors for energy storage, goes about as a nonlinear burden to the power line, and the power factor of such circuits is exceptionally low, even lower than 0.7 [1]. Ordinary rectifiers have unpredictable and non-sinusoidal line currents infusing enormous measure of harmonic flow in line and polluting the power supplies. These low order line current harmonics distorts the voltage at the point of common coupling. Notwithstanding voltage mutilations, it likewise expands current evaluations of line, because of enormous flows warming of the types of the equipment, low efficiency, large size line filtering requirement are a portion of the downsides. Therefore to keep away from every one of these results and to improve power quality according to the universal IEC Standards, an appropriate power factor corrector must be utilized [5]. In this paper, two fundamental converter topologies, boost, and interleaved boost are investigated and compared for improving PF, THD and efficiency in single-phase power supply. The two topologies are operated at switching frequency 100 KHz with 5KW output power and 400V output DC voltage to give THDi under 5%, efficiency more prominent than 98% and PF near to unity [6],[11]. The number of active and passive circuits was utilized by numerous analysts/researchers to address this issue [2], [3].
The least complex methodology is to utilize passive PFCs,
which improves power factor to some degree satisfactory level. Out of the solutions available in literature, passive PFCs are effective for low power applications most noteworthy up-to 200W. Hindrances/drawbacks of passive PFCs are huge in size, critical reliance of average output voltage on load change, and are all the more
exorbitant/costly. To resolve/determine this issue
active/dynamic PFCs were recommended by many researchers [4], [12], [14]. In general, a power electronics system comprises of the power circuit and a suitable control system. For the modeling of electronic circuits, a variety of software packages such as a PSpice, PSIM and SABER, etc. are available. However, these packages are not appropriate for demonstrating complex controllers. On the other hand, Matlab/Simulink is a very powerful program for control framework configuration however, isn't appropriate for precise modeling of power electronics circuit behavior. Along these lines, to simulate the complete/entire power electronic system, the simulation environments should be interfaced together to obtain simulation results as close as possible to the actual system behavior, in this manner empowering the designer to quickly identify and correct undesirable interactions between the power circuit and the control system, resulting more accurate results in a shorter settling time. The co-simulation tool is a very important tendency in power electronics simulation that allows relying on the merits of two powerful environments in a complementary way to improve the efficiency of a stand-alone PFC converter system. Simulink as a powerful environment for system modeling- simulation and PSIM as a widely used software in many areas, and it is characterized by a friendly simulation environment and powerful waveform processing [21]. The rest of the paper is organized as follows: Section 2 presents a circuit parameters and its design, and covers theory of boost
dc-dc converter of the PFC system. Section 3 discusses on
PSIM simulation and Co-Simulation in term of their structures and improvements. Simulation work including the results is discussed in Section 4. Finally, a simple conclusion is given in Section 5.
2
CIRCUIT
PARAMETERS
AND
ITS
DESIGN
————————————————
• P.A. Kharade, Department of Technology, ShivajiUniversity, Kolhapur- 416004, India. PH- +91 9594649029 Email - [email protected]
2.1 PFC Converter:
The block diagram of the PFC converter is shown in Fig.1. Power converter uses a diode rectifier followed by a bulk capacitor to convert AC voltage to DC voltage, followed by a boost converter that acts as an active PF corrector. For controlling the output voltage and correcting the input power factor, the DC output voltage, input AC current, and input ac voltage are given as a feedback signals to the controller. The controller has its own reference levels and according to the error it manipulates the actuating signals and provides the gate signals to the active device MOSFETs to control the output voltage and input power factor.
The key circuit parameters and specifications:
Vin(t) = 180V~265VACrms
Vo = 400VDC ± 5% Po = 5000W, Fs = 100KHz Lin = 520μH, Co = 1410μF
where Vin(t) is the Universal AC input-rms voltage, Vo is the regulated output DC voltage, Po is the desired output power, Fs is the switching frequency of the active devices, Lin is the boost inductor, Co is the output capacitor.
2.2 Controller :
CONTROL STRATEGY FOR PROPOSED BOOST TOPOLOGY: The proposed boost PFC converter embraces/adopts average current control, and use the voltage control loop and current control loop, as shown in Fig.2. There are different current mode control techniques like variable frequency Peak current control, Hysteresis control, and average current control. Out of which average current control shows better outcomes. It is more desired than other control methodologies since line current can be approximated by the average of current per switching cycle [7],[14]. For regulation of output voltage and simultaneously correction of power factor here, cascade control is utilized. The utmost aim of the controller is to force the inductor current, i.e. input current of the boost converter to follow accurately a given reference current. Cascade control comprises of the outer loop, and a inner loop. Outer voltage loop keeps up the output voltage steady and inner current loop plays the
technique, gate signals are generated, which actually controls the duty cycle of the active devices. The design of boost inductor is important/ crucial for PFC converter; inductor is designed at a minimum input voltage of the circuit and for minimum ripple current in the input. The output capacitor for the converter is selected as per the requirement of hold up time i.e. energy storage capacity of it, lower and higher limits of output voltage, and the load power [8], [9],[10].
Fig.2: Average current control Strategy for Boost Converter.
3
PSIM
S
IMULATION:
To assess /evaluate and compare the performance of the boost and IBC type PFC converters, 5000W models are simulated using PSIM software and with PI current control method [17], [18].PFC by Average Current Control using simple Boost Topology
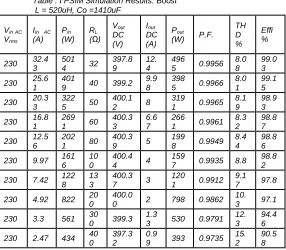
Table : I PSIM Simulation Results: Boost L = 520uH, Co =1410uF
Vin AC
Vrms
Iin AC
(A) Pin (W) RL (Ω) Vout DC (V) Iout DC (A) Pout
(W) P.F. TH D %
Effi %
230 32.4
3
501
4 32
397.8 9
12. 4
496
5 0.9956
8.0 8
99.0 3
230 25.6
1
401
9 40 399.2
9.9 8
398
5 0.9966
8.0 1
99.1 5
230 20.3
3
322
5 50
400.1
2 8
319
1 0.9965
8.1 9
98.9 3
230 16.81 2691 60 400.33 6.67 2661 0.9961 8.32 98.87
230 12.5
6
202
1 80
400.3
9 5
199
8 0.9949
8.4 4
98.8 6
230 9.97 161
6 10 0
400.4
4 4
159
7 0.9935 8.8
98.8 2
230 7.42 122
8 13 3
400.3
7 3
120
1 0.9912
9.1
7 97.8
230 4.92 822 20
0
400.0
0 2 798 0.9862
10.
3 97.1
230 3.3 561 30
0 399.3
1.3
3 530 0.9791
12. 3
94.4 6
230 2.47 434 40
0
397.3 2
0.9
9 393 0.9735
15. 2
4690
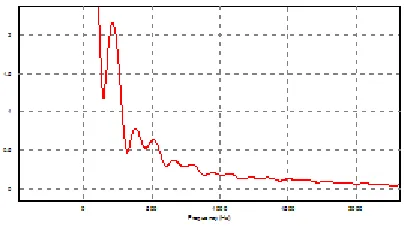
PSIM Simulation Model of Boost Converter is shown in Fig.3.The AC input voltage-current waveforms and DC output voltage-current waveforms of boost converter are shown in Fig. 4. And the waveforms of Fast Fourier Transform (FFT) of ripple current in a boost converter are shown in Fig. 5. The rectified AC input is boosted using a boost converter. For closed-loop operation in real-time implementation input voltage, inductor current and output voltage will be sensed using current transformer and potential transformer. The converters are operated/ worked at 100 kHz switching frequency, 5000W output power with the reference voltage of 400V, and the load resistor RL is varied from 400ohms to 32 ohms by keeping the AC input voltage 230Vrms constant. Simulation results of the Boost topology with PSIM are shown in Table I.
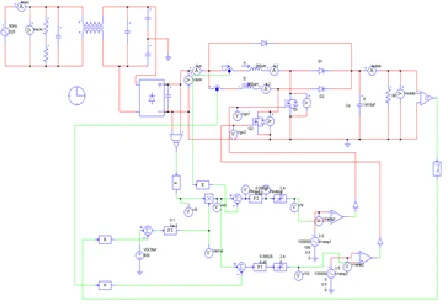
Fig.3: PSIM Simulation Model of Boost Converter.
Fig.4. Input-Output Waveforms of Boost Converter
Fig. 5. FFT Analysis of ripple current in Boost Converter
PFC by Average Current Control using Interleaved Boost Topology:
In ordinary boost topology, the volume of inductor is enormous and a ripple current cancellation is not possible. These limitations can be overpowered by the usage of interleaved boost converter (IBC). IBC contains of two boost converters connected in parallel, operating at 180° phase shift. The input current is the addition of two inductor currents. As the ripple currents flowing in two inductors are out of phase, they tend to cancel each other, and so total harmonics in the input side is reduced. At 50% duty cycle, the cancellation of ripple current is the most ideal [15]. Fig.6 shows the PSIM simulation model of the IBC converter. The results of simulation using PSIM are given in Table II. The AC input voltage-current waveforms and DC output voltage-current waveforms of interleaved boost converter are shown in Fig.7. And the waveforms of Fast Fourier Transform (FFT) of ripple
current in a boost converter are shown in Fig. 8. The
reduction in THD, and improvement in power factor, and improvement in overall efficiency is shown in Fig.9a, Fig 9b and Fig. 9c respectively.
Table : II PSIM Simulation Results: IBC Interleaved Boost L1 =L2= 520uH, Co = 1410uF
VinAC
Vrms
Iin AC
(A) Pin
(W) RL
(Ω) V(V) out DC Iout DC
(A) Pout
(W) P.F.
THD %
Effi %
230 31.57 5064 32 397.16 12.4 5003 0.9937 1.87 98.79
230 25.25 4052 40 398.33 9.95 4000 0.997 2.12 98.72
230 20.27 3239 50 399 7.98 3199 0.9986 2.48 98.74
230 16.93 2682 60 398.35 6.66 2664 0.9993 2.76 99.34
230 12.77 2032 80 399.41 4.99 1996 0.9993 3.46 98.23
230 10.18 1630 100 399.2 3.99 1593 0.9984 4.62 97.72
230 7.7 1233 133 398.21 2.99 1192 0.9965 6.12 96.63
230 5.25 845 200 393.68 1.97 775 0.9917 9.97 91.75
230 3.52 568 300 398.66 1.32 530 0.9815 11.9 93.05
Fig.6. PSIM Simulation Model of IBC Converter.
Fig. 7. Input-output waveforms of IBC Converter
Fig.8. FFT Analysis of ripple current in IBC Converter
Fig.9a. THD versus output power for Boost and IBC
Fig.9b. PF versus output power for Boost and IBC (PSIM Simulation)
Fig.9c. Efficiency versus output power for Boost and IBC (PSIM Simulation)
4 CO-SIMULATION USING PSIM AND
Matlab/Simulink :
4692
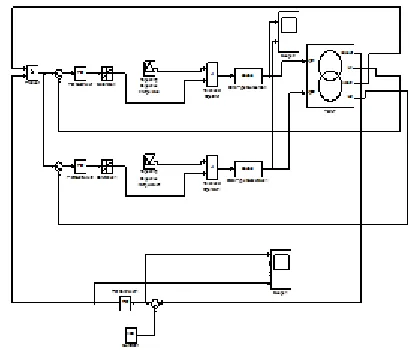
To accomplish /achieve this co-simulation, SimCoupler has three modules as shown in Fig .10. SimCoupler model block, SLINK_IN, and SLINK_OUT. SLINK_IN is input port gets signals from Simulink, SLINK_OUT is output port yields/gives signals to Simulink and the SimCoupler model block, interconnects with the other part through input and output port. Fig.11. Shows the co-simulation of the boost converter. So we are using the capabilities of the two powerful soft-wares in a complementary way [20]. Observations and results of the co-simulations of both the converters are compiled in Table III and Table IV.
Fig. 11a: Control Circuit for Co-simulation of Boost with PSIM and Matlab.
Fig. 11b: Power circuit for Co-simulation of Boost with PSIM.
The co-simulation of Interleaved Boost Converter (IBC) with PSIM and Matlab/Simulink by the use of SimCoupler block is as shown in Fig.12a and Fig.12b. The results of co-simulation are given in Table 4. The reduction in THD, improvement in power factor, and improvement in the overall efficiency of the IBC converter is given Fig.13a, Fig.13b and Fig.13c, respectively.
Fig. 12a: Control Circuit for Co-simulation of IBC with PSIM and Matlab.
Fig.12b. Power circuit for Co-simulation of Interleaved Boost with PSIM.
Table : III Co- Simulation Results: Boost L = 520uH, Co = 1410uF
VinAC
Vrms
Iin AC
(A) Pin
(W) RL
(Ω) V(V) out DC Iout DC
(A) Pout
(W) P.F.
THD %
Effi %
230 29.69 4996 32 399.06 12.5 4892 0.9922 9 98.05
230 22.68 3768 40 390.91 9.77 3754 0.9915 9.2 99.61
230 20.12 3219 50 399.91 7.99 3166 0.9914 9.3 98.36
230 16.26 2705 60 401.17 6.69 2667 0.9908 9.58 98.59
230 12.69 2033 80 400.68 5 1994 0.9894 10.5 98.07
230 9.4 1605 100 401.27 3.99 1589 0.9875 11.5 97.65
230 6.99 1237 133 401.49 3.01 1206 0.984 13.4 97.52
230 5.19 828 200 401.25 2 803 0.9748 18.2 96.98
230 3.33 560 300 406.4 1.35 551 0.9552 26.7 98.93
Table No.IV Co- Simulation Results: IBC Interleaved Boost L1 =L2= 520uH, Co = 1410uF
VinAC
Vrms
Iin AC
(A) Pin
(W) RL
(Ω) Vout DC
(V)
Iout DC
(A)
Pout
(W) P.F.
THD %
Effi %
230 31.21 5048 32 396.68 12.4 4985 0.9943 3.67 99.76
230 25.14 4031 40 398.32 9.97 4008 0.9968 4 99.43
230 20.2 3238 50 400.6 8.02 3222 0.9982 4.25 99.52
230 16.82 2694 60 400.69 6.67 2681 0.9987 4.4 99.52
230 12.61 2030 80 400.83 5.02 2020 0.9988 4.76 99.46
230 10.03 1616 100 400.36 4 1602 0.9982 5.05 99.09
230 7.55 1218 133 400.22 3 1203 0.9968 6.17 98.71
230 5.49 852 200 399.98 1.99 799 0.9952 8.38 97.69
230 3.97 586 300 398.33 1.33 528 0.9911 12.1 95.07
230 2.96 447 400 399.9 0.999 403 0.9867 19.9 93.58
Fig.13a. THD versus output power for Boost and IBC (PSIM-Matlab Co-Simulation)
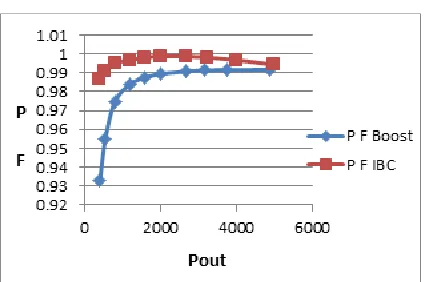
Fig.13b. PF versus output power for Boost and IBC (PSIM-Matlab Co-Simulation)
5 CONCLUSION
In this paper, high power 5KW PFC converters with Boost and Interleaved Boost topology are modeled using PSIM and Matlab/Simulink. Two platforms are interfaced using SimCoupler Module. The performance of the converter by purely PSIM simulation and by co-simulation, using PSIM and Matlab/Simulink are examined to demonstrate their advantages and disadvantages. From co-simulation it is clear that the power circuit can be easily simulated in a PSIM environment, whereas Matlab/Simulink is very much suitable for Controller implementation. It is observed that, compared to boost topology, THD in interleaved boost topology converter is less and acceptable as per IEC-61000-3-2 standards. Even though the implementation of the controller using Matlab/Simulink is convenient, but co-simulation takes more time to settle down the output voltage. By analyzing the results, we can conclude that the IBC topology gives PF nearer to unity with a reduction in THD.
6
ACKNOWLEDGMENT
The authors gratefully acknowledge the technical support rendered by Mr. Mayur Gujarati from A Z Electronics, Pune and all the colleagues, for this research work.
7
REFERENCES
[1] Compliance Testing to the IEC1000-3-2
(EN61000-3-2) and IEC1000-3-3 (EN 61000-3) Standards, Application Note 1273,Hewlett Packard Co.,December 1995.
[2] Oscar Gracia, Jose A. Cobos,Robert Prieto, and
JavierUceda, “Single-Phase Power Factor Correction: A Survey” IEEE Transactions on Power Electronics, Vol. 18,No3, pp-749-755, May 2003.
[3] Bhim Singh, Sanjeev Singh, Ambrish Chandra,
Kamal Al-Haddad, “Comprehensive Study of Single-Phase AC-DC Power Factor Corrected Converter with High-Frequency Isolation” IEEE Transactions on Industrial Informatics, vol.7, No.4, pp 540-556, Nov.2011.
[4] L.Umanand, “Power Electronics Essentials and
Applications,” Wiley India Pvt. Ltd ,pp 201-213,2013.
[5] Mohammad Ahmad, Sheeraz Kirmani,
“Harmonics Analysis of A SPV based stand-alone and Grid-connected Multilevel Inverter with improved power quality at different load” International Journal of Scientific & Technology Research, Vol.8,Issue 10,pp152-160, October 2019.
[6] B. A. Miwa, D. M. Otten, M. E. Schlecht,
“High-Efficiency Power Factor Correction Using
Interleaving Techniques” proceeding of
APEC'92, Applied Power Electronics
Conference and Exposition, pp: 557 – 568,
February 1992.
4694
[8] Z. Yongchang, Z. Zhengming, Baihua, Y.
Liqiang Z.Haitao, “PSIM and SIMULINK Co-simulation for Three-level Adjustable Speed Drive Systems”, IEEE IPEMC 2006, volume 1, pp. 1 – 5, (2006).
[9] P.A.Kharade, R.Rashmi, M.D.Uplane, “P F
Improvement in Single-Phase High Power Rectifiers with Interleaved Boost Topology,” IEEE International Conference on Power,
Control, Signals and Instrumentation
Engineering, ICPCSI, Chennai, India. Issue I, pp 153-159, September 2017.
[10]M.Rashid, “Power Electronics Handbook,” 2nd
Edition, Prentice-Hall, pp 167- 185.2001.
[11]J. Liu, W. Chen, J. Zhang, D. Xu, and F.C. Lee,
“Evaluation of power losses in different CCM mode single-phase boost PFC converters via simulation tool,” IEEE Industry Applications Conf. (IAS) Record, Session: High-frequency power conversion, Paper 4, Sep. 2001.
[12]Pandey, B. Singh, D. P. Kothari, “Comparative
Evaluation of Single-phase Unity Power Factor ac-dc Boost Converter Topologies,” proceeding of IE (I) Journal-EL, pp 102-109, vol 85. September 2004.
[13]Burak Akın, “Comparison of Conventional and
Interleaved PFC Boost Converters for Fast and Efficient Charge of Li-ion Batteries Used in Electrical Cars,” 2012 International Conference on Power and Energy Systems Lecture Notes in Information Technology, Vol.13.
[14]M.Arun Devil, K.Valarmathi, R.Mahendran,
“Ripple Current Reduction in Interleaved Boost
converter by Using Assdvanced PWM
Techniques” IEEE International Conference on Advanced Communication Control and Computing Technologies (ICACCCT), 2014.
[15]Matlab/Simulink user guide, 2008.
[16]M. O. Faruque, V. Dinavahi, M. Steurer, A. Monti,
K. Strunz, J. A. Martinez, G. W. Chang, J. Jatskevich, R. Iravani, and A. Davoudi, “Interfacing issues in multi-domain simulation tools,” IEEE Trans. on Power Del., vol. 27, no. 1, pp. 439-448, 2012.
[17]“PSIM user guide,” Powersim Inc., Jun. 2003.
[18]Y. Cho, “A Low-Cost Single-Switch Bridgeless
Boost PFC Converter,” International Journal of Power Electronics and Drive System (IJPEDS), vol. 4, no. 2, pp. 256-264, Jun. 2014.
[19]S. Khader, A. Hadad, and A. A. Abu-aisheh, “The
application of PSIM & MATLAB/SIMULINK in power electronics courses,” IEEE Global Eng. Education Conf., pp. 118-121, Apr. 2011.
[20]“Tutorial on how to use the SimCoupler Module,”
Powersim Inc., 2009.
[21]Wentao Wang, Wenying Yang, Venkata