Archive University of Zurich Main Library Strickhofstrasse 39 CH-8057 Zurich www.zora.uzh.ch Year: 2014
Integrating cross-scale analysis in the spatial and temporal domains for
classification of behavioral movement
Soleymani, Ali ; Cachat, Jonathan M ; Robinson, Kyle ; Dodge, Somayeh ; Kalueff, Allan V ; Weibel, Robert
Abstract: Since various behavioral movement patterns are likely to be valid within different, unique ranges of spatial and temporal scales (e.g., instantaneous, diurnal, or seasonal) with the corresponding spatial extents, a cross-scale approach is needed for accurate classification of behaviors expressed in movement. Here, we introduce a methodology for the characterization and classification of behavioral movement data that relies on computing and analyzing movement features jointly in both the spatial and temporal domains. The proposed methodology consists of three stages. In the first stage, focusing on the spatial domain, the underlying movement space is partitioned into several zonings that correspond to different spatial scales, and features related to movement are computed for each partitioning level. In the second stage, concentrating on the temporal domain, several movement parameters are computed fromtrajectories across a series of temporal windows of increasing sizes, yielding another set of input features for the classification. For both the spatial and the temporal domains, the “reliable scale” is determined by an automated procedure. This is the scale at which the best classification accuracy is achieved, using only spatial or temporal input features, respectively. The third stage takes the measures from the spatial and temporal domains of movement, computed at the corresponding reliable scales, as input features for behavioral classification. With a feature selection procedure, the most relevant features contributing to known behavioral states are extracted and used to learn a classification model. The potential of the proposed approach is demonstrated on a dataset of adult zebrafish (Danio rerio) swimming movements in testing tanks, following exposure to different drug treatments. Our results show that behavioral classification accuracy greatly increases when firstly cross-scale analysis is used to determine the best analysis scale, and secondly input features fromboth the spatial and the temporal domains of movement are combined. These results may have several important practical applications, including drug screening for biomedical research.
DOI: https://doi.org/10.5311/JOSIS.2014.8.162
Posted at the Zurich Open Repository and Archive, University of Zurich ZORA URL: https://doi.org/10.5167/uzh-101007
Journal Article Published Version
Soleymani, Ali; Cachat, Jonathan M; Robinson, Kyle; Dodge, Somayeh; Kalueff, Allan V; Weibel, Robert (2014). Integrating cross-scale analysis in the spatial and temporal domains for classification of behavioral movement. Journal of Spatial Information Science, (8):1-25.
RESEARCHARTICLE
Integrating cross-scale analysis in
the spatial and temporal domains
for classification of behavioral
movement
Ali Soleymani
1, Jonathan Cachat
2, Kyle Robinson
2, Somayeh
Dodge
3, Allan V. Kalueff
4, and Robert Weibel
11Department of Geography, University of Z ¨urich, Z ¨urich, Switzerland 2
Neuroscience Program, Tulane University Medical School, New Orleans, LA, USA
3Department of Geography and Environmental Studies, University of Colorado, Colorado Springs,
CO, USA
4International Zebrafish Neuroscience Research Consortium (ZNRC) and ZENEREI Institute,
Slidell, LA, USA
Received: December 10, 2013; returned: April 19, 2014; revised: May 22, 2014; accepted: May 28, 2014.
Abstract: Since various behavioral movement patterns are likely to be valid within differ-ent, unique ranges of spatial and temporal scales (e.g., instantaneous, diurnal, or seasonal) with the corresponding spatial extents, a cross-scale approach is needed for accurate clas-sification of behaviors expressed in movement. Here, we introduce a methodology for the characterization and classification of behavioral movement data that relies on comput-ing and analyzcomput-ing movement features jointly in both the spatial and temporal domains. The proposed methodology consists of three stages. In the first stage, focusing on the spatial domain, the underlying movement space is partitioned into several zonings that correspond to different spatial scales, and features related to movement are computed for each partitioning level. In the second stage, concentrating on the temporal domain, several movement parameters are computed from trajectories across a series of temporal windows of increasing sizes, yielding another set of input features for the classification. For both the spatial and the temporal domains, the “reliable scale” is determined by an automated procedure. This is the scale at which the best classification accuracy is achieved, using only spatial or temporal input features, respectively. The third stage takes the measures from the spatial and temporal domains of movement, computed at the corresponding reliable
scales, as input features for behavioral classification. With a feature selection procedure, the most relevant features contributing to known behavioral states are extracted and used to learn a classification model. The potential of the proposed approach is demonstrated on a dataset of adult zebrafish (Danio rerio) swimming movements in testing tanks, follow-ing exposure to different drug treatments. Our results show that behavioral classification accuracy greatly increases when firstly cross-scale analysis is used to determine the best analysis scale, and secondly input features from both the spatial and the temporal domains of movement are combined. These results may have several important practical applica-tions, including drug screening for biomedical research.
Keywords:cross-scale movement analysis, spatial scaling, temporal scaling, movement pa-rameters, machine learning, zebrafish swimming, behavioral pharmacology, drug screen-ing
1
Introduction
Understanding behavioral dynamics of moving objects is becoming the focus of many re-searchers in various fields of GIScience. Discovering latent information about behaviors of objects from raw movement data, typically comprised of a series of time-stamped fixes, needs more sophisticated approaches to improve characterizing different behavioral states. Fix-based measures, further referred to as movement parameters (MPs, e.g., speed, accel-eration, or turning angle), have been used to assess the key characteristics describing the movement of objects [5, 6]. However, the primary interest of studying MPs in movement analysis is in characterizing different behavioral states and investigate how they change over time [30]. Since movement occurs in space and time, exploration of both the under-lying spatial extent and the relevant temporal characteristics of movement processes are needed to understand the fundamental behavioral mechanisms. Additionally, the scale at which the data is analyzed is an important determinant for behavioral characterization of movement data. Since different behavioral patterns and processes are likely to be valid within their own unique range of spatial and temporal scales, understanding the func-tional hierarchy underlying movement processes necessitates investigation of movement mechanisms and patterns across multiple spatiotemporal scales [26].
On the other hand, from the extensive literature in this field, “it is clear that scale is a problematic issue in many sciences, notably those that study phenomena embedded in space and time” [12]. In areas outside movement analysis, it has been demonstrated that the understanding of observed phenomena requires the elucidation of mechanisms inter-twining pattern and scale, as well as exploring how the information is transformed from fine scales to coarse scales, and back [24]. In movement analysis, scale is both a spatial and a temporal property, and these two properties may reflect the trajectory data or the space of the movement process. The spatial separation of observation points along a movement trajectory affects the temporal sampling granularity, and vice versa [22]. However (as the review of the pertinent literature in the following section will show), there is little evidence of cross-scale analysis of movement data, compared to an abundance of studies restricted to single scales. One reason for this knowledge gap may be because data complexity can be expected to increase significantly when multiple scales are introduced. Additionally, inter-pretation and evaluation of patterns emerging at different scales need considerable
discus-sions, and may benefit from engagement between the developers of the analysis methods and the domain experts.
As a definition, cross-scale analysis of movement data refers to methods and algorithms capable of investigating the relationships between patterns and processes that occur at mul-tiple spatial and/or temporal scales, respectively. The main prerequisite for such an analy-sis is the availability of highly granular data, which is facilitated through recent advances in tracking technologies, such as global positioning system (GPS) or indoor video-tracking systems. As these technologies are becoming less expensive, large data volumes can cap-ture the movement trajectories of many individual objects over long time periods at fine temporal granularities. However, we posit that in order to extract behaviors from such high-resolution data, a cross-scale analysis approach is needed. Alternatively, confining the analysis scale to the original temporal granularity of movement data forces all data analysis to be scale-specific as well [22], which can be too constraining. Importantly, the movement processes that comprise a behavioral state emerge from cross-scale interactions generating these behaviors, and cannot be predicted based on observations at single or multiple independent scales. Therefore, cross-scale exploration of patterns and relation-ships in movement analysis is needed in order to yield cross-scale behavioral clues.
This article makes contributions in two areas. We improvecross-scale analysisof move-ment behavior by proposing a comprehensive methodology based for integrating measures from coordinated spatial and temporal granularities to yield a holistic picture of movement behavior at different levels of scale. Furthermore, we demonstrate the use ofmachine learn-ing(ML) to aid cross-scale movement analysis, in response to the need for efficient methods to capture cross-scale effects represented in movement data. We provide a procedure that uses ML to establish the spatial and temporal scales at which movement parameters can be reliably measured and the classification performance is optimized. Based on the learned patterns, the proposed approach can be useful for classifying unknown trajectories into user-defined movement classes (based on training data with known labels).
As a case study, developed in collaboration with a neuropharmacology research group, the potential of the proposed methodology is demonstrated on a video-tracking dataset of movement of adult zebrafish (Danio rerio), a rapidly emerging novel animal model for translational biomedical research, drug screening and therapeutic target detection [2, 7, 35]. In our training dataset, the fish were exposed to different drug classes, composed of anxio-genic (stress/anxiety-inducing) and anxiolytic (stress/anxiety reducing) drug treatments. Based on the nature of these drug treatments, the fish display a distinct set of movement variations, traversing different parts of the tank, and ultimately representing different em-pirically established behavioral states [2,3]. We aim to delineate these differences by first di-viding the tank arena into several spatial zones, and then by computing movement param-eters (e.g., speed, acceleration, turning angle, meandering, sinuosity) at different temporal windows. Therefore, since the applied measures are calculated across different spatial and temporal scales, the extracted feature sets can uniquely describe the behavioral patterns of the zebrafish.
The remainder of this article is organized as follows: Section 2 examines the state-of-the-art of movement pattern analysis using cross-scale methods (e.g., in GIScience, ecology and neuropharmacology). Furthermore, a review of studies using ML to aid cross-scale movement data analysis is included in this section. Section 3 provides a detailed overview of the analysis approach employed in this study. The case study on zebrafish data is ex-plained in Section 4, and the corresponding results are presented in Section 5. Section 6
provides the interpretation and discussion of the findings of this study, and Section 7 offers concluding remarks and suggestions for future research.
2
State-of-the-art
In the context of this paper, we restrict our review to previous research in two different ar-eas: (1) cross-scale analysis of movement data and (2) machine learning methods in move-ment analysis.
2.1
Cross-scale analysis of movement data
While the literature on cross-scale analyses of movement data is sparse, their importance has been recognized in an increasing number of studies. In animal ecology, for example, methods for inferring behaviors and changes in behaviors within the movement trajectories of animals have become increasingly popular in recent years. Fryxell et al. [10] review several studies investigating animal movement at three different spatio-temporal scales (coarse-scale, intermediate-scale, and fine-scale). Postlethwaite et al. [30] discuss popular examples that are capable of addressing scale issues in animal movement data, including Markov models, Bayesian fitting techniques, and wavelet-based approaches. However, most such cross-scale studies focus on an ecological perspective, restricted to specific data sources and to answering specific research questions.
The work by Laube and Purves [22] is probably the most relevant research in GIScience for developing a methodological perspective of cross-scale movement analysis. They pro-posed a general approach for investigating to what degree movement parameters such as speed, sinuosity, or turning angle do vary when derived at variable temporal scales. How-ever, in cases when spatial scaling is also critical, such an approach may not be ideal due to its exclusive focus on the temporal domain. Dodge et al. [5] also used features captured at global and local levels of trajectories for automatic movement mode detection. Global fea-tures relate to the level of the entire trajectory, while local ones are at the level of segments of homogeneous movement characteristics. Recently, Postlethwaite et al. [30] introduced a new multi-scale measure, the multi-scale straightness index (MSSI), for analyzing animal movement data. MSSI is used for classifying sequential sub-sections of individual trajec-tories into different behavioral states and for evaluating how behavior (expressed within trajectories) varies over different temporal scales. In neuroscience, multi-scale analysis of movement data has also attracted the attention of researchers, especially in the field of drug discovery. For example, Kafkafi et al. [21] used path texture as a behavioral measure for characterizing path curvature of mice moving in an open-field arena across several spatial scales. They showed how this measure can be used for distinguishing different drug treat-ments within the same drug type (i.e., serotonin agonists). The same group [20] in another study used a data mining approach calledpattern array(PA) to analyze mouse open-field behavior and characterize the psychopharmacological effects of three drug classes: psy-chomotor stimulant, opioid, and psychotomimetic.
The review of the above-mentioned methods reveals the strong potential of cross-scale analysis of movement data. However, there is still a need for a more comprehensive cross-scale methodology that can simultaneously incorporate both the spatial and temporal di-mensions of movement data, applicable to different domains of movement research. Thus,
in Sections 3 and 4, we show that in addition to varying the temporal scale, partitioning the underlying space also facilitates the extraction of relevant patterns.
2.2
Machine learning (ML) in movement analysis
In this study, we explore ML and its capacity to aid cross-scale movement analysis. Tradi-tional movement pattern recognition algorithms cope well with large data volumes. How-ever, many studies that employ such deterministic techniques are based on data sources limited to specific scales (and, therefore, less generalizable for other applications). Thus, more sophisticated approaches are needed in response to the needs of movement behavior analysis, and ML can offer a potential avenue for that, as a review of the pertinent liter-ature shows. Examples range from using Bayesian networks and decision trees to study the migration of birds [14], to the use of support vector machines (SVMs) for categorizing behaviors of tracked lab animals such as rats [9], movement of cows [25], and analysis of the movement of caribou using hidden Markov models (HMMs) [8]. Hu et al. [17] used self-organizing maps (SOMs) for learning the pattern of motion trajectories among pedes-trians and making predictions about vehicle movement in transportation studies. Torrens et al. [36] used ML for benchmarking an agent-based simulated pedestrian’s relative be-havior in indoor and outdoor scenes. In biology, ML methods such as SVM have been used for trajectory segmentation to identify distinct types of human adenovirus motion in host cells [16], classifying trajectories of moving keratocyte cells [32], and for automated recognition of movement patterns using gait data [1].
Here, we apply two functionalities of ML for cross-scale movement analysis. A feature selection procedure is used to determine the most relevant movement variables with input parameters captured at different temporal and spatial scales and then, based on the selected features, a classification model is built using SVM to classify the trajectory data into user-defined data classes.
3
Methodology
“Scale” has many meanings, but in GIS two are of greatest significance: resolution and extent [12]. For movement data, the intertwining notions of spatial and temporal scales make the interpretation of scale even more complex. Focusing on the quantitative repre-sentation and classification of movement, we explore “scale” both in terms of “temporal resolution/granularity” and the “spatial extent.”
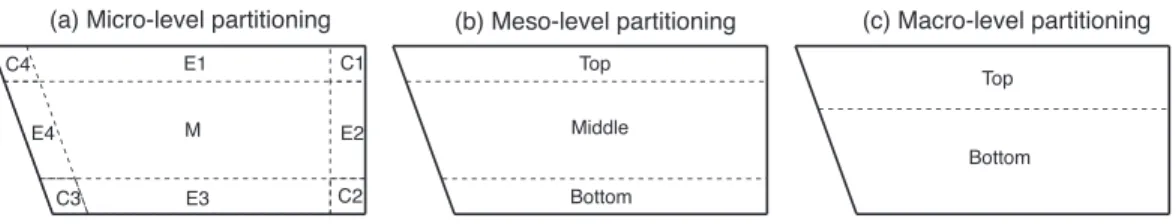
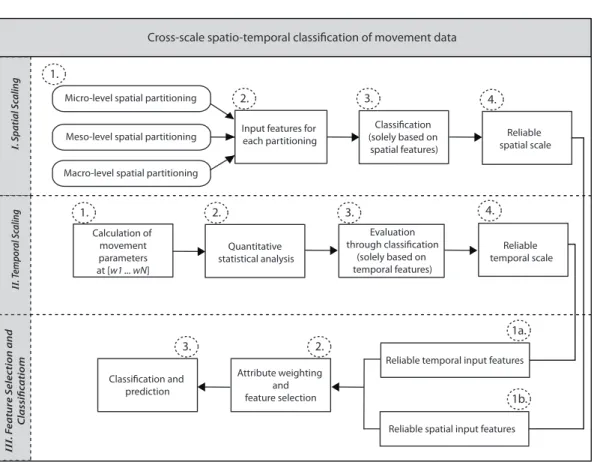
The methodology proposed here consists of three stages (Figure 1). First, for scaling in the spatial domain, the underlying movement space is partitioned into several zones. This procedure is automated to decide on the extent of the partitioned zones at different levels. For each moving object, several parameters (corresponding to different zones) can be calculated, and considered as input features in the classification model. In the second stage, values of movement parameters are calculated across different temporal window sizes, based on the approach proposed by Laube et al. [22]. In both these stages, the set of extracted variables (spatial or temporal, respectively) are evaluated based on their con-tribution to the improvement of classification accuracy. At the same time, the “reliable analysis scale” (i.e., the scale range at which movement parameters can be reasonably and reliably calculated) is determined to improve the accuracy and precision of the prediction
models. In the third stage, measures from the spatial and temporal domains of movement are used as input features for classification. With a feature selection procedure, the most relevant features contributing to known behavioral states are extracted and used to learn a classification model.
We will now introduce the three stages of the methodology in the following three sub-sections. The overall flow of the methodology is summarized in Figure 1 (in further text, we use Roman numerals to denote the three stages, and Arabic numerals to denote the individual steps within each stage).
3.1
Stage I: Spatial scaling
In Step I.1 of our proposed methodology, subdivision of the underlying spatial domain into different zones, and changing their size, are used to investigate spatial scaling. The resulting zones after spatial tessellation are considered as the fundamental extent of the spatial domain. The impact of aggregation and zoning in the analysis of aggregate spatial data has been already well-addressed, through the modifiable areal unit problem (MAUP) [27, 34]. The two components of the MAUP include scale (level of aggregation) and zoning (level of partitioning). While the first one concerns statistical inferences generated by the same data aggregated to different spatial resolutions, the latter refers to variations in the results due to alternative partitionings (zonings) at the same spatial scale. The procedure employed here for addressing spatial scaling is related to the MAUP to some degree, but the main difference lies in the way that the different zones are aggregated. The zonings used in this study are biologically-driven and there is also not a strict hierarchy between the levels as in MAUP. In other words, the partitioning of the movement space is constructed such that it biologically makes sense; this may also affect the aggregation levels, which may not follow a strict hierarchy, as we will show in the case study of this article. We will return to the MAUP in Section 6.
As shown in Step I.1 in Figure 1, we focus on three hierarchical levels of subdivision which correspond to different spatial scales: “micro” is confined to the scale of finely grained zones; “meso” points to the level of aggregated micro-zones; and “macro” refers to the coarsest possible spatial extent. First, preliminary micro-level zones are specified in discussion with domain experts to establish a meaningful fundamental partitioning of space. Then these zones are aggregated in order to form new zones that extend over a wider spatial scope, first at the meso, then at the macro scale. Such aggregation is war-ranted by the need for evaluating the patterns mined at different spatial scales, as well as by partitioning schemes that are meaningful from the perspective of the behaviors of the moving object under study.
In Step I.2, different measures are computed within each zone, and considered as input features for the classification. Examples of these measures include: time spent in different zones; characteristics of movement parameters within zones (e.g., descriptive statistics of MP values for each zone); contextual information linked to the zones (e.g., certain zones might be more prone to specific behaviors or they might be related to particular food re-sources); and frequent transitions between zones. In this study, for instance, the duration of time spent in different zones is calculated to determine the movement episodes within which the object is more stationary or more mobile, respectively. Cross-scale analysis based on different spatial partitioning is included in this step. When the spatial domain is decom-posed into several hierarchically nested regions, this approach yields multiple partitioning
I
. Spatial S
caling Micro-level spatial partitioning
Meso-level spatial partitioning
Macro-level spatial partitioning
II . T empor al S caling Classification (solely based on spatial features) Calculation of movement parameters at [w1 ... wN] Quantitative statistical analysis Attribute weighting and feature selection Reliable spatial scale Reliable temporal scale
Reliable spatial input features Reliable temporal input features Classification and prediction III . F eature S elec tion and Classific atiom
Cross-scale spatio-temporal classification of movement data
Evaluation through classification (solely based on temporal features) 1. 2. 3. 4. 1. 2. 3. 4. 1a. 1b. 2. 3.
Input features for each partitioning
Figure 1: Overview of applied approach for cross-scale analysis of movement data.
schemes at multiple scales and different extents. Collectively, this enables analyzing the patterns of variation of computed measures across spatial scales and different partitions, contributing to choosing the “reliable spatial scale” (described in Step I.4).
In Step I.3, input features are developed for each trajectory by selecting desired mea-sures, subsequently imported to the classification model. In this step, only spatial features are considered, such as the examples given in Step I.2.
In Step I.4, the reliable spatial scale is determined automatically. The reliable spatial scale is obtained as the scale at which the highest classification performance is achieved when only spatial features are employed in the classification. For this purpose, the clas-sification performance of different partitioning schemes in Step I.3 is evaluated based on some performance measures. For these measures, in addition to the classification accuracy and class recall values, we also use Cohen’s kappa coefficient [4] as a measure that is more robust than the percentage values reported from classification models. The method used to determine the reliable scale requires being able to flexibly modify the spatial partitioning, thus favoring zone partitioning schemes that can be easily varied, such as a scheme based on a percentage area per zone. Importantly, this allows researchers to quickly evaluate various spatial scaling arrangements as related to their research question.
3.2
Stage II: Temporal scaling
In Step II.1, a series of moving temporal windows (wi) of different sizes are used within
which the movement parameters are calculated. For this, the method of Laube et al. [22] appears to deliver meaningful results. By varying the temporal width of wi, values of
computed movement parameters can be examined over a wide range of scales (see [22] for details). To define the useful range of window sizes, we suggest using the temporal characteristics of the behaviors to be mined in the movement analysis process. For example, here the minimum window size is set to the smallest possible interval at which movement parameter can be computed (i.e., using 3 consecutive points), and the maximum window size is set to the duration of particular movement patterns that comprise basic behaviors performed by the moving object under study. For instance, in our zebrafish case study, the original sampling interval of 30fps yields a minimum window size of 0.1s, while the maximum window size was set to 7.5 s, corresponding to the maximum duration of an “erratic movement” (see details in Section 4). Note that if larger window sizes are used, some of these behaviors might be missed. For example, simply calculating the movement parameters only on one specific scale over the entire trajectory misses many important “micro-movement” features that hold predictive value for behavioral research [5]. Since different mechanisms corresponding to various behaviors in the movement process are important at different scales, variation of movement parameters can be used to exploit relevant cross-scale behavioral patterns [11, 28, 29].
The MPs used in our zebrafish case study include speed, acceleration, turning angle, meandering, and sinuosity, computed in the 2-D space (see Section 4). Meandering and sinuosity are both indicators of straightness or curvature of a path (or, in our case, a tra-jectory of a zebrafish swimming). Meandering represents the ratio of the turning angle to the bee line (i.e., the shortest distance between starting and ending points), while sinuosity is the ratio of the actual distance traveled along the track to the bee line. The influence of temporal scale for each of these parameters is explored by changing the size of the temporal windoww. The values of the movement parameters are calculated for every fix at all scales, in a segment wherew/2fixes exist before and after the sample point of interest [22].
In Step II.2, boxplots of the mean values of the movement parameters for all trajectories are investigated to assess if any significant patterns can be observed. The results of this step are considered as an input to determining the reliable temporal scale later in Step II.4. Importantly, as boxplots assess the signal-to-noise ratio, we expect that after a certain threshold (for the size of the temporal window), the variation of mean values of movement parameters can stabilize, and this is also where the signal-to-noise ratio may be expected to level off at its highest value.
Step II.3 examines whether the variation represented in the boxplots can define the re-liable temporal scale. For this purpose, the same classification procedure (as in the spatial scaling stage) was employed, but this time relying only on the developed temporal fea-tures. Input features for this classification may include statistical variables of movement parameters (e.g., the global minimum, maximum, mean, and standard deviation of a par-ticular movement parameter over the entire trajectory). For each trajectory, these values are first computed within several temporal windows, and then separately input to a classifica-tion procedure. The resulting corresponding measures of classificaclassifica-tion performance allow comparing the ability of different temporal scales to distinguish between behaviors.
Finally, Step II.4 takes the outputs of the two previous steps. The reliable temporal scale used in Stage III is selected by comparison of the variation exhibited in the boxplots
(Step II.2) and the resulting classification performance measures (Step II.3). As reliable temporal scale, we choose the first temporal window size that is most similar in its variation of MP values to the variation of the largest window size, and where the best classification performance is achieved.
3.3
Stage III: Feature selection and classification of trajectories
Step III.1: After the reliable spatial and temporal scales have been separately identified using cross-scale analysis approaches (in the previous stages I and II, respectively), the corresponding feature sets extracted at these specific scales are used jointly for the final feature selection and classification stage.
Step III.2 applies a two-phase feature weighting/selection approach. Briefly, for all the input features, a variable ranking algorithm (e.g., SVM weighting) is first used to rank the features in the order of their contribution to correctly assigning class labels [15, 31], to determine the significance of either the spatial or the temporal features and their contribu-tion to the behavioral states. Ranking allows filtering-out of irrelevant input features by a user-defined threshold (e.g., maximal number of features used, or minimum necessary weight). Thus, in the remainder of the classification process only a selected number of fea-tures are applied. In the second phase of Step III.2, a feature selection process is employed to determine the ultimately relevant features best describing the behavioral mechanisms. For example, in the case study described in Section 4, we used an evolutionary feature selection process using genetic algorithms (GAs) in conjunction with SVMs.
Finally, in Step III.3 the model built in the preceding stages and steps is used to predict the behavioral labels (e.g., drug treatment classification, in our case study) of unlabeled trajectory data.
4
Case study
In order to demonstrate the applicability of the proposed methodology, we used a case study consisting of a series of experimental evaluations, using a dataset of zebrafish move-ment data collected for a different behavioral project [3].
Developing expedient analysis methods in neurobehavioral research represents a sig-nificant contribution to a rapidly emerging field in psychopharmacology drug research [19, 23, 38]. Zebrafish offer several methodological and practical advantages over tradi-tional rodent models, and further development of these techniques is invaluable for phar-maceutical research [3]. The behavioral data for this study was generated by video tracking software1, which analyzes videos of zebrafish swimming activity at 30 frames per second,
rendering them feasible for cross-scale analysis. In these psychopharmacological trials, ex-perimental zebrafish were treated with psychoactive drugs with known neural targets and action (Table 1; for more information on the specific drug treatments and zebrafish trials, see [2, 3, 7, 13, 35]).
The testing tank type used was a 1.5-L trapezoidal tank with the following dimensions: 15.2cm height ×27.9cm top ×22.5cm bottom × 7.1cm width. The tank is deliberately designed to be rather narrow (only 7.1cm), such that video tracking can take place from
Treatment Class
Individual
Trajectories* Treatments
Anxiogenic 75 Alarm Pheromone, Caffeine, Morphine Withdrawal Anxiolytic 107 Fluoxetine, Nicotine, Ethanol, Morphine
Control 227 Wild-Type (short-fin) untreated, age-matched zebrafish * Each animal was analyzed once, and each trajectory represents an individual zebrafish
Table 1: Description of dataset.
the side view, that is, in 2-D, neglecting the narrow third dimension. Figure 2 provides examples of pseudo 3-D temporal reconstructions of raw trajectories, similar to a space-time cube representation, to illustrate the data used in our study. The 2-D trapezoidal cross-section of the side view of the tank can be clearly seen. Once again, it should be noted that the actual tracking data used are 2-D (x,y) coordinates and the space-time cube reconstructions are only shown to give a better picture of zebrafish movement. Thus, it becomes visible how the differences in mechanisms of action between the three treatment classes can be detected qualitatively. As we will demonstrate further, these differences in manifested behavior can be exploited in a classification strategy.
Wild-Type Control Anxiogenic treatments Velocity
Anxiolytic treatments
Alarm Pheromone Caffeine Morphine Withdrawal
Morphine Ethanol Nicotine Fluoxetine
Figure 2: Space-time cube temporal reconstructions of zebrafish swim paths treated with different drugs (adapted from [3]). Note also the projection to the 2-D trapezoidal side view of the test tank, which is the view that is used for data capture by video tracking, as well as for spatial partitioning (cf. Figure 3).
The present study had the ultimate goal of developing an effective behavioral analysis tool that discriminates (and may eventually predict) drugs with similar mechanisms of action based solely on the evoked locomotor activity. The proposed methodology was first employed to comprehensively describe the zebrafish behavior through assigning unique feature sets to different classes of drug treatments in relation to tank zones (e.g., during high-stress states caused by anxiogenic drugs, zebrafish tend to stay along the bottom and freeze for extended times, as shown in Figure 2; see [7] for more details on the effects of
pharmacological manipulations on behavioral phenotypes of zebrafish). We next built a ML model of fish behavior using previously classified trajectories in order to predict the drug treatments of “blind” zebrafish trajectories (with either known or novel psychoactive compounds used in the screening assays of pharmaceutical research). As restricting the analysis to specific predetermined temporal and/or spatial scale does not achieve these goals [20], the dynamic approach employed here may represent a solution. For example, the difference between a zebrafish swimming rapidly in very tightly intertwined circles or in large swooping circles throughout the arena may represent the difference between seizure-like activity and expanded exploratory activity (indicative of an anxiolytic, stress-reducing drug action). Each of these behaviors requires careful attention to the spatial and temporal scale used to calculate descriptive variables of the trajectory.
Thus, the cross-scale analysis approach described here is proposed to exploit the in-creasing volume of potentially valuable movement data collected in contemporary ze-brafish behavioral studies (and, in fact, in other animal neurobehavioral studies as well).
Manipulations that comprise two primary classes were used in this study: stress-inducing drugs (Anxiogenic), including Alarm Pheromone, Caffeine, Morphine With-drawal; and stress-reducing drugs (Anxiolytic), including Fluoxetine, Nicotine, Ethanol, Morphine. The third treatment class included the wild-type, untreatedControlzebrafish. Increased anxiety caused by the anxiogenic drugs can be seen through some behavioral pa-rameters in the movement: e.g., longer latency to enter the upper half of the tank, reduced time spent in the top, as well as increased erratic movements and freezing. In contrast, re-duced anxiety in this test is accompanied by increased exploration of the tank with rere-duced freezing and fewer erratic bouts [3,7]. The description of the dataset used and the numbers of trajectories is given in Table 1. After pre-treatment, zebrafish were placed individually in a testing tank maximally filled with aquarium treated water, and the 6-min novel tank test trial was recorded with HD USB web-cameras (see [3] for details).
The methodology introduced in Section 3 was applied as follows:
Stage I In Stage I, in order to partition the underlying spatial domain of the fish move-ment in the tank arena, a three-step spatial partitioning procedure was applied (the tank arena is the side view of the tank, as already mentioned in Figure 2): In the first step, the tank arena was partitioned into 9 zones, including 4 corner zones, 4 edge zones and 1 middle zone (Figure 3a). The areas of all corner zones were set to be the same with the 2.5cm edge margin. This resulted in a ratio of the area of surrounding zones (all corners and edges) to the whole arena of∼54% (note that varying the edge margins changes the percentage area values). This 9-zone partition was designed because so far the effects of corner and edge zones had been hypothesized to exist but have not yet been studied in zebrafish research. In the second step of this procedure, a 3-zone subdivision was applied. The 3 top zones from the 9-zone subdivision were aggregated to one top zone, and the same aggregation was then applied to the 3 middle and 3 bottom zones, respectively (Figure 3b). Finally, a 2-zone subdivision was utilized based on the conventional approach in zebrafish research to divide the tank arena into a top and a bottom zones using the origin coordinates (0,0) of the tank (Figure 3c). Our cross-scale partitioning approach forgoes the use of “tra-ditional” or “classic” zone partitioning schemes (represented in Figure 3c), thus avoiding a priori attributions biasing the interpretation of experimental results. Additionally, our method allows for rapidly changing the zones by entering a percentage of area to calculate partitions before processing the experimental data. In this case study, the only variable
generated as an input feature for the subsequent classification stage was the time spent (i.e., the duration) in each zone, calculated per trajectory and per subdivision scheme. The decision to use this variable was made after preliminary feature selection and classification experiments. Although the variable measures a temporal quantity (duration), we term it a spatial variable since it is the result of spatial scaling, calculated for each spatial zone. Stage II In Stage II, the values of movement parameters for each fix of a trajectory were calculated at different temporal window sizes. The five selected movement parameters were then calculated for seven temporal scales (w= 0.1, 0.3, 0.5, 1, 2.5, 5, or 7.5s). Vary-ing the size of window in this range is important, and depends on the amount of time required for a specific “behavioral event” (e.g., erratic movement) to occur. Specifically, if the temporal window is too small, the larger behavioral events are missed from analysis. Likewise, if it is too large, behavioral events blend out into an “average” locomotor state. The value of exploring multiple windows is to tease out the window size that allows us to both comprise and distinguish the distinct behavioral states in zebrafish.
(a) Micro-level partitioning
C1 E2 C2 C3 C4 E1 E3 E4 M (b) Meso-level partitioning Top Middle Bottom (c) Macro-level partitioning Bottom Top
Figure 3: Zebrafish tank arena partitioning at three levels: (a) Micro-level 9-zone subdi-vision includes 4 corner zones (C1-C4), 4 edge zones (E1-E4) and 1 middle zone (M). (b) Meso-level 3-zone subdivision includes top, middle, and bottom zones. (c) Macro-level 2-zone subdivision includes top and bottom zones.
Stage III In Stage III, we first applied an SVM weighting function (with the complexity weighting factor of 0) for ranking the input features. The feature weights represent the coef-ficients of a hyperplane separating the classes by an SVM classifier [31]. This step was per-formed to remove features that are highly correlated or have similar values within classes, and thus do not contribute significantly to discriminating between treatment classes.
Subsequent learning and classification stage applied a supervised, evolutionary feature-selection algorithm using GAs in conjunction with SVMs [18, 37]. The combination of GAs and SVMs for feature selection was chosen due to their better performance, compared to other existing methods. We used a radial basis function (RBF, [33]) for the SVM kernel with the following parameter settings: C = 20, which is an offset parameter imposing a trade-off between training error and generalization performance of SVM classifier andγ= 0.001, which is an exponent factor in the RBF function. These settings were the same when the classification was run solely based on spatial features (step I.3) and temporal features (step II.3). The reported results are based on a 10-fold cross-validation in each SVM learning phase and with the following parameter settings for GA:
• Number of generations: 100 • Probability of crossover: 0.8
• Probability of mutation: 1 / (number of features) for each individual
Using a feature selection process, a set of movement features was extracted, including a combination of movement parameters and time spent in different zones, which yielded dominant SVM weights for labeling the drug classes. Finding spatial and temporal features of movement that can best differentiate drug classes was the intended outcome of this step. A classification model was then built to classify the labeled data based on selected features. The calculation of movement parameters was implemented in MATLAB (R2010b), while ML procedures (including feature selection and classification) were implemented in RapidMiner 5, an open-source machine learning and data mining package2.
Three-dimensional trajectory reconstructions were also generated in RapidMiner 5 (see [3] for details).
5
Results
5.1
Spatial scaling through arena partitioning
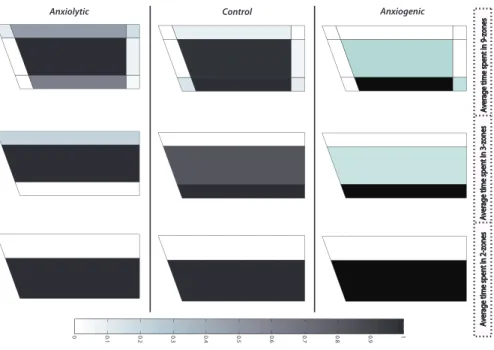
The times spent in different zones (based on the 3-arena partitioning procedures) were calculated for all trajectories of the 3-treatment cohorts (Step I.1 in Figure 1). Averaged values for each of these classes are illustrated in Figure 4. While these “maps” only show the mean values over all trajectories within a treatment class, we can already see some patterns in the distribution over the zones. For example, while the 2-zone subdivision shows little difference between the treatment classes, the other subdivision schemes exhibit more distinct treatment effects.
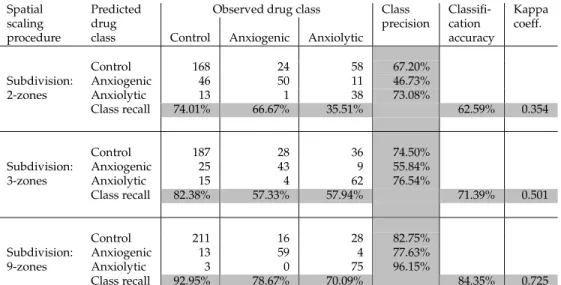
The times spent in each zone were then used as input features for the subsequent classi-fication in Step I.2. Note that depending on the arena partitioning scheme used, the number of input features will differ, commensurate with the number of zones (i.e., 2, 3, or 9). For the classification process (Step I.3), we used an SVM classifier. Table 2 shows the classification performance achieved by the 3 subdivision schemes of the tank arena, including the preci-sion and recall per class, as well as the overall classification accuracy and kappa values per subdivision. As already suggested by Figure 4, the 2-zone subdivision performs weakest, while there was a steady increase in the values of overall classification accuracy and kappa values as the number of zones increases (Table 2). Thus, for the given options of partition-ing schemes, the 9-zone subdivision can be selected as the “reliable spatial scale” (Step I.4), markedly improving drug characterization based on zebrafish behavioral responses.
5.2
Temporal scaling through calculation of movement parameters at
different windows
For all trajectories of the three treatment classes, values of movement parameters at the temporal windows stated in Section 4 were computed in Step II.1 (Figure 1). Boxplots were generated to characterize the variation of mean values per trajectory of three movement parameters for all trajectories of a particular treatment class, calculated at the different
1 2 3 4 5 6 7 8 9
0 0. 0. 0. 0. 0. 0. 0. 0. 0. 1
Anxiolytic Control Anxiogenic
Average time spent in 9-zones
Average time spent in 3-zonesAverage time spent in 3-zones
Average time spent in 2-zonesAverage time spent in 2-zones
Average time spent in 9-zones
Figure 4: Averaged values of time spent in different zones for anxiolytic, control, and anx-iogenic classes. The color scheme from 0 to 1 indicates the overall duration of experimental psychopharmacological zebrafish trials. Since each trial possessed slight time differences (±1s), they are scaled to range of [0–1] (0–360s) in order to be comparable to each other.
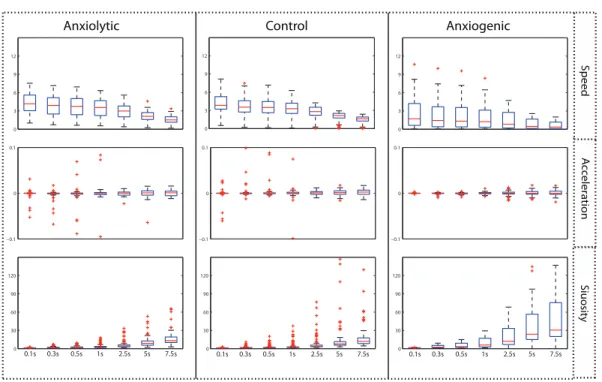
temporal windows (Step II.2). Figure 5 shows the variation of speed, acceleration, and sinuosity for the three treatment classes and 7 temporal windows. It is worth noting that the remaining movement parameters (i.e., turning angle or meandering) showed no clear patterns in the evolution of boxplots, and were therefore no longer shown in these graphs. The main objective of using boxplots here was to investigate the signal-to-noise ratio in order to subsequently select the appropriate temporal window in which movement param-eters can be reliably computed. There was a generally steady increase in the magnitude of acceleration and sinuosity values; whereas the speed values are decreasing as the window size increases. The revealed patterns in the boxplots for the anxiolytic and control classes were quite similar, indicating the need for using more additional features (e.g., spatial scal-ing parameters) to help discriminate these two classes. In contrast, a more unique pattern can be observed for the anxiogenic treatment class.
As was already mentioned, the largest window size (i.e., 7.5s) was defined based on the approximate time needed for a full behavioral event (e.g., a so-called startle movement) to take place. It is clear, however, that some events may take less time. Therefore, we sought to find a window size that is smaller than the 7.5s window, yet most similar in terms of the variation of the movement parameters. Thus, the intention was to capture the more fine-grained behaviors, while at the same time removing potential noise in the data. For this purpose, we examined the boxplots for the different movement parameters. While for sinuosity, both the median and interquartile range show a steady or even accelerating
Spatial scaling procedure Predicted drug class
Observed drug class Class
precision Classifi-cation accuracy Kappa coeff.
Control Anxiogenic Anxiolytic
Subdivision: 2-zones Control 168 24 58 67.20% Anxiogenic 46 50 11 46.73% Anxiolytic 13 1 38 73.08% Class recall 74.01% 66.67% 35.51% 62.59% 0.354 Subdivision: 3-zones Control 187 28 36 74.50% Anxiogenic 25 43 9 55.84% Anxiolytic 15 4 62 76.54% Class recall 82.38% 57.33% 57.94% 71.39% 0.501 Subdivision: 9-zones Control 211 16 28 82.75% Anxiogenic 13 59 4 77.63% Anxiolytic 3 0 75 96.15% Class recall 92.95% 78.67% 70.09% 84.35% 0.725
Table 2: Classification results based solely on the time spent in zones of different partition-ing levels (e.g., 2-zones, 3-zones, 9-zones).
increase with increasing scale, the values for speed (particularly in the anxiogenic class) and acceleration (in all treatment classes) start to stabilize. That is, at the scale of 5s the median and interquartile range start approximating the window size of 7.5s.
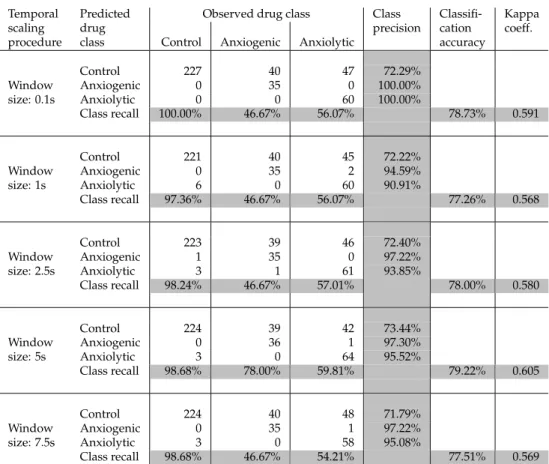
These observations suggest a way to optimize the reliable temporal window size (w) selection. Since it was important to keep the size of the window as small as possible (in order not to miss underlying fine-grained behaviors), we selected 5s as the window size for the final feature selection and classification process. To evaluate this assumption and see whether boxplots may help in the identification of the reliable temporal window, iden-tical classification analyses were conducted (Step II.3), where no spatial subdivision is con-sidered and input features comprised only descriptive statistics of movement parameters (based on the variation of the temporal window). The corresponding results are shown in Table 3. As expected, none of the window sizes resulted in a better classification result than the 5s, indicating the validity of the cross-scale approach employed here to select the most reliable temporal window. While there is an increase in the performance measures up to window size of 5s, the results decline for window size of 7.5s. Furthermore, the best classification performance from temporal scaling (kappa = 0.605; Table 3) was lower than the best performance obtained from spatial partitioning (kappa = 0.725; Table 2). This suggests that the underlying behavioral mechanisms are intertwined, and that temporal scaling alone does not suffice to generate accurate behavioral classification results.
5.3
Feature selection and classification of movement data
For each trajectory, we applied two sets of input features for the classification process. From the results of Section 5.1, times spent within the 9-zone subdivision profile were used (Step III.1a). From the results of Section 5.2, four statistical descriptors of all five movement parameters calculated at varying temporal window sizes were used (Step III.1b). Thus, for each trajectory, a total of 29 input features were considered for the subsequent feature
0 3 6 9 12 0 3 6 9 12 −0.1 0 0.1 −0.1 0 0.1 −0.1 0 0.1 0 30 60 90 120 0 30 60 90 120 0 30 60 90 120 0.1s 0.3s 0.5s 1s 2.5s 5s 7.5s 0.1s 0.3s 0.5s 1s 2.5s 5s 7.5s 0.1s 0.3s 0.5s 1s 2.5s 5s 7.5s A cc eleration Speed Siuosit y Anxiogenic Control Anxiolytic 0 3 6 9 12
Figure 5: Boxplots of variation of mean values of three movement parameters (speed, ac-celeration, and sinuosity) of all trajectories for three classes of anxiolytic, control, and anx-iogenic treatments, calculated at temporal windows of 0.1, 0.3, 0.5, 1, 2.5, 5, and 7.5s.
selection and classification process. As already described in Section 3, before the classifi-cation process, an SVM weighting function was used to select the most predominant input features (Step III.2). This was achieved by building a classification model iteratively in order to remove features that are highly correlated or have similar values within classes, and thus do not contribute much to discriminating between treatment classes.
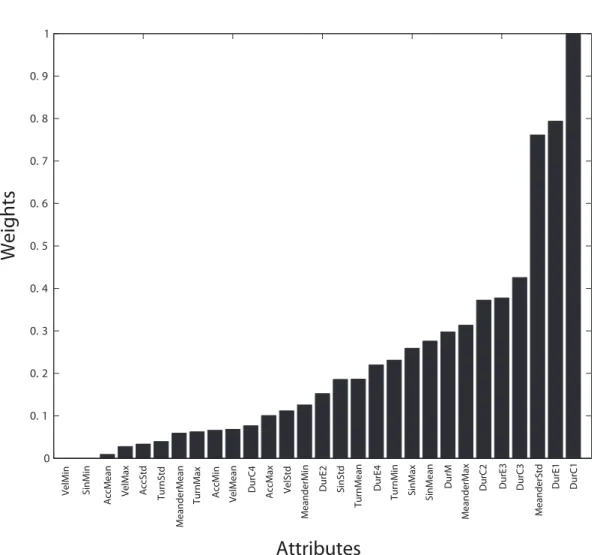
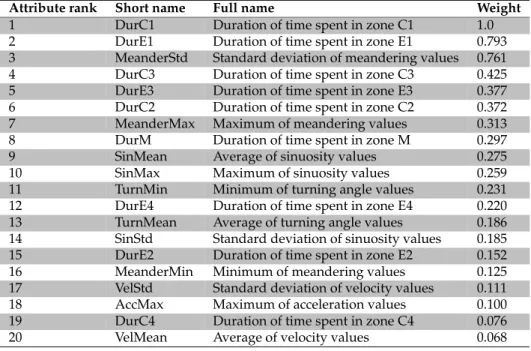
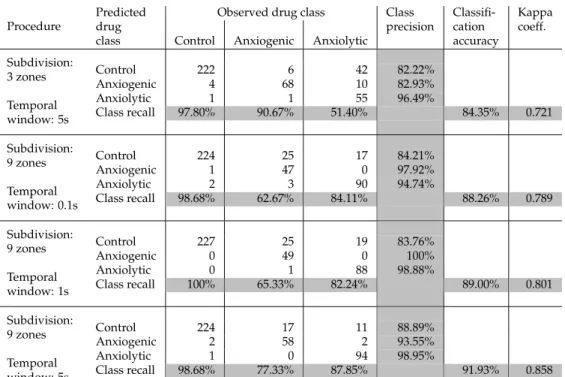
The results of the SVM weighting function give an indication of the significance of dif-ferent features based on their weights; they are reported in Figure 6. The top 20 features were chosen based on their resulting weights. The meanings of these features are shown in Table 4. The features indicating the time spent in a particular zone (e.g., DurC1-4, DurE1-4, DurM) are spatial features, while the remainder are temporal features (MeanderStd, Turn-Min, etc). The reason for selecting this number of features is that the obtained results are far off if all input features are used instead of selected 20 features. Furthermore, from an ML point of view, there should be enough features to build and test the classification model, and at the same time avoid noise and/or correlated features. This is achieved through an iterative process where different numbers of features are tested in order to obtain optimal classification results. The designated features are imported in the classification process by applying an evolutionary feature selection using GA in conjunction with an SVM learning model, where the feature selection procedure uses the delivered classification accuracy as its fitness function. Representative corresponding results are shown in Table 5.
As shown in Table 5, various arena partitioning strategies as well as other temporal window sizes were tested through the same feature selection and classification procedure.
Temporal scaling procedure Predicted drug class
Observed drug class Class
precision Classifi-cation accuracy Kappa coeff.
Control Anxiogenic Anxiolytic
Window size: 0.1s Control 227 40 47 72.29% Anxiogenic 0 35 0 100.00% Anxiolytic 0 0 60 100.00% Class recall 100.00% 46.67% 56.07% 78.73% 0.591 Window size: 1s Control 221 40 45 72.22% Anxiogenic 0 35 2 94.59% Anxiolytic 6 0 60 90.91% Class recall 97.36% 46.67% 56.07% 77.26% 0.568 Window size: 2.5s Control 223 39 46 72.40% Anxiogenic 1 35 0 97.22% Anxiolytic 3 1 61 93.85% Class recall 98.24% 46.67% 57.01% 78.00% 0.580 Window size: 5s Control 224 39 42 73.44% Anxiogenic 0 36 1 97.30% Anxiolytic 3 0 64 95.52% Class recall 98.68% 78.00% 59.81% 79.22% 0.605 Window size: 7.5s Control 224 40 48 71.79% Anxiogenic 0 35 1 97.22% Anxiolytic 3 0 58 95.08% Class recall 98.68% 46.67% 54.21% 77.51% 0.569
Table 3: Classification results based solely on descriptive statistics of movement parameters calculated at different temporal windows.
Comparing the kappa values, none of them achieved better results than the 9-zone subdivi-sion in combination with the 5s window size (representing the reliable spatial and temporal scales, as predicted in Sections 5.1 and 5.2, respectively).
6
Discussion
In our case study, the proposed methodology was employed to dissect and quantita-tively describe adult zebrafish behavior in the novel tank test [2, 3] under various well-characterized drug class treatments through: 1) assigning unique feature sets to different classes of psychoactive compounds in relation to spatial scale and distribution (e.g., bot-tom dwelling, freezing, and rapid darting or erratic movements along the botbot-tom in high-stress states versus free, smooth swimming in upper regions of the tank), and 2) building a learning model of fish behavior using previously labeled trajectories to predict the drug treatments of unknown trajectories (achieved through investigation of scaling both in the spatial and temporal domains).
0 0. 1 0. 2 0. 3 0. 4 0. 5 0. 6 0. 7 0. 8 0. 9 1
Attributes
VelMin SinMin AccMean VelMax AccStd TurnStd TurnMax AccMin VelMean AccMax VelStd DurE2 SinMean
MeanderMean
DurC4 SinStd SinMax
MeanderMin
TurnMean TurnMin
DurE4
MeanderMax
DurM DurC2 DurE3 DurC3
MeanderStd
DurE1 DurC1
Weights
Figure 6: Values of attribute weights from SVM weighting function (see Table 4 for details).
As the results of Section 5.1 show, automated procedures are needed to explore spatial scaling through partitioning underlying movement space. Different classification accura-cies delivered at three zoning levels indicates the importance of spatial scaling. In this study, a 9-zone subdivision resulted in better accuracy of classification process, which sup-ports studying zebrafish movement at more finely-grained zones in behavioral pharma-cology and drug screening. It also shows that drug treatments affect zebrafish movement behavior in some of the zones, especially corners, which cannot be explored if coarser spa-tial scales are used. As is well known, spaspa-tial aggregation and zoning invariably involves the MAUP. However, the main difference to the common MAUP is that in our case, the selection of the zoning schemes was done based on the biological relevance of the differ-ent areas of the testing tank. Exploring this provided the main reason for developing the spatial zoning and scaling in the first place.
The results presented in Section 5.2 indicate the importance of selecting the appropri-ate temporal interval at which the movement parameters are calculappropri-ated. Since the raw
Attribute rank Short name Full name Weight
1 DurC1 Duration of time spent in zone C1 1.0 2 DurE1 Duration of time spent in zone E1 0.793 3 MeanderStd Standard deviation of meandering values 0.761 4 DurC3 Duration of time spent in zone C3 0.425 5 DurE3 Duration of time spent in zone E3 0.377 6 DurC2 Duration of time spent in zone C2 0.372 7 MeanderMax Maximum of meandering values 0.313 8 DurM Duration of time spent in zone M 0.297 9 SinMean Average of sinuosity values 0.275 10 SinMax Maximum of sinuosity values 0.259 11 TurnMin Minimum of turning angle values 0.231 12 DurE4 Duration of time spent in zone E4 0.220 13 TurnMean Average of turning angle values 0.186 14 SinStd Standard deviation of sinuosity values 0.185 15 DurE2 Duration of time spent in zone E2 0.152 16 MeanderMin Minimum of meandering values 0.125 17 VelStd Standard deviation of velocity values 0.111 18 AccMax Maximum of acceleration values 0.100 19 DurC4 Duration of time spent in zone C4 0.076 20 VelMean Average of velocity values 0.068
Table 4: Detailed descriptions of the top 20 attribute obtained from SVM weighting.
zebrafish movement data has a very high temporal resolution (sampled at 30fps), the cal-culation of movement parameters at the original temporal window (or window sizes close to it) may eliminate the actual signal because in a highly granular temporal window, there is not enough time for distinct behavioral events to unfold. Conversely, in a large temporal window (i.e., the full 6 minutes of the test), distinct behavioral states are lost and averaged out within the entire trajectory. Therefore, by using a moving window of around 5s, we are essentially considering a window in which the relevant distinct behavioral states have enough time to play out fully, yet are not be blurred by too large an analysis window.
Overall, our results are in line with the findings of earlier studies in other application domains (e.g., [22] and [21]). However, the novelty of this work is three-fold. First, our methodology extracts movement features in both the spatial and temporal domains and integrates them to obtain a joint model of behavioral classification. Second, after running an analysis across multiple temporal windows, our methodology determines a single reli-able temporal scale where the best classification performance is achieved (as we did pre-viously in the spatial domain, Table 3). For both the selection of temporal windows and the spatial partitioning schemes, domain knowledge is used to inform the process. Third, the importance of the combined spatial/temporal features is evaluated through automatic dimensionality reduction techniques based on both local (SVM weighting) and global (GA in conjunction with SVM) search to define the contribution of the individual features and optimize the feature selection process in the classification. As the results from the classi-fication performance analysis show (Tables 3–5), the cross-scale analysis in the spatial and in the temporal domains may be necessary, as it pays off even more when we combine the features from both these domains.
Procedure
Predicted drug class
Observed drug class Class
precision Classifi-cation accuracy Kappa coeff.
Control Anxiogenic Anxiolytic
Subdivision: 3 zones Temporal window: 5s Control 222 6 42 82.22% Anxiogenic 4 68 10 82.93% Anxiolytic 1 1 55 96.49% Class recall 97.80% 90.67% 51.40% 84.35% 0.721 Subdivision: 9 zones Temporal window: 0.1s Control 224 25 17 84.21% Anxiogenic 1 47 0 97.92% Anxiolytic 2 3 90 94.74% Class recall 98.68% 62.67% 84.11% 88.26% 0.789 Subdivision: 9 zones Temporal window: 1s Control 227 25 19 83.76% Anxiogenic 0 49 0 100% Anxiolytic 0 1 88 98.88% Class recall 100% 65.33% 82.24% 89.00% 0.801 Subdivision: 9 zones Temporal window: 5s Control 224 17 11 88.89% Anxiogenic 2 58 2 93.55% Anxiolytic 1 0 94 98.95% Class recall 98.68% 77.33% 87.85% 91.93% 0.858
Table 5: Classification results based on parameters from both spatial scaling (time spent in different zones) and temporal scaling (descriptive statistics of movement parameters at different temporal windows).
The combination of features from the spatial and temporal domains was then evalu-ated in a feature selection process in Section 5.3, to assess the importance of different input features in the identification of drug treatments. Biological interpretation can be further at-tached to the weights of these features. Importantly, the features with the highest weights in Figure 6 and Table 4 are the ones indicating the time spent in different zones, derived from spatial scaling, which indicates the significance of this issue in movement analysis. Time spent in zones C1 (top right corner) and E1 (top edge), respectively, are the ones with the highest weights (and, thus, showing the best discriminating power). The anxiolytic drugs cause the fish to move most of the time in the top of the tank (due to inhibited anxiety), whereas anxiogenic drugs increase anxiety and cause the fish to stay along the bottom, and/or freeze for extended times during high-stress states, hardly traversing the upper zones. On the other hand, the control zebrafish movements are more moderate, as some fish might pass through the upper zones, but not as extensively as those treated with anxiolytic drugs. Thus, these two features (i.e., time spent in zones C1 and E1) may be considered as an indicator of anxiolytic drugs. Conversely, three other highly scoring input features, DurC3, DurE3, and DurC2 (time spent in the two bottom corner zones and the bottom edge zone) can be considered as indicators of anxiogenic drugs. The time spent in the middle zone, DurM, received a relatively high weight, yet was clearly lower than the features related to the top and bottom zones. This may be due to the fact that in both anxiogenic and anxiolytic treatments, visits to the middle zone are rather infrequent, which would yield good discrimination properties. Yet they do occur (particularly in the control
treatment), and thus reduce the discriminating power of this feature. While the above in-put features all stem from spatial scaling, two other highly scoring features, MeanderStd (standard deviation of meandering) and MeanderMax (maximum of meandering) origi-nate from the temporal scaling process. They both relate to the degree of tortuosity relative to the entire path, which again has a biological explanation: anxiogenic drugs generally cause erratic movements with high tortuosity, while anxiolytic drugs induce smoother, ex-tended swim paths. The remaining features score clearly lower weights and thus seem to contribute little to the discrimination of behavioral states. Taken together, this suggests a need for more robust measures apart from the simple statistical descriptors of movement parameters included in this study (i.e., mean, standard deviation, min, and max). In addi-tion, including other distinct classes of drug treatments (i.e., hallucinogenics) may further elucidate the meaning and the value of variance in the observed movement parameters.
7
Conclusions and future work
Our analyses demonstrate the value of exploring both the spatial and temporal domains of movement across different scales in order to yield novel cross-scale behavioral endpoints. To validate the proposed analysis methodology, a dataset of zebrafish movement was em-ployed in order to classify blind trajectories into previously known drug treatments. To our knowledge, such models of spatial scaling through partitioning of the tank arena into different zones have not been applied previously to zebrafish behavioral research. The use of joint cross-scale analysis in the spatial and temporal domains is also novel for neurophar-macological research.
From the point of view of methods development in GIScience, this work has contributed a novel methodology for joint spatio-temporal cross-scale analysis and movement classifi-cation. The novelty of this methodology is three-fold: it integrates movement features extracted by cross-scale analysis in both the spatial and temporal domain; it provides a procedure to establish the reliable spatial and temporal scale, that is, the scale at which these features can be reliably measured; and it integrates the use of machine learning meth-ods to optimize feature selection for classification. Our work resulted in the following key findings:
• Cross-scale analysis outperforms simple fixed scale analysis. This holds for both the spatial and the temporal domain individually, but the improvement of classification performance is even more substantial if features from the two domains are combined. Thus, joint spatio-temporal cross-scale analysis has a clear potential, and should be investigated further for other applications of behavioral classification.
• Different scopes of the underlying movement space (or, as some authors call it, con-text) should be explored at different extents in order to investigate the process of spatial scaling and identify the reliable spatial scale.
• Exploring the temporal scaling behavior of movement parameters in relation to dif-ferent temporal window sizes allows the investigators to automatically select the reli-able temporal scale. However, more robust methods than boxplots used in this study may be investigated further.
• ML methods can be helpful in distinguishing known behavioral mechanisms based on a combination of features extracted from both the spatial and temporal domains,
given the high number of multiply interrelated input features resulting from a joint spatiotemporal classification strategy.
As part of our future work, two research strands seem particularly relevant. First, the pro-posed methodology can be adapted to other application domains, where different move-ment patterns from those of the present case study prevail. This strand is expected to gen-erate insights regarding the generalizability of the methodology. As a second strand, we plan to develop new measures based on the arena partitioning applied in this work. These measures can be capable of capturing inherent spatial and temporal properties of move-ment within different zones. Thus, a spatial measure may be used to determine whether fish display preferential, stereotypic movement patterns between zones, or their swimming behavior was more variable throughout the arena. Likewise, a temporal index can be used to determine whether fish show substantial preference for a particular zone over others, or their activity is more evenly distributed during the experimental trials. Additionally, the variation of movement parameters within zones could also be investigated beyond simple statistical descriptors. For this, additional drug treatments (hallucinogenics) will be in-cluded to clarify the variance and importance of those movement parameters that received lower weights in our current experiments. If successful, these analyses may have several important practical applications, enhancing drug screening for biomedical research.
References
[1] BEGG, R., AND KAMRUZZAMAN, J. A machine learning approach for automated recognition of movement patterns using basic, kinetic and kinematic gait data.Journal of Biomechanics 38, 3 (2005), 401–408. doi:10.1016/j.jbiomech.2004.05.002.
[2] CACHAT, J., STEWART, A., GROSSMAN, L., GAIKWAD, S., KADRI, F., CHUNG, K., WU, N., WONG, K., ROY, S., SUCIU, C., GOODSPEED, J., ELEGANTE, M., BARTELS, B., ELKHAYAT, S., TIEN, D., TAN, J., DENMARK, A., GILDER, T., KYZAR, E., DILEO, J., FRANK, K., CHANG, K., UTTERBACK, E., HART, P., AND KALUEFF, A. Measur-ing behavioral and endocrine responses to novelty stress in adult zebrafish. Nature Protocols 5, 11 (2010), 1786–1799. doi:10.1038/nprot.2010.140.
[3] CACHAT, J., STEWART, A., UTTERBACK, E., HART, P., GAIKWAD, S., WONG, K., KYZAR, E., WU, N., AND KALUEFF, A. Three-dimensional neurophenotyping of adult zebrafish behavior.PLoS ONE 6, 3 (2011). doi:10.1371/journal.pone.0017597. [4] CARLETTA, J. Assessing agreement on classification tasks: The kappa statistic.
Com-putational linguistics 22, 2 (1996), 249–254.
[5] DODGE, S., WEIBEL, R., AND FOROOTAN, E. Revealing the physics of move-ment: Comparing the similarity of movement characteristics of different types of moving objects. Computers, Environment and Urban Systems 33, 6 (2009), 419–434. doi:10.1016/j.compenvurbsys.2009.07.008.
[6] DODGE, S., WEIBEL, R., AND LAUTENSCHUTZ¨ , A.-K. Towards a taxon-omy of movement patterns. Information Visualization 7, 3–4 (2008), 240–252. doi:10.1057/palgrave.ivs.9500182.
[7] EGAN, R., BERGNER, C., HART, P., CACHAT, J., CANAVELLO, P., ELEGANTE, M., ELKHAYAT, S., BARTELS, B., TIEN, A., TIEN, D., MOHNOT, S., BEESON, E., GLAS -GOW, E., AMRI, H., ZUKOWSKA, Z., AND KALUEFF, A. Understanding behavioral and physiological phenotypes of stress and anxiety in zebrafish. Behavioural Brain Research 205, 1 (2009), 38–44. doi:10.1016/j.bbr.2009.06.022.
[8] FRANKE, A., CAELLI, T.,ANDHUDSON, R. Analysis of movements and behavior of caribou (Rangifer tarandus) using hidden Markov models. Ecological Modelling 173, 2–3 (2004), 259–270. doi:10.1016/j.ecolmodel.2003.06.004.
[9] FROHLICH¨ , H., HOENSELAAR, A., EICHNER, J., ROSENBROCK, H., BIRK, G., AND ZELL, A. Automated classification of the behavior of rats in the forced swim-ming test with support vector machines. Neural Networks 21, 1 (2008), 92–101. doi:10.1016/j.neunet.2007.09.019.
[10] FRYXELL, J., HAZELL, M., B ¨ORGER, L., DALZIEL, B., HAYDON, D., MORALES, J.,
MCINTOSH, T.,ANDROSATTE, R. Multiple movement modes by large herbivores at
multiple spatiotemporal scales. Proceedings of the National Academy of Sciences of the United States of America 105, 49 (2008), 19114–19119. doi:10.1073/pnas.0801737105. [11] GEYER, M., RUSSO, P.,ANDMASTEN, V. Multivariate assessment of locomotor
be-havior: Pharmacological and behavioral analyses. Pharmacology Biochemistry and Be-havior 25, 1 (1986), 277–288. doi:10.1016/0091-3057(86)90266-2.
[12] GOODCHILD, M. F. Scale in GIS: An overview. Geomorphology 130, 1 (2011), 5–9. doi:10.1016/j.geomorph.2010.10.004.
[13] GROSSMAN, L., UTTERBACK, E., STEWART, A., GAIKWAD, S., CHUNG, K., SU -CIU, C., WONG, K., ELEGANTE, M., ELKHAYAT, S., TAN, J., GILDER, T., WU, N., DILEO, J., CACHAT, J., AND KALUEFF, A. Characterization of behavioral and en-docrine effects of LSD on zebrafish. Behavioural Brain Research 214, 2 (2010), 277–284. doi:10.1016/j.bbr.2010.05.039.
[14] GUILFORD, T., MEADE, J., WILLIS, J., PHILLIPS, R., BOYLE, D., ROBERTS, S., COL -LETT, M., FREEMAN, R., AND PERRINS, C. Migration and stopover in a small pelagic seabird, the manx shearwater puffinus puffinus: Insights from machine learn-ing. Proceedings of the Royal Society B: Biological Sciences 276, 1660 (2009), 1215–1223. doi:10.1098/rspb.2008.1577.
[15] GUYON, I., AND ELISSEEFF, A. An introduction to variable and fea-ture selection. The Journal of Machine Learning Research 3 (2003), 1157–1182. doi:10.1559/152304007781002163.
[16] HELMUTH, J., BURCKHARDT, C., KOUMOUTSAKOS, P., GREBER, U., AND
SBALZARINI, I. A novel supervised trajectory segmentation algorithm identifies
dis-tinct types of human adenovirus motion in host cells. Journal of Structural Biology 159, 3 (2007), 347–358. doi:10.1016/j.jsb.2007.04.003.
[17] HU, W., XIE, D., ANDTAN, T. A hierarchical self-organizing approach for learning the patterns of motion trajectories. IEEE Transactions on Neural Networks 15, 1 (2004), 135–144. doi:10.1109/TNN.2003.820668.
![Figure 2: Space-time cube temporal reconstructions of zebrafish swim paths treated with different drugs (adapted from [3])](https://thumb-us.123doks.com/thumbv2/123dok_us/630229.2575913/12.918.188.712.174.273/figure-space-temporal-reconstructions-zebrafish-treated-different-adapted.webp)