Boston University
OpenBU http://open.bu.edu
Theses & Dissertations Boston University Theses & Dissertations
2017
Has global financial reporting
comparability improved?
https://hdl.handle.net/2144/23344 Boston University
BOSTON UNIVERSITY
QUESTROM SCHOOL OF BUSINESS
Dissertation
HAS GLOBAL FINANCIAL REPORTING COMPARABILITY IMPROVED?
by
JENELLE KOBI CONAWAY B.S., University of South Carolina, 2008 M.B.A., Loyola University Maryland, 2011
Submitted in partial fulfillment of the requirements for the degree of
Doctor of Philosophy 2017
© 2017 by
Approved by
First Reader
Edward J. Riedl, Ph.D.
Professor and Chair of Accounting
Everett W. Lord Distinguished Faculty Scholar
Second Reader
Francois Brochet, Ph.D.
Associate Professor of Accounting Dean’s Research Fellow
Third Reader
Andrea M. Buffa, Ph.D. Assistant Professor of Finance
Fourth Reader
Peter D. Wysocki, Ph.D. Professor of Accounting
ACKNOWLEDGMENTS
My gratitude goes first and foremost to my advisor, Eddie Riedl, who was instrumental in my success in the Boston University PhD program. Without his expertise, instruction, availability, and constant supply of chocolate I would not have made it though the past five years. His unwavering enthusiasm for accounting kept me engaged with my research, while his knowledge of pop-culture always provided a
refreshing break from academics. Eddie is an exemplary researcher, teacher, and mentor; I am grateful for all that he has done for me.
I am further indebted to my committee (Francois Brochet, Andrea Buffa, and Peter Wysocki) for their guidance throughout this process; your ideas and constructive feedback are greatly appreciated. I must also thank the other Boston University
accounting faculty for their support and encouragement along the way, particularly Ana Albuquerque, Moshe Hagigi, Krish Menon, and Estelle Sun. Each of the aforementioned professors was influential in my development as a researcher, teacher, and colleague.
There are a number of past and present Boston University PhD students who are, and continue to be, a source of friendship, as well as advice and collaboration.
Specifically, Bingyi Chen (who escorted me to the doctor when I had a severe allergic reaction in Beijing), Yiting Cao (“may I ask you a question?”), Thaddeus Neururer (a fellow beagle owner), Scarlett Song (I will miss our office sing-alongs), Marketa Sonkova (jedno panini šunka a sýr, prosím), Tingting Ye (who always brought back desserts from the dining hall), and the rest of my 502G office-mates (Shin Kwon, Guannan Wang, and Lin-Hui Yu).
I also wish to thank seminar participants at the following institutions who
provided insight into my research while presenting earlier versions of this paper: Boston University, George Mason University, Santa Clara University, University of Illinois at Chicago, and University of San Diego.
Finally, I would like to thank my family and friends for their love and support during this process. Some of you contributed directly to this dissertation; therefore, special thanks go to my uncle John (whose guidance and calculus lessons were invaluable), my brother Nolan (whose data formatting code was a tremendous time saver), my friend Peter (who provided his editing services gratis), and the residents of 99 Farquhar (I could never have done this without your friendship and food!). Of course, a most special thank you is reserved for my little dog, Toffee, for bringing such joy to my life.
HAS GLOBAL FINANCIAL REPORTING COMPARABILITY IMPROVED? JENELLE KOBI CONAWAY
Boston University Questrom School of Business, 2017
Major Professor: Edward J. Riedl, Ph.D., Professor and Chair of Accounting, Everett W. Lord Distinguished Faculty Scholar
ABSTRACT
Motivated by ongoing worldwide efforts to improve the comparability of reported accounting numbers, this study examines the temporal trend in global financial reporting comparability and the factors that explain its variation. Despite regulatory interest in improving comparability, numerous frictions can limit the effectiveness of these efforts; examples include firm-specific incentives, investor protections, regulation, and
enforcement. Using a broad cross-country sample focusing on the largest economies during 2000 to 2014, I first develop a firm-level measure of global financial reporting comparability. Next, I document—consistent across numerous specifications—that comparability is increasing over the sample period. Finally, I provide evidence of predictable cross-sectional variation: the increase in comparability is greater for firms that are smaller, using local GAAP, or domiciled in countries with weaker regulation and reduced for firms that are less profitable or have higher information asymmetry. Overall, the results are consistent with comparability increasing over time—reflecting systematic regulatory efforts and/or increasing economic integration—with the increase driven by firm- and country-level characteristics.
TABLE OF CONTENTS
ACKNOWLEDGMENTS ... iv!
ABSTRACT ... vi!
TABLE OF CONTENTS ... vii!
LIST OF TABLES ... ix!
LIST OF FIGURES ... x!
LIST OF APPENDICES ... xi!
LIST OF ABBREVIATIONS ... xii!
1.! INTRODUCTION ... 1!
2.! PRIOR LITERATURE AND HYPOTHESIS DEVELOPMENT ... 6!
3.! RESEARCH DESIGN ... 12!
3.1! Measuring Comparability ... 12!
3.2! Comparability Measure Considerations and Construct Validity ... 16!
3.3! Comparability Trend ... 17!
3.4! Comparability Trend Determinants ... 19!
4.! SAMPLE AND DESCRIPTIVE STATISTICS ... 23!
5.! EMPIRICAL RESULTS ... 25!
5.1! Comparability Measure Considerations and Construct Validity ... 25!
TABLE OF CONTENTS− Continued
5.3! Comparability Trend Cross-Sectional Analysis ... 29!
5.3.1! Comparability Trend Cross-Sectional Analysis - Univariate ... 30!
5.3.2! Comparability Trend Cross-Sectional Analysis - Multivariate ... 32!
6. ! SENSITIVITY ANALYSIS ... 37!
6.1! Alternate Samples and Specifications ... 37!
6.2! Economic Forces Analysis ... 42!
7.! CONCLUSION ... 44! FIGURES ... 46! TABLES ... 50! APPENDICES ... 76! BIBLIOGRAPHY ... 81! CURRICULUM VITAE ... 84!
LIST OF TABLES
Table 1: Sample Selection ... 50!
Table 2: Sample Distribution ... 51!
Table 3: Summary Statistics ... 54!
Table 4: Comparability Measure Statistics and Validity ... 57!
Table 5: Global Financial Reporting Comparability Trend ... 59!
Table 6: Univariate Tests of Global Financial Reporting Comparability Determinants .. 62!
Table 7: Multivariate Test of Global Financial Reporting Comparability Firm-Level Determinants ... 65!
Table 8: Multivariate Test of Global Financial Reporting Comparability Country-Level Determinants ... 67!
Table 9: Sensitivity Analysis ... 70!
LIST OF FIGURES
Figure 1: Global Financial Reporting Comparability by Year ... 46 Figure 2: Global Financial Reporting Comparability by Country ... 47
LIST OF APPENDICES
Appendix 1: Variable Definitions ... 76!
LIST OF ABBREVIATIONS Country Codes AU ... Australia BR ... Brazil CA ... Canada CN ... China DE ... Germany ES ... Spain FR ... France GB ... United Kingdom IN ... India IT ... Italy JP ... Japan KR ... South Korea MX ... Mexico RU ... Russia US ... United States
LIST OF ABBREVIATIONS – Continued Industry Codes
5010... Energy: Fossil Fuels 5020... Energy: Renewable 5110 ... Basic Materials: Chemicals 5120... Basic Materials: Minerals 5130 ... Basic Materials: Applied Resources 5210 ... Industrials: Goods 5220... Industrials: Services 5240... Industrials: Transportation 5310... Consumer Cyclicals: Automobiles 5320... Consumer Cyclicals: Products 5330... Consumer Cyclicals: Services 5340... Consumer Cyclicals: Retailers 5410... Consumer Non-Cyclicals: Food & Beverage 5420 ... Consumer Non-Cyclicals: Personal & Household 5430... Consumer Non-Cyclicals: Food & Drug Retailing 5510... Financials: Banking & Investment Services 5530... Financials: Insurance 5540... Financials: Real Estate 5550... Financials: Collective Investments 5610... Healthcare: Services
LIST OF ABBREVIATIONS – Continued Industry Codes – Continued
5620... Healthcare: Pharmaceuticals & Research 5710... Technology: Equipment 5720... Technology: Software & IT Services 5810... Telecommunication 5910... Utilities
1. INTRODUCTION
Motivated by ongoing worldwide efforts to improve the comparability of reported accounting numbers, this study examines the temporal trend in global financial reporting comparability and the factors that explain its variation.1
The construct of accounting comparability is commonly defined as two firms reporting similar accounting amounts when faced with similar economic outcomes. Standard-setters, regulators, and other stakeholders around the world maintain that comparability is an important attribute for financial statement users. Both the United States Financial Accounting Standards Board (FASB) and International Accounting Standards Board (IASB) designate improved comparability of global accounting information as a commonly-shared goal.2
Among the argued benefits of improved global financial reporting comparability are reduced costs for both users and preparers of financial statements and facilitated cross-border capital flows. Indeed, research confirms the market benefits of improving comparability (e.g., Aggarwal, Klapper, and Wysocki, 2005; Hail, Leuz, and Wysocki, 2010; DeFond, Hu, Hung, and Li, 2011). Motivated by these efforts and the findings of prior research, this paper assesses whether global efforts to improve comparability have succeeded in the long-term and examines the factors that accentuate or mitigate observed comparability trends.
1 The terms “financial reporting comparability”, “accounting comparability”, and “comparability” are used interchangeably throughout the paper.
2 The FASB believes that pursuing more comparable global accounting standards is consistent with its core mission to establish accounting standards that result in financial reporting “that provides decision-useful information to investors and other users of financial reports” (http://www.fasb.org/facts/). Other standard-setters and regulators share this objective: for example, the IASB, Australia, Canada, New Zealand, and Japan include comparability in their “conceptual framework” equivalents.
First, the paper develops a firm-level measure of global financial reporting comparability. The basic intuition in operationalizing comparability is that economic outcomes of comparable firms should map similarly under each of their accounting systems, resulting in a higher comparability score. Accordingly, this paper builds on prior research (Barth, Landsman, Lang, and Williams, 2012) and develops an accounting system model within each country-industry-year using firm earnings, and estimates a given firm’s economic outcome (stock return) under each country’s model. A firm’s comparability score is assessed as the median difference between fitted returns using its home country accounting model and fitted returns under the other sample country models: lower (higher) differences are indicative of a firm whose accounting is more (less) comparable with firms in the same industry and year across the sample. The measure is derived using a broad 15-country sample focusing on the world’s largest economies between 2000 and 2014. The sample selection trades off capturing a
significant share of the global economy (as defined representing over 75% of global gross domestic product) with the need for data availability and a sufficient number of firms within a given country-industry-year to allow estimation. Descriptive and empirical evidence provide construct validity of this measure.
Next, the paper examines the overall temporal trend in comparability by testing the prediction that comparability is improving over the sample period. This prediction is motivated by the collective and explicitly-stated efforts of standard-setters worldwide, including the FASB and IASB, as well as increasing economic integration across borders over time. Despite these expressed intentions, prior literature suggests numerous
frictions that can inhibit their outcomes, such as firm reporting incentives and the degree of enforcement within jurisdictions. The results reveal that average comparability is increasing over the sample period 2000 to 2014; the rate of improvement is
conservatively estimated at 1.8% per year. However, the analysis also reveals year-to-year variability in the change in comparability.3
Finally, this paper applies regression analysis and principal component factor analysis to examine potential variation in the temporal trend of comparability. It begins by examining firm-level factors. Following prior research on the impact of firm reporting incentives on observed financial reporting (e.g., Ball, Robin, and Wu, 2003; Burgstahler, Hail, and Leuz, 2006; McVay, 2006), the paper provides construct validity by confirming that average comparability (i.e. level) is lower for firms with lesser information demands (small firms and low profit firms), not experiencing growth, not cross-listed, following local standards (versus US GAAP or IFRS), and having more information asymmetry. More importantly, the paper predicts and finds that the previously-documented increasing comparability trend is heightened for firms that are smaller or applying local standards and diminished for those that are less profitable. The latter results are consistent with (i) over-time improvements in comparability arising mostly from firms with lesser
information demands, indirectly suggesting firms with higher informational demands have already reached their maximum relative comparability, (ii) jurisdictions
strengthening their local GAAP over time (e.g., through global standard adoption and/or convergence efforts), and (iii) operational uncertainty restricting less profitable firms’
ability to improve their comparability with peers. Next, the paper examines country-level factors.4
Following prior literature on the impact of countries’ institutional frameworks on observed financial reporting (e.g., Ball, Kothari, and Robyn, 2000; Leuz, Nanda, and Wysocki, 2003; Bradshaw and Miller, 2008), it provides additional construct validity by confirming that average comparability is lower for countries of code law legal origin, poor regulatory quality, and smaller equity markets. More importantly, the paper then predicts and finds that the
previously-documented increasing comparability trend is heightened for countries with weaker regulation. This indicates that the over-time improvements in comparability arise
principally in jurisdictions with historically weaker regulation, implying improvements in their regulatory structure. Further, it indirectly suggests that jurisdictions with
historically stronger regulation have already reached their maximum relative financial reporting comparability.
This study makes three contributions. First, it provides a firm-level time-series measure of global financial reporting comparability that is calculated using widely-available data. As such, this paper complements prior research by introducing an alternative measure by which the financial reporting construct of comparability can be empirically measured (e.g., De Franco, Kothari, and Verdi, 2011; Barth et al., 2012) and applied in cross-country settings. Second, it contributes to the literature on international accounting comparability (e.g., Barth, Landsman, and Lang, 2008; Brochet, Jagolinzer, and Riedl, 2013) by providing evidence of a long-term increase in global comparability
using a broad cross-country sample across US GAAP, IFRS, and local GAAP. Third, it documents firm- and country-level attributes that accentuate and mitigate observed reporting comparability. These insights should be relevant to regulators and standard-setters in their continuing efforts to improve accounting comparability.
The objective of this study is to identify the temporal trend in comparability that results from financial reporting changes. However, economic, political, and social forces are another potential explanation for a change in comparability over time. That is, globalization can result in not only more interconnected but also more homogenous economies. As the economic models of companies become more similar, their financial reporting also becomes more comparable (irrespective of changes to accounting). It is important to note that globalization and financial reporting changes are not mutually exclusive explanations for observed comparability trends; sensitivity analyses in the paper attempt to disentangle these differing drivers of comparability. Nonetheless, it is possible that economic effects provide a complementary (and not inconsistent)
explanation to financial reporting changes for some portion of the observed increase in comparability over time.
Section 2 discusses the prior literature and hypothesis development. Section 3 presents the research design. Section 4 reviews the sample and descriptive statistics. Section 5 presents the results. Section 6 presents the supplemental analyses and Section 7 concludes.
2. PRIOR LITERATURE AND HYPOTHESIS DEVELOPMENT
While regulators have explicitly attempted to converge accounting standards, prior studies document that the resulting impact on international accounting
comparability has not been uniform. Much of this research focuses on effects associated with the adoption of IFRS. Several studies examine non-US firms applying domestic standards versus IFRS, finding greater comparability of accounting information under IFRS (e.g., Barth et al., 2008; Yip and Young, 2012; Brochet et al., 2013); however, Cascino and Gassen (2015) finds marginal results. Studies also examine earnings comparability of non-US firms cross-listed on US markets using IFRS-US GAAP
earnings reconciliations, documenting higher comparability only in certain circumstances (e.g., Lang, Raedy, and Wilson, 2006; Henry, Lin, and Yang, 2009). Finally, Barth et al. (2012) compares accounting amounts of non-US to US firms, finding that comparability with the US is higher when non-US firms apply IFRS relative to their domestic standards.
Prior research argues that global reporting convergence cannot be accomplished by the adoption of standards (such as IFRS) alone (e.g., Daske et al. 2008; Christensen, Hail, and Leuz, 2013). The heterogeneous effect of accounting standards on
comparability is a result of various firm- and country-level factors that impact financial reporting (e.g., Ball et al., 2003; Ball and Shivakumar, 2005; Burgstahler et al., 2006; Leuz, 2006; McVay, 2006; Kim, Park, and Wier, 2012; Alissa, Bonsall, Koharki, and Penn, 2013); examples documented by prior research include country-level convergence decisions (e.g. full adoption, substantial convergence, carve-outs, or non-adopters), institutional forces (e.g. regulation and enforcement), and firm-specific incentives.
Consequently, even when subject to the same accounting standards, considerable differences in reporting practices can exist across firms and countries because a firm’s observed financial reporting is ultimately a cost-benefit trade-off determined by the factors influencing managerial incentives. This differing implementation can inhibit comparable financial statements—even for two firms ostensibly using the same accounting standards.
The paper’s first objective is to assess the overall temporal trend in global
financial reporting comparability. Regulatory efforts over the past decade explicitly aim to increase comparability; these include efforts by the FASB and IASB to converge the standards issued under US GAAP and IFRS, as well as broader efforts by domestic standard-setters. For example, many jurisdictions attempt to improve financial reporting comparability under their local GAAP (e.g., Canadian GAAP is essentially IFRS, Indian GAAP has evolved based on global standards, and Chinese GAAP is substantially converged with IFRS). Much of these efforts are driven by a capital market demand for information; allowing comparisons of firms across jurisdictions should facilitate more efficient capital allocation. Acknowledging these collective efforts, this paper predicts that global financial reporting comparability is increasing over time.
However, a number of frictions can inhibit efforts to improve comparability. These include frictions related to firm implementation, such as reporting incentives and financial reporting resources. They also include frictions related to accounting standard-setters, such as resources to cooperate with other standard-setters in developing
Finally, they include frictions related to country-level institutions, such as regulatory mechanisms. Examples of the latter include resources to ensure proper implementation, functioning judiciary systems to enact penalties when necessary, and market features (such as a the presence of information intermediaries and institutional investors). All of these frictions provide tension, suggesting global financial reporting comparability may not improve over time.
Accordingly, the paper’s second objective is to examine the impact of specific factors influencing the global financial reporting comparability trend. It considers both firm- and country-level characteristics that can improve and/or worsen observed changes in comparability over time. The paper begins by considering the findings of prior
research, and how these characteristics affect the expected average (i.e., level) of comparability. Subsequently, it discusses how these characteristics affect the observed changes in comparability over time.
The following five firm-level attributes are assessed: external demand for information (i.e., size and profitability), growth, information asymmetry, cross-listing, and accounting standards. First, larger firms are associated with higher comparability; these firms experience greater investor demands for comparable financial information (Bradshaw, Bushee, and Miller, 2004) and are subject to more scrutiny from regulators and investors, which limits their financial reporting discretion. Related, comparability should be higher for more profitable firms, which are associated with more forthcoming disclosures (Cascino and Gassen, 2015)—in contrast to loss firms, which are associated with greater uncertainty and information asymmetry (e.g., Hayn, 1995; Collins, Pincus,
and Xie, 1999). Second, the association between firm growth and comparability is unsigned (Core 2001): on the one hand, firm growth can be indicative of greater uncertainty associated with new projects or growth opportunities that impede
comparability; on the other hand, firms experiencing growth have greater external capital demands and may report more comparable accounting amounts to attract investors. Third, comparability should be lower for firms exhibiting higher information asymmetry: lower information asymmetry is associated with more frequent and higher quality
reporting, thus reducing the dispersion in observed financial outcomes (Fu, Kraf, Zhang, 2012). Fourth, cross-listing is associated with higher comparability: cross-listed firms are subject to the laws and enforcement of foreign countries, with increased attention from capital market participants, which increase the potential costs of misreporting (e.g., Leuz, 2003; Lang et al., 2006). Finally, prior research documents that following the same accounting standards generally improves comparability (e.g., Lang, Raedy, and Wilson, 2006; Barth et al., 2008; Barth et al., 2012; Brochet et al., 2013); following similar standards narrows the set of permissible accounting treatments and decreases dispersion in observed financial outcomes.
The paper also considers the effect of country-level characteristics on
comparability. Prior research shows that reported accounting amounts do indeed reflect differences in institutions (e.g., Ball et al., 2000; Leuz et al., 2003; Bradshaw and Miller, 2008).5
A country’s institutional infrastructure is comprised of the legal system, regulatory and enforcement agencies, industry associations, and standard-setters that
5 Similarly, these differences are insignificant when holding institutional factors constant (Leuz, 2003).
shape economic behavior (Hail et al., 2010). Accordingly, the following three country attributes are considered: legal origin, regulatory quality, and market development. First, legal origin broadly captures the level of investor protection in a country. Common law countries are associated with higher comparability, while code law countries have weaker investor protections and more concentrated firm ownership, resulting in greater
information asymmetry (La Porta, Lopez-de-Silanes, Shleifer, and Vishny, 1999). Second, stronger regulation is associated with higher comparability. Regulatory quality impacts how accounting standards are interpreted, implemented, and enforced, as well as managers’ views on earnings management and fraudulent reporting. Companies in countries with strong regulation may be less willing to depart from mainstream accounting because of more severe potential consequences (Zeff, 2007). Third, more developed equity markets are associated with higher comparability. Equity markets develop jointly with other country characteristics; larger markets necessitate better regulation, involve greater investor oversight, and consequently create demand for high-quality, comparable financial statements. Conversely, less integrated capital markets support more relationship-lending and private communication channels, making observed financial reporting less comparable (e.g., Burghstahler et al., 2006; Bushman and
Piotroski, 2006).
The aforementioned prior literature focuses on how average comparability (i.e., level) differs across firm- and country-level factors. However, the objective of this study is to explain variation in the long-term comparability temporal trend. If the incentives to, and benefits of, improving comparability are equivalent across all firms, then average
comparability may differ, but the rate of comparability change should be the same (i.e., the null hypothesis). Otherwise, there are four possible alternate outcomes for the impact of firm- and country-level determinants on the long-term trend in comparability. First, firms/countries with higher average comparability could continue to experience greater incentives and benefits of improved comparability, thus continuing to improve faster than their peers with lower average comparability. Second, firms/countries with higher
average comparability could “drift” over time and revert to their previous conventions in making accounting judgments, thereby reducing their rate of improvement, not
improving, or actually worsening their comparability over time, relative to their peers with lower average comparability. Third, firms/countries with weaker average comparability could experience greater increases in global financial reporting
comparability. Given that this group is less comparable on average, these firms may be more subject to global improvement efforts than their peers with higher average
comparability. Fourth, firms/countries with weaker average comparability may have fewer incentives on average to report in a comparable manner, suggesting they do not reach the point at which comparability becomes important; their rate of change may always be stagnant or worsening. For these reasons, the alternate form hypothesis is unsigned; this paper predicts the long-term comparability trend will vary across cross-sectional firm incentives and country institutions.
This paper differs from prior literature in two primary ways. First, it does not focus on the adoption of IFRS. Rather, it examines global accounting comparability in the long-term, and expects changes in accounting standards to only be one factor
influencing overall comparability. This difference in sample composition is important because the benefits of improved accounting comparability extend beyond US GAAP and IFRS jurisdictions. Second, the sample is based on global GDP coverage and extends beyond countries using IFRS or US GAAP. In doing so, the paper can provide evidence on global financial reporting comparability rather than IFRS-US GAAP comparability. Given intentions and efforts to improve comparability on a global scale, and the potential for comparability to fluctuate, it is important to understand the extent to which global efforts have succeeded, as well as the factors that accentuate or mitigate comparability over time.
3. RESEARCH DESIGN
The research design first develops a measure of comparability, discusses potential concerns, and provides construct validity evidence. Then the measure is used in models to assess the overall comparability trend and its cross-sectional determinants.
3.1 Measuring Comparability
The FASB and IASB conceptual frameworks define comparability as two firms reporting similar accounting amounts when faced with similar economic outcomes. De Franco et al. (2011) (hereafter “DKV”) develops a measure of comparability to assess if a US firm’s earnings is comparable to that of other firms in its industry. DKV measures comparability using a time-series regression of quarterly earnings onto stock returns. Related, Barth et al. (2012) (hereafter “BLLW”) adapts the DKV measure to assess comparability of US GAAP and IFRS accounting systems in a cross-sectional setting. BLLW implements a regression of returns onto earnings to define comparability. Given
its prior use in an international setting and the lower availability of quarterly financial data for non-US firms, the comparability measure in this study builds upon the BLLW model.
The financial reporting comparability measure, COMP, is generated at the firm-level by year, and can incorporate firms following any set of accounting standards. Thus, it is a more generalizable estimation relative to the implementation of BLLW (which accommodates only two sets of accounting standards).6
Furthermore, by using
contemporaneous data, it is a more flexible estimation of comparability than DKV (which requires historical time-series data). The relaxed sample and data requirements make this a more comprehensive measure, allowing for investigation of changes in global financial reporting comparability over time. However, the measure’s intuition follows both DKV and BLLW: if firms are comparable, then their economic outcomes should map similarly under each of their accounting systems, resulting in a high comparability score.
Construction of the comparability measure requires five steps.
First, estimate the relation between economic outcomes (stock return) and accounting amounts (earnings) within each country-industry-year having at least 10 firms:
6 The current measure of comparability differs from the BLLW measure in two primary ways. First, it is a firm-level measure incorporating firms using US GAAP, IFRS, or local GAAP; the BLLW measure is generated at a firm-pair level, using only firms reporting under US GAAP and IFRS. Second, it is computed at the industry level within each country over time; the BLLW measure is computed in a combined regression using industry and country fixed effects. Therefore, under the current construction a firm can have multiple counter-samples based on country-industry with each having a distinct accounting system model, whereas the BLLW model only has two subsamples (US and IFRS).
!"#$%&' = )*%&' + ),%&' [./$%/1$%2,] + )4%&'[∆./$%/1$%2,] + )6%&'7899$% +):%&' 7899$%×[./$%/1$%2,] + )<%&'7899$%×[∆./$%/1$%2,] + =$%&' (1)
The superscript Cj denotes the pricing multiples relating to the accounting system for country C in industry j; therefore, each ) varies across each country-industry-year in the sample. NI (ΔNI) is net income before extraordinary items per share (change in net income before extraordinary items per share) for firm i at year-end t, P is the share price, and RET is the buy-and-hold stock return beginning nine months before and ending three months after year-end. Loss is an indicator variable equal to 1 if NI is negative and zero otherwise, allowing the accounting system models to differ for loss firms (Hayn, 1995; Barth et al., 2012). All variables are measured in nominal US dollars.
Second, calculate the within-sample fitted stock return for each firm (i.e., estimate a firm’s return using its home country model).
!"#$%&',&' = )*%&' + ),%&' [./$%/1$%2,] + )4%&'[∆./$%/1$%2,] + )6%&'7899$% +):%&'7899 $%×[./$%/1$%2,] + )<% &'7899 $%×[∆./$%/1$%2,] (2)
Third, calculate the fitted stock return under each counter-sample model for each firm (i.e., estimate a firm’s return using each of the other countries’ models).7 The model requires a minimum of two countries with sufficient firms in each industry-year.
!"#$%&',&'? = )*%&'? + ),%&'? [./$%/1$%2,] + )4% &'? [∆./$%/1$%2,] + )6% &'? 7899$% @@+):%&'? 7899$%×[./$%/1$%2,] + )<% &'? 7899$%×[∆./$%/1$%2,] (3)
7 The number of counter-sample fitted stock returns per firm can vary from one (if only a firm’s home country and one other country have sufficient data a given industry-year) to N-1
For example, calculate the fitted stock returns for a US firm (country C, industry j) using the firm’s NI and P and the pricing multiples of the same industry-year from each of the other sample countries (Cj
n, where n goes from one to N number of countries in the sample).
Fourth, calculate the absolute value of the difference between the within-sample and counter-samples fitted stock prices for each firm.
A/BB$%&',&'?
= |!"#$%&',&'
− !"#$%&',&'?
| (4)
Finally, define comparability as the natural logarithm of the median difference in fitted stock returns from Equation (4), multiplied by negative one. The objective is to aggregate the distances between the within-sample and counter-samples’ fitted stock prices to one value representative of the comparability of that firm.
EFG1$% = @ −HI@[GJKLMI A/BB$% &',&'?
] (5)
Measurement using the medianimproves stability, as the mean is susceptible to the influence of outlying values. On average, each industry-year includes six countries, thus five DIFF per firm; as such, one outlier country can significantly influence the mean. The measure is also skewed by construction (the maximum value of DIFF is zero, while the minimum value is negative infinity), so the natural logarithm is used to improve the distribution. Lastly, the measure is multiplied by negative one to ease interpretation; larger values indicate higher financial reporting comparability. The result is a firm-year measure of COMP, based on an accounting system modeled by firms in the same country, industry, and year, relative to those of the counter-samples. Appendix 2
provides a detailed example of this calculation.
3.2 Comparability Measure Considerations and Construct Validity
Three concerns regarding the proposed measurement of comparability warrant further discussion. First is the potential for market inefficiencies to skew the accounting system models in Equation (1). However, the sample is limited to the largest economies, thus mitigating concerns of totally inefficient or underdeveloped markets driving the results. The comparability model also includes two elements that address market inefficiencies: (i) the dependent variable RET is defined as the buy-and-hold return for the twelve-month period ending three months after fiscal year-end, which allows for a short delay in incorporating annual accounting information into the market, and (ii) the model includes the change in earnings from the prior period, which should capture any delayed relationship if it exists. In the event that the assumption of market efficiency is invalid in some sample countries and the model cannot capture the market delay, then there should be no relationship between earnings and returns. This would attenuate the coefficients in Equation (1) towards zero in the inefficient countries and add noise to the sample.
Second, the ability of the model to disentangle the effect of financial reporting changes from concurrent changes in market forces during the sample period could limit inferences. Given that economic globalization is arguably a joint explanation for predicted increases in comparability during the sample period, sensitivity analyses in Section 6.2 address the impact of economic forces.
concern. Measurement error will add noise, biasing the results against finding significance in either direction.8
Descriptive statistics of the comparability measure are presented by year. Two tests are conducted to provide initial evidence of construct validity. First, COMP is computed using samples of country pairs expected (ex ante) to be similar and dissimilar. If countries are similar (dissimilar) in terms of size, economy, and culture, etc., then average comparability should be higher (lower). The reported t-statistic assesses whether the mean comparability scores differ in similar and dissimilar country pairs. Second, COMP is computed during periods of crisis (2007–2009) and non-crisis (2000–2006 and 2010–2014). An OLS regression of the overall temporal trend during crisis and non-crisis periods is estimated by regressing COMP on Time. The extreme financial
uncertainty, in terms of both firm operations and investment valuations, provides a setting where observed comparability should decrease relative to non-crisis periods. Additional construct validity evidence is provided in the cross-sectional analysis of the average effect of firm- and country-level determinants. The comparability measure should reflect the on-average differences in comparability resulting from firm- and country-level determinants, as indicated by prior literature.
3.3 Comparability Trend
The paper examines the overall trend in comparability during the sample period in two ways. First, the difference in mean comparability scores is assessed between “early”
8 Additionally, in a parsimonious model the effects of correlated omitted variables could be a concern. A potential correlated omitted variable in this scenario is globalization. The impact of globalization is addressed in a sensitivity analysis (see Section 6.2).
and “late” periods (defined in several ways); the reported t-statistic assesses whether the mean comparability scores differ in early- and late-periods. Second, the following OLS regression of the overall temporal trend is estimated:
EFG1$% = )*+ ),#LNJ$%+ =$% (6) COMP is firm i’s comparability score in year t (as defined in Section 3.1) and Time is a continuous variable ranging from 1 to 15, indicating the progression of time over
calendar years 2000 to 2014. The comparability measure is calculated by industry-year; therefore, standard errors are clustered at both country and industry levels. If overall comparability is increasing (decreasing), the coefficient on Time (),) will be positive (negative).
The following four analyses provide additional robustness testing of the overall comparability trend. First, a regression including country and industry fixed effects. Second, a regression using a sample that incorporates firms with March, June, and September fiscal year-ends, in addition to the main sample of December year-ends. This addresses concerns that results are driven by countries with disproportionately more calendar year-end observations.9
However, this specification is weaker in terms of aligning the period of NI with RET across firms. Third, each country is systematically excluded from the sample; the comparability measure is regenerated and the regression analysis is performed on the new 14-country sample. This ensures no single country drives the results. This analysis reports the average regression results across the 15 new
9 For example, Japan has a relatively small number of firms using calendar year-ends; most Japanese firms use March 31 fiscal year-ends. Thus, the population of Japanese firms is
samples and the proportion of those 15 regressions where the coefficient is statistically significant. Fourth, regressions are estimated by aggregating the firm-level COMP scores by industry and country (with standard errors clustered by industry and country,
respectively). If the firm-level analysis is overweighted in magnitude or significance, assessing comparability at a more aggregated level will reduce power and determine the change in comparability with less impact from individual firms.
3.4 Comparability Trend Determinants
The paper next analyzes the factors that constrain and accentuate the change in global financial reporting comparability over time. Section 2 predicts the long-term comparability trend will vary across the following firm characteristics: demand for information (i.e., size, profitability), growth, information asymmetry, cross-listing, and accounting standards. These constructs are captured using the following proxies (with attention to measures likely available given international data limitations): firm size by total assets (Assets); firm profitability by earnings per share (EPS); firm growth by the annual change in revenues (Sales_Growth); firm information asymmetry by the standard deviation of daily returns over the prior year (ST_RET); purely domestic versus cross-listed firms by cross-cross-listed status (an indicator variable, Crosslist); and a firm’s
accounting standards by the proportion of sample countries that follow the same set of standards as firm i (STDS_PCT). (See Appendix 1 for detailed variable definitions.)
The paper predicts the long-term comparability trend also will vary across the following country characteristics: legal origin, regulation, and equity market
time-series, publically available data covering the entire sample period with consistent measurement techniques. Legal origin (Common_Law) is captured by an indicator variable equaling one for countries with common law origin, and zero for countries with code law origin. Country-level regulatory characteristics are measured using: rule of law (Rule_of_Law), regulatory quality (Reg_Quality), control of corruption
(Control_of_Corr), and government effectiveness (Govt_Effective). Higher values relate to superior performance. Finally, market characteristics are captured with: gross
domestic product per capita (GDPpc), foreign direct investment as a percentage of GDP (FDI), market capitalization of public firms as a percentage of GDP (Mkt_Size), and the number of public firms to 1,000 of population (No_Firms). Higher values relate to larger equity markets. (See Appendix 1 for detailed variable definitions.)
The cross-sectional analysis begins with univariate evidence of the difference in mean comparability scores between “early” and “late” periods with firms classified into “low” and “high” groups based on the sample median of each of the firm- and country-level variables (i.e., a two-by-two design).10
Four t-statistics are presented for each variable: (1) low versus high group in the early years; (2) low versus high group in the late years; (3) high group in the early versus late years; and (4) low group in the early versus late years. The reported t-statistics assess whether the mean comparability scores differ. If overall comparability is increasing, the change from early to late periods is expected to be positive and statistically significant in both the low and high groups across the board. Note that the univariate analysis is potentially affected by unequal sample
sizes in each quadrant, as well as firms moving between low and high from the early to late periods. Thus, they provide preliminary evidence.
Next, the paper examines the effect of firm and country determinants on the trend in comparability using multivariate regression analysis. The firm and country
determinants are assessed in separate regressions because multilevel data fails the fundamental assumption of independently and identically distributed variables.11
The following OLS regression examines the impact of individual firm-level factors on global financial reporting comparability:
EFG1$% = )*+ ),#LNJ$%+ )4ONMHH_Q99JR9$%+ )6#LNJ$%∗ ONMHH_Q99JR9$% +):78T_"1O$%+ )<#LNJ$% ∗ 78T_"1O$%
+)UOMHJ9_VW8TRℎ$%+ )Y#LNJ$%∗ OMHJ9_VW8TRℎ$% +)Z[L\ℎ_OA_!"#$%+ )]#LNJ$%∗ [L\ℎ_OA_!"#$% +),*.8R_EW899HL9R$%+ ),,#LNJ$%∗ .8R_EW899HL9R$%
+),478T_O#AO_1E#$%+ ),6#LNJ$%∗ 78T_O#AO_1E#$%+ =$% (7)
COMP and Time are as previously defined. Firm characteristics are multiplied by negative one so that higher values correspond to a predicted negative impact on average comparability, with the exception of Sales_Growth. As a result, Assets is now interpreted as Small_Assets, EPS as Low_EPS, etc.; that is, increasing values correspond with fewer comparability incentives. Standard errors are clustered at the country and industry levels. If overall comparability is improving the coefficient on Time (),) will be positive and significant. Following prior research, the coefficient on Small_Assets ()4) is expected to
11 “Raising” country-level attributes to the firm level results in all firms in the country having the same value.
be negative: firms with fewer assets are expected to have lower demand for information, leading to lower comparability. More importantly, if the rate of change in comparability for firms with Small_Assets is faster (slower) than the average comparability trend, then the interaction of Time and Small_Assets ()6) will be positive (negative). Similar interpretations apply to the other variables and their interactions with Time.
For the country-level determinant analysis, the data suffers from a dimensionality problem: there are a high number of predictors (nine) relative to the annual sample size of 15 countries. In this case, factor analysis is an appropriate solution; it uses the correlation patterns in observed variables to identify unobserved latent factors. The number of factors to retain is based on Kaiser’s (1960) criterion and Cattell’s (1996) scree test. Once determined, a varimax rotation (linear transformation) is applied to obtain the set of orthogonal factors for the regression analysis. The following OLS regression examines the impact of country-level factors on global financial reporting comparability:
EFG1$% = )*+ ),#LNJ$%+ Σ,_()4,_BMaR8W.$% + )6,_#LNJ$%∗ BMaR8W.$%) + =$% (8)
COMP and Time are as previously defined. FactorNit is firm i’s factor score for Factor N (N will range from 1 to N, depending on the number of factors retained in the analysis). Standard errors are clustered at the country level. If overall comparability is improving the coefficient on Time (),) will be positive and significant. If FactorN has a positive (negative) effect on average comparability, the coefficient ()4,_) will be positive
(negative) and significant. Further, if the rate of change in comparability attributable to FactorN is faster (slower) than the average comparability trend, then the interaction of Time and FactorN ()6,_) will be positive (negative) and significant.
4. SAMPLE AND DESCRIPTIVE STATISTICS
The initial sample covers all publicly-traded companies from any country designated as within the top ten largest economies by gross domestic product (GDP) in any year over the period 2000 to 2014. This results in the following fifteen sample countries: Australia, Brazil, Canada, China, France, Germany, India, Italy, Japan, Mexico, Russia, South Korea, Spain, the United Kingdom, and the US.12
These countries encompass, on average, 76.9% of the global GDP each year. The sample begins in 2000 to include data before worldwide comparability efforts became widespread and ends in 2014, the most recent year of data available at the time of the analysis.
Market data for US firms is obtained from The Center for Research in Security Prices and accounting data from Compustat North America.13
All non-US firm data is obtained from Thomson Reuters Datastream/Worldscope. Country-level data is obtained from The Worldwide Governance Indicators 2015 Update and The World Bank’s World Development Indicators August 2016 Update. The sample is restricted to firms with calendar year-ends. Holding companies are removed, as are firms with only one year of data. Firm-year observations missing data necessary to calculate the measure of
comparability or missing variables used in the cross-sectional analysis are removed. Lastly, Firm-year observations in a country-industry-year that is too small (fewer than 10
12 Gross domestic product data obtained from the International Monetary Fund. 13 US firm data was obtained from Compustat due to the ease of collection. A simple
comparison of US firms (by CUSIP) across Compustat and Worldscope databases during the sample period reveals the following: (i) 700 Compustat firms are not identified in
Worldscope, (ii) 2,451 Worldscope firms are not identified in Compustat, and (iii) 10,983 firms are identified in both Compustat and Worldscope. The final US sample consists of 5,820 firms from Compustat, all of which are also available in Worldscope. Therefore, it does not appear that the US sample is significantly affected by its data source.
firms) are excluded. Following BLLW, all variables are winsorized at the 5% and 95% levels to mitigate the effects of outliers.14
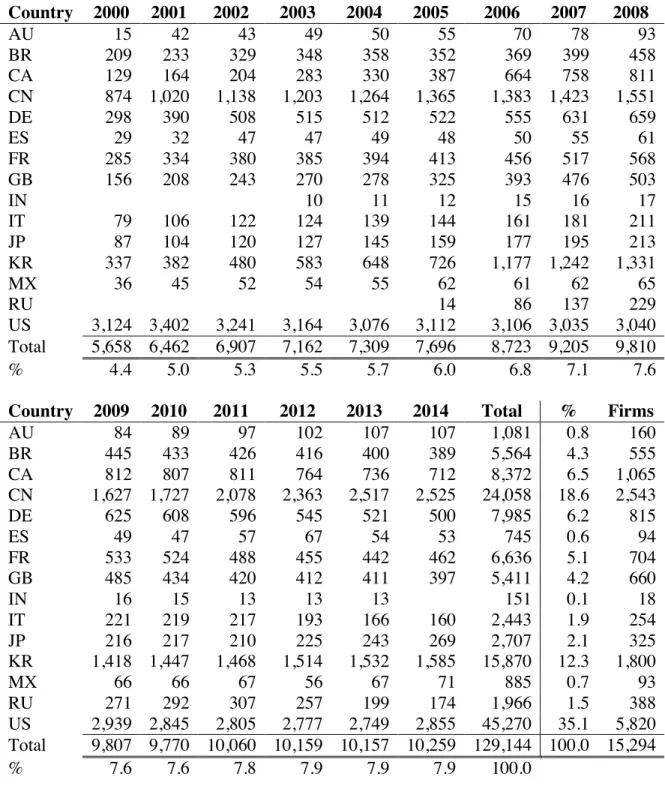
The final sample comprises 15,294 firms and 129,144 firm-year observations as detailed in Table 1.
<Table 1>
Table 2, Panel A presents sample firms by country and year: the greatest
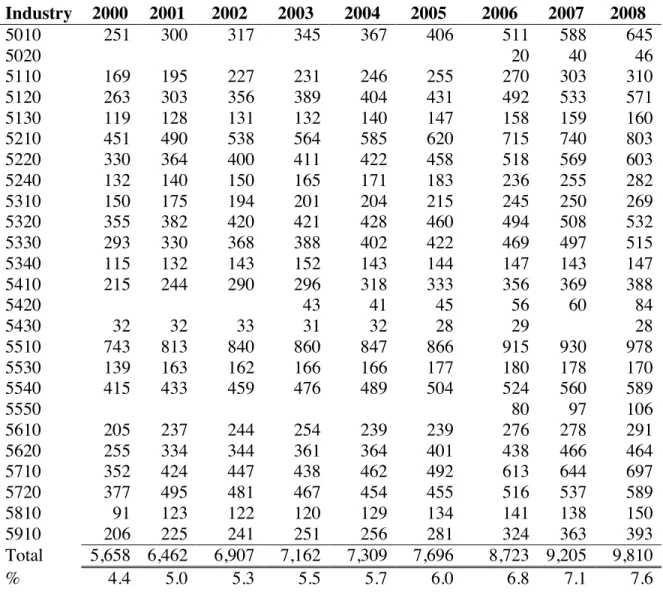
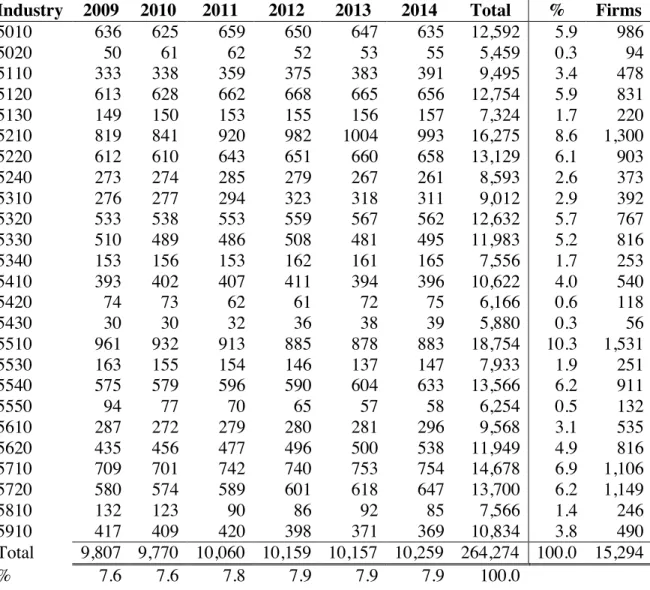
proportion is from the US (35.1%), followed by China (18.6%) and South Korea (12.3%). Panel B provides an industry breakdown by year.15
Sample firms are from various industries, with the Financial (5500’s), Industrial (5200’s), and Consumer Cyclical (5300’s) sectors making up approximately 52% of the sample. Both panels show an increase in the number of firms entering the sample over time; later years have more observations than earlier.
<Table 2>
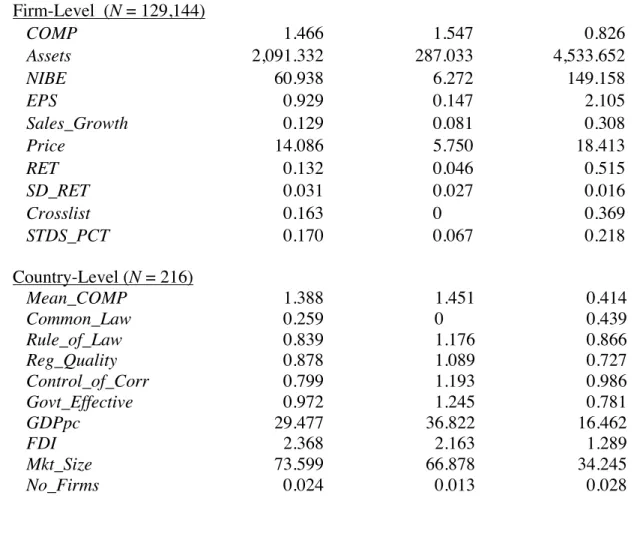
Table 3, Panel A shows descriptive statistics for all variables used in the analyses.
14 Variables are winsorized separately for pre- and post-2006 sample years, to avoid disproportionately winsorizing later observations, since 2007 and 2008 have a larger concentration of negative stock returns.
15 Industries are defined by business sector using Thomson Reuters (TR) Business
Classifications, as this is the most populated industry classification for the non-US firms. The TR Business Classifications are five levels: economic sector, business sector, industry group, industry, and activity (listed from general to specific). These are “static”
classifications; firms are classified by their industry at the date of data retrieval only (July 2016), versus a “time series” industry classification that could vary over time for a given firm. US firms are classified based on Global Industry Classification Standard (GICS) industry groupings. Therefore, the GICS industry groupings were aligned with the TR business sector classifications and the US firms’ GICS were converted to TR business sectors. Industry classification at the second-most aggregated level (four-digit GICS and TR Business Sector) is sticky; however, if a firm changes focus over the sample period the static Thompson Reuters industry classification would be inaccurate. Given that GICS industry classifications can vary over time, the proportion of US firms that changed GICS industries during the sample period was examined. None of the US firms switched industries, therefore
The average (median) total assets of a sample firm is $2,091 ($287) million. Firms are generally profitable with mean (median) net income of $61 ($6) million annually. Across the entire sample period, approximately 16% of the firms cross-list in at least one other country and on average only a small proportion of the countries utilize the same
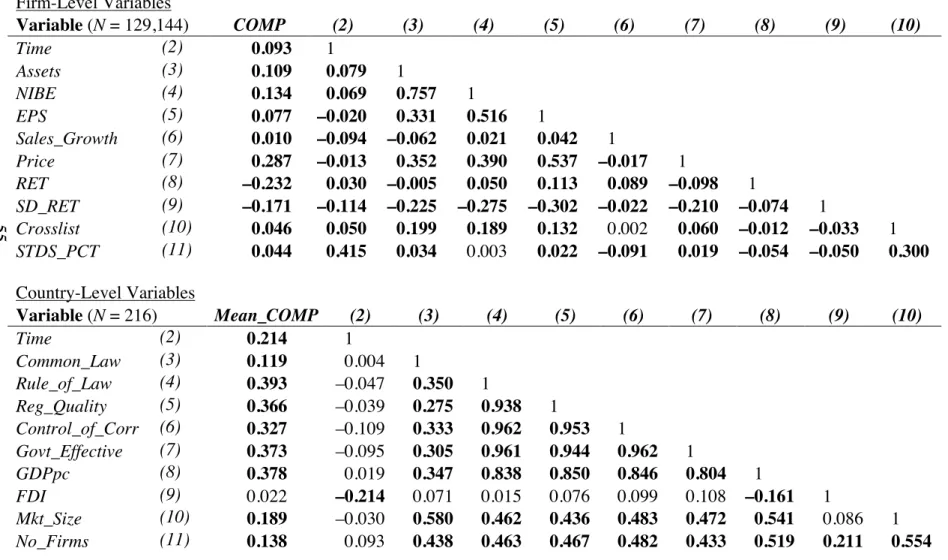
accounting standards (17%). Due to the size of the US equity market relative to all other countries, the sample is weighted towards US firms that tend to be larger and more profitable than international firms; analyses are robust to excluding US firms and limiting their inclusion to a randomly selected 50 firms in each industry-year (Section 6.1). Table 3, Panel B presents correlations of the firm-level and country-level variables. Not
surprisingly, the latter suffer from high correlations; therefore, the country determinant cross-sectional analysis is structured to specifically address the potential multicollinearity issue.
<Table 3>
5. EMPIRICAL RESULTS
The results present descriptive statistics and construct validity evidence of the comparability measure, followed by evidence of the overall comparability trend and its cross-sectional determinants.
5.1 Comparability Measure Considerations and Construct Validity
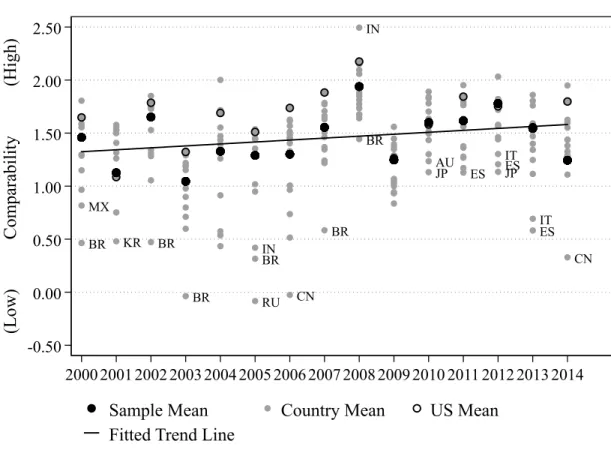
Figure 1 graphically depicts firm- and country-level comparability over time. Table 4, Panel A shows the corresponding distribution of firm-level comparability scores each year. Mean COMP in Table 4, Panel A corresponds to the sample mean depicted in Figure 1. The comparability exhibits considerable variation both within and across years:
the lowest firm comparability score is 2012 (–6.307) and the highest is 2007 (11.021). This equates to average differences in fitted returns of 548.249 and 0.00002 for the worst and most comparable firms, respectively, based on the inverse of the COMP natural logarithm. Additionally, the variation in COMP seems to be narrowing as time
progresses; it appears that the standard deviation of COMP becomes smaller over time. <Figure 1>
Concerns regarding the proposed measurement of comparability were identified and discussed in Section 3.2. To further address potential market inefficiencies, the resulting comparability scores (untabulated) are robust to redefining the measure with RET defined as the 12-month adjusted buy-and-hold stock return window ending six months after fiscal year end. To address the reverse scenario (where the accounting system is inefficient relative to the market), future period change in earnings is added to Equation (1) and the resulting comparability scores (untabulated) are robust. Lastly, Section 6.2 addresses the ability of the model to disentangle the effect of financial reporting changes from concurrent changes in market forces during the sample period.
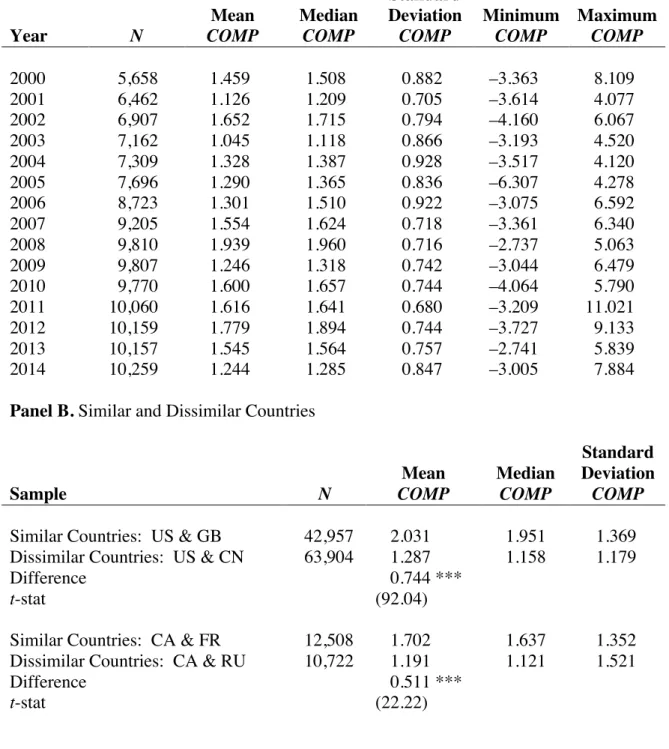
To provide initial evidence of construct validity, COMP is computed using samples of countries expected (ex ante) to be similar and dissimilar. Table 4, Panel B shows two different comparisons of country-pairs with higher and lower ex ante comparability. If countries are similar (dissimilar) in terms of size, economy, and culture, then average comparability should be higher (lower). First, US and GB, higher ex ante comparability, are compared to US and CN, lower ex ante comparability. The mean (median) comparability across all firms/years in the sample of similar countries is
2.031 (1.951) and 1.287 (1.158) in the sample of dissimilar countries; the difference in means of 0.744 is significant statistically (t-stat=92.04) and in magnitude relative to the mean COMP within each sample. Second, CA and FR, higher ex ante comparability, are compared to the CA and RU, lower ex ante comparability. The mean (median)
comparability across all firms/years in the sample of similar countries is 1.702 (1.637) and 1.191 (1.121) in the sample of dissimilar countries; difference in means of 0.511 is significant statistically (t-stat=22.22) and in magnitude relative to the mean COMP within each country.
Table 4, Panel C presents COMP during periods of crisis (2007–2009) and non-crisis (2000–2006 and 2010–2014). The extreme financial uncertainty, in terms of both firm operations and investment valuations, provides a setting where observed
comparability should decrease relative to non-crisis periods. Column (1) shows the comparability trend is indeed decreasing during the crisis (–0.160, p<0.10), while Column (2) shows it increasing during non-crisis periods (0.022, p<0.01).
Therefore, Table 4 provides evidence that COMP appropriately captures the construct of comparability; additional construct validity evidence is provided in the cross-sectional analysis of the average effect of firm- and country-level determinants in Section 5.3.1. The comparability measure should reflect the on-average differences in
comparability resulting from firm- and country-level determinants, as indicated by prior literature.
5.2 Comparability Trend
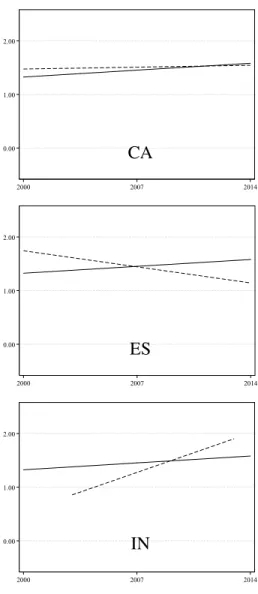
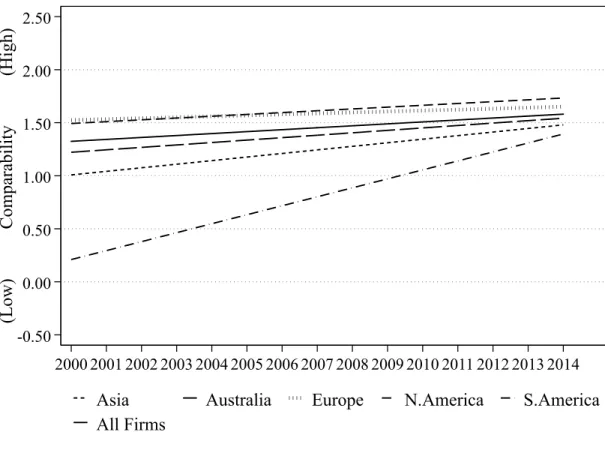
Figure 1 provides initial evidence of the comparability trend. The Fitted Trend Line is the line of best fit from a linear regression of COMP on Time, suggesting that there is an overall increasing comparability trend over time. It is clear that comparability exhibits considerable variation from year-to-year and the change in average yearly comparability is not monotonic. While the overall comparability trend in Figure 1 appears to be increasing, it is evident in Figure 2 (financial reporting comparability over time by country) that firms in some countries are increasing comparability while others remain relatively constant or are decreasing.
<Figure 2>
Univariate and multivariate tests are used to assess the statistical significance of the overall trend. Table 5, Panel A presents univariate tests of the mean comparability score when the sample is partitioned into early and late periods. In all three scenarios (dividing the sample at 2006, at 2007, and comparing the first five to the last five sample years), average comparability is statistically increased (p<0.01) from the early to late period. The increase in comparability equates to the average difference in fitted returns being reduced by 0.051, 0.061, and 0.057 when the sample is partitioned at 2006, at 2007, and by the earliest and most recent five-year periods, respectively.
Table 5, Panel B presents the comparability trend regression analysis. Across all specifications, the coefficient on Time is significantly positive; supporting the prediction that average comparability is increasing over time. The coefficient of 0.018 (p<0.01) in the main specification (Column (1)) indicates that average comparability increases by
1.8% each year. The average annual increase is largest at 2.5% when including country and industry fixed effects (Column (2)). The coefficient of 0.013 (p<0.01) in Column (3) incorporates firms with March, June, and September fiscal year-ends, in addition to the main sample of December year-ends. This addresses concerns that results are driven by countries with disproportionately more calendar year-end observations; however, this specification is weaker in terms of aligning the period of NI with RET across firms. Column (4) indicates that results from the main specification remain when systematically excluding each country from the sample; suggesting the results are not driven by any single country. In the industry level regression, Column (5) shows that comparability increases by 2.0% annually (p<0.01). In the country-level analysis, Column (6) shows that comparability increases by 2.1% annually (p<0.05). The industry- and country-level regressions alleviate concerns that the firm-level analysis is overweighted in magnitude or significance.
Overall, these analyses indicate that global financial reporting comparability is increasing over the period 2000 to 2014, consistent with expectations. The results
provide a conservative estimate of the increase at 1.8% annually, or a cumulative increase of 28.7% over the sample period.
<Table 5>
5.3 Comparability Trend Cross-Sectional Analysis
Given variation across firm incentives and country institutions, it may not be optimal for all firms to produce similar reporting (e.g., Hail, Leuz, and Wysocki, 2010). Accordingly, the following sections examine how firm characteristics, reporting
incentives, and institutional frameworks explain the variation in the overall comparability trend identified in Figures 1 and 2.
5.3.1 Comparability Trend Cross-Sectional Analysis - Univariate
Table 6 reports the results of two-by-two univariate tests on comparability determinants. The sample period is partitioned into “early” and “late” years with firms/countries divided into “high” and “low” groups based on the sample median of each of the aforementioned firm- and country-level variables. If overall comparability is increasing, the change from early to late periods is expected to be positive and
statistically significant in both the low and high groups across the board. Recall that Section 2 predicts the long-term comparability trend will vary across the following characteristics: firm-level demand for information (i.e., size, profitability), growth, information asymmetry, cross-listing, accounting standards, and country-level legal origin, regulation, and equity market development. If prior literature indicates low levels of a given factor have a predicted negative effect on average comparability, then the difference between the low and high groups is expected to be negative and statistically significant, and vice versa. Moreover, the difference in the low versus high groups’ long-term comparability trend is presented in the lower right cells of Table 6. If the low (high) group has a more significant increase over the period, then the result is expected to be positive (negative). Due to the unequal sample sizes in each quadrant, and potential for firms to move between low and high groups from the early to late periods, the univariate analysis cannot assess whether the temporal trends of low and high groups differ.
The Table 6 analyses provide descriptive evidence consistent with the overall comparability trend analysis. Across all partitions, both low and high groups are
improving comparability from the early to late period; “Chg. Low” and “Chg. High” are positive and significant in all factor partitions with the exception of Mkt_Size and No_Firms (Chg. High is positive but not significant).
The results also generally confirm prior literature’s findings on average comparability levels and provide additional construct validity for the comparability measure. Table 6, Panel A reports the results of the univariate tests on firm level determinants of financial reporting comparability. Measures of a firm’s demand for information (Assets and EPS) show that firms with low demand for information have lower average comparability in both early and late periods. Firms experiencing more growth (Sales_Growth) and cross-listed firms (Crosslist) have higher average
comparability in both early and late periods, while firms with high information
asymmetry (SD_RET) have lower average comparability in both early and late periods. Counter-intuitively, the high STDS_PCT group, where a high proportion of sample countries follow the same standards as the firm, appears to have lower average
comparability than firms using domestic standards in the early period, but higher average comparability in the late period. This is likely a result of the fact that high and low groups are determined by the sample median, which is very low for STDS_PCT due to the dispersion in accounting standards prior to the global accounting standards
movement. Therefore, the low and high groups are not accurately represented in the univariate test.
Continuing to confirm prior literature’s findings on average comparability levels and provide additional construct validity for the comparability measure, Table 6, Panel B reports the results of the univariate tests on country-level determinants of financial reporting comparability. Countries of code law legal origin (Common_Law), weaker regulation (Rule_of_Law, Reg_Quality, Control_of_Corr, and Govt_Effective), and less developed markets (GDPpc, FDI, Mkt_Size, and No_Firms) generally demonstrate lower average comparability in both early and late periods; in all factor partitions the low group has lower average comparability in the early period (statistically significant in seven of nine partitions) and in seven of nine factor partitions the low group has lower average comparability in the late period (statistically significant in five of nine partitions).
Returning to the objectives of this analysis, the differences in the low versus high groups’ long-term comparability trends are generally meaningful in magnitude relative to the average comparability scores in both Table 6, Panels A and B, suggesting that these variables are determinants of the comparability trend. However, recall that due to the unequal sample sizes in each quadrant, and potential for firms to move between low and high groups from the early to late periods, a multivariate analysis is necessary to
determine whether the temporal trends of low and high groups differ.
5.3.2 Comparability Trend Cross-Sectional Analysis - Multivariate
Multivariate results assessing the firm-level determinants of global financial reporting comparability are presented in Table 7. Recall that Section 2 predicts the long-term comparability trend will vary across the following firm characteristics: demand for
accounting standards. Consistent with overall comparability increasing, the coefficient on Time remains positive and statistically significant (0.028, p<0.01). The main effect of Small_Assets is negative and significant (–0.001, p<0.01) and its interaction with Time is positive and significant (0.001, p<0.01); smaller firms are, on average, less comparable, but increase comparability more over time. The inverse interpretation for Small_Assets is that larger firms are more comparable on average, but are no longer making significant comparability increases. This indirectly suggests that large firms may have reached a maximum comparability level relative to their peers, or they have little incentives or mechanisms left by which to increase comparability further while maintaining reporting quality. The main effect of Low_EPS is not significant, but its interaction with Time is negative and significant (–0.005, p<0.10); less profitable firms increase comparability relatively less over time. This finding indicates that operational uncertainty restricts less profitable firms’ ability to increase their comparability with peers. Furthermore, the main effect of STDS_PCT is negative and significant (–1.320, p<0.01) and its interaction with Time is positive and significant (0.102, p<0.05); firms using local standards are less comparable on average, but over time they increase comparability relatively more. This result is consistent with jurisdictions strengthening their local GAAP over time (e.g., through global standard adoption and/or convergence efforts).
The main effect of High_SD_RET is negative and significant (–0.257, p<0.01), consistent with prior literature, but its interaction with Time is not significant; firms with higher information asymmetry are less comparable on average and experience an average rate of increase. The Sales_Growth and Not_Crosslist attributes do not explain any
additional variation in comparability beyond that attributed to the aforementioned firm characteristics.
The firm-level cross-sectional analysis provides evidence of the firm characteristics that influence global financial reporting comparability.16
Combined, these results show that smaller firms and firms using local accounting standards are, on
average, less comparable, but that over time their comparability increases at a relatively higher rate. Less profitable firms are not dissimilar in terms of average comparability, but they experience a lesser rate of increase over time. Finally, firms with high
information asymmetry are, on average, less comparable, but increase at the average rate. <Table 7>
Next, the paper conducts a factor analysis on country-level determinants of global financial reporting comparability; Table 8 presents the results. The correlations reported in Table 3, Panel B indicate that regressions using the raw country measures will suffer from multicollinearity. This issue, coupled with the sample’s dimensionality problem,
16 A factor analysis using the principal components method on the firm-level determinants is performed as a robustness check. All variables from the main model are included, plus the following measures: market capitalization (firm size), return on equity (profitability), market to book ratio (growth), and a local GAAP accounting standards indicator. The analysis identifies four underlying firm characteristic factors. Factor 1 captures firm size, Factor 2 captures profitability and information asymmetry, Factor 3 captures cross-listing and accounting standards, and Factor 4 captures growth. Untabulated results show that smaller firms are on average less comparable, but that over time their comparability improves at relatively higher rate. Firms using local accounting standards and purely domestic firms have lower comparability on average, but they also improve comparability at a higher rate. Firms experiencing growth are on average more comparable with average improvement over time, and less profitable firms and firms with higher information asymmetry are not different on average, but they experience lower rates of comparability improvement over time. The cross-sectional firm-level factor analysis supplements the disaggregated analysis presented in Table 7 and provides further evidence on the firm characteristics that are influential to global