Adding diagrams to Scaladoc
Damien Obrist
Optional Semester Project
´
Ecole Polytechnique F´
ed´
erale de Lausanne
Vlad Ureche
Collaboration and Supervision
Programming Methods Laboratory (LAMP)
1
Introduction
Scala provides a rich inheritance model in which not only classes can be extended but where additionally traits can be ”mixed in” in order to obtain a behaviour similar to the one offered by multiple inheritance in other languages. Similar to extending classes, mixing in traits creates a new kind of relation between types. Furthermore, Scala’s implicit conversion feature allows to define type conversions that are used by the compiler where appropriate. This motivates the need to keep track of all this information and trying to find ways of visualizing it in Scaladoc-generated documentation.
The current implementation of Scaladoc offers the possibility to view the inheritance hierarchy of a type by the means of two links ”Linear Supertypes” and ”Known Subclasses” in the right frame of a type’s detail page. The first one allows the user to show a type’s complete list of supertypes as an enumeration in linear order (the linearization). The second one shows an alphabetically sorted list of all of the type’s know subtypes, all the way down to the bottom of the hierarchy. Both features are very useful and offer the hierarchy in the fullest precision. However, they are not always very intuitive to look at. For instance in the documentation of the scala.collection package, these two lists can become quite large and thus not very easy to overview. Indeed, the Scala library documentation (especially the Scala Collection package) was a motivator for and the initial idea behind this project.
The goal of this project was to integrate diagrams into Scaladoc in order to offer an intuitive way of viewing parts of the type hierarchy and visualizing implicit conversions.
2
Approach
Our approach was to include into the documentation two types of diagrams, class-level diagrams and package-level diagrams. They are displayed on the Scaladoc class / trait and package detail pages, respectively. They are hidden by default and can be made visible by clicking on the ”Type Hierarchy” link. In both diagrams, types are displayed as nodes and inheritance relations are indicated using arrows. Nodes representing classes and traits are colored green and blue, respectively, in order to be consistent with Scaladoc’s existing color model. An arrow pointing from one node to another one signifies that the first node is a subtype of the latter (it extends it or mixes it in).
2.1
Class-level diagrams
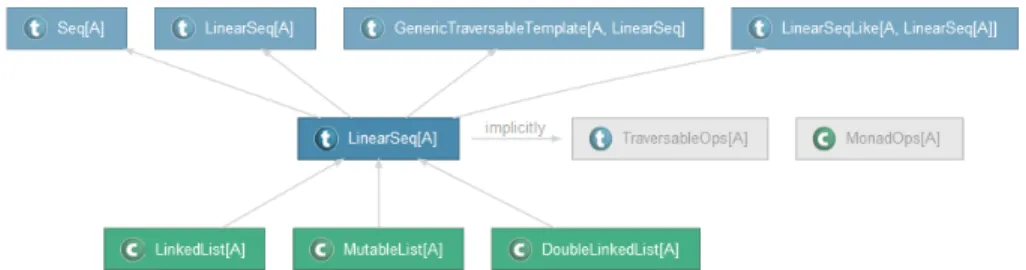
Class-level diagrams focus on the type currently being looked at in the documen-tation. This type is displayed as the center node of the diagram. On the level above, the diagram displays not the whole linearization but only the current type’s direct supertypes, i.e. all classes and traits it explicitly extends or mixes in. This avoids overcrowded diagrams and enables the user to quickly identify the key features of a type without having to look at the complete linearization. The linearization is still available in the ”Linear Supertypes” section, and can be used in order to find out the exact order of the member hierarchy (e.g. the order of super calls). Similarly, below the current type are displayed all of its direct subtypes. Instead of showing all implementing subtypes, the diagram focuses on the next-in-line in order to be concise.
In order to visualize implicit conversions within the diagram, we integrated the types the current type can implicitly be converted to or from. Our first approach was to show them as super and subnodes and connect them with a differently colored edge to the center node. However, due to their position, they were not clearly distinguishable from super and subtypes and thus easily mistaken. In order to emphasize on the fact that they are to some extent equivalent to the current type, we chose to display implicit types on the same level to left and right of the center node. This is more intuitive, as a step in vertical direction in a hierarchy diagram should correspond to an actual step in the hierarchy, which would not have been the case in our first approach.
Class-level diagrams are in fact a close-up view of a small part of the complete type hierarchy and focus on its local aspect. Figure 1 shows an example of a class-level diagram.
Package-level diagrams
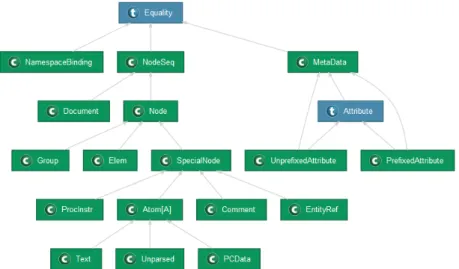
Package-level diagrams provide a more global view of the type hierarchy, a fea-ture that did not previously exist in Scaladoc. They visualize the inheritance relation between types that are defined within a given package. In order to limit the number of nodes and the complexity of the diagrams, inheritance involving types defined in other packages (including subpackages) are not shown. This aassumes that the majority of related classes are contained within the same package. Isolated nodes (not taking part in any inheritance relationship) are filtered out, as they don’t provide any information to the type hierarchy. Sim-ilarly, objects are not shown. Package-level diagrams do not visualize implicit conversions since they focus on inheritance. Implicit conversions for a given type, however, can quickly be made visible by navigating to the class-level dia-gram of that type. Figure 2 shows an example of a class-level diadia-gram.
Figure 2: Package-level diagram (scala.xml package)
Features
The implementation of Scaladoc diagrams offers a certain number of features which make them more interactive than simple static images. The nodes of a di-agram are clickable, which allows the user to quickly navigate to a certain class. When clicking on an node, the documentation page of the clicked type auto-matically opens its diagram, which allows actual exploring of the type hierarchy. Furthermore, nodes and edges are highlighted intelligently when moving over them with the mouse. The diagrams adapt to the width of the browser window
scaled down, clicking on it opens a popup with the full-size diagram. Navigating (i.e. clicking on a node) from within the popup is also possible and opens the link in the main window. The popup can be closed using the link in its top left corner or pressing ESC as a shortcut.
Another feature worthy of note about the diagram generation is that it avoids overcrowded diagrams. Consider the trait scala.Product which has 173 subtypes. Instead of showing a degenerate diagram with all children, the subtypes are combined to and represented by a single node. The tooltip of that node contains the names of all nodes represented by it. The same mechanism also holds for supertypes and implicit conversion nodes. Figure 3 shows two examples of this feature.
Figure 3: traits scala.Product and scala.collection.parallel.TraversableOps
3
Comparison to Other Documentation Tools
In this section we will briefly look at other existing documentation generators and compare their way of visualizing type hierarchies to Scaladoc’s approach.
Javadoc
In Java, classes can extend at most one class and can implement one or more in-terfaces. Interfaces however can extend multiple inin-terfaces. For classes, Javadoc generates an indented list of all superclasses all the way up to the top (i.e. the Object class). Furthermore, it displays a list of all implemented interfaces and of all direct subclasses (i.e. classes that directly extend the given class). For interfaces, Javadoc generates three lists, one for each the superinterfaces, the subinterfaces and the known implementing classes. Figure 4 shows an example of the hierarchy part of a Javadoc documentation.
Figure 4: Javadoc for classes and interfaces
Doxygen
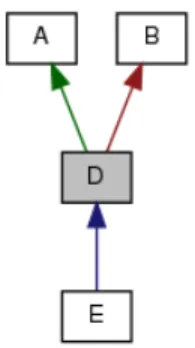
Doxygen [2] has a built-in functionality for generating inheritance diagrams, collaboration diagrams and dependency graphs. Doxygen is often used for C++ projects, which features multiple inheritance between classes. Figure 5 shows the inheritance diagram a small program containing four C++ classes. Doxygen’s diagrams are hyperlinked and can be used to navigate across the classes.
Figure 5: Doxygen sample diagram [3]
Since Java only allows single inheritance, the simple intended lists of super-classes are enough to describe the Java hierarchy. In the case of Scala and its multiple inheritance, more complex diagrams are desirable in order to illustrate the hierarchy meaningfully. Doxygen’s diagrams offer a visualization similar to the Scaladoc diagrams. However, Scaladoc diagrams use more interactive ways in order do display the information, such as highlighting related nodes on mouseover.
4
Implementation
The diagrams are generated using the Graphviz dot tool [4]. Dot is a power-ful diagram generation tool and features a sophisticated layouting engine that minimizes edge crossings. The diagram generation in Scaladoc happens in two phases.
First, a model of each diagram is created during the model-building phase of Scaladoc. Diagrams, nodes and edges are modeled by classes in a way that facilitates generating the graphical output using pattern matching and helper methods. Building the diagram model takes into account the@diagram anno-tation, which allows for fine-grained control over some aspects of the diagrams (cf. section 5).
In a second phase, when Scaladoc templates are written into HTML files, a DiagramGeneratortakes care of producing a diagram from its model. It is a trait that can possibly be implemented multiple times in order to generate diagrams using different tools or in different output formats. The default im-plementation is DotDiagramGenerator, which generates SVG diagrams using the dot tool. It proceeds as follows: it assembles a dot string from the diagram model and passes that string as an input to the dot program. Dot returns the SVG representation of the diagram, which is then further transformed in order to adjust it for our purposes. The SVG is embedded directly into the HTML files and no separate image files are created. Finally, JavaScript functions (using jQuery) and CSS definitions take care of styling the diagrams and making them interactive.
Challenges
One challenge was to find a suitable and intuitive way of visualizing the type hierarchy and implicit conversion in diagrams. Following weekly iterations, we work towards the solution presented in section 2. For class-level diagrams, another difficulty was to actually make dot layout the nodes as we wanted them to be (especially the implicit nodes). We achieved the desired layout using nested dot clusters.
Another challenge met during the project were the limitations of dot. Dot offers a great deal of possibilities and flexibility but is not really meant for making interactive and heavily styled diagrams for usage in web browsers. For instance, there is now way of assigning CSS classes to graph elements, which is essential for using CSS and jQuery in order to enhance the diagrams. Another problem was that dot generated <title> tags for every node and edge that browsers could not handle correctly and there was no way to tell dot not to generate them. We solved those and other problems by traversing dot’s SVG
output and transforming it so that it fit our needs.
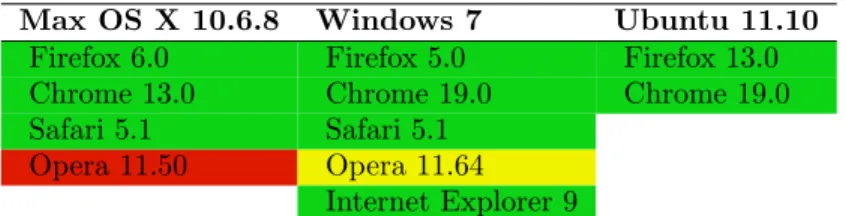
Making the diagrams work in different browsers was another difficult task that had to be accomplished. SVG, like HTML, is interpreted slightly differently across different browsers. Far worse though is the interaction between SVG and CSS / JavaScript, which is not even standardized and thus largely dependent on the browser. It required a lot of effort to make all the features like highlighting, resizing, cloning the diagram to the popup etc. work in multiple browsers, and as with dot, we often had to work around problems and find solutions. Figure 6 shows the browsers and systems that have been tested and for which of them the diagrams work.
Max OS X 10.6.8 Windows 7 Ubuntu 11.10
Firefox 6.0 Firefox 5.0 Firefox 13.0 Chrome 13.0 Chrome 19.0 Chrome 19.0 Safari 5.1 Safari 5.1
Opera 11.50 Opera 11.64 Internet Explorer 9 Figure 6: Cross-browser compatibility
5
Usage
Diagram generation in Scaladoc is disabled by default and requires dot version 2.26 or higher. Following Scaladoc options can be used in order to enable and configure diagram generation:
-diagrams
Enable diagram generation
-diagrams-debug
Show debug information while generating the diagrams
-diagrams-dot-path [path]
Specify full path to the dot program, e.g. ”/usr/bin/dot”
-doc-diagrams-max-classes [n]
Maximum number of super and subclasses to show
-doc-diagrams-max-implicits [n]
Some aspects of the diagrams can be controlled using the @diagram anno-tation. The annotation can be placed in a comment on a Scala class or trait :
/∗∗
∗ Comment
∗ @diagram <d i r e c t i v e s>
∗/
<directives>corresponds to a comma-separated list of directives. All valid directives are listed and explained in the following schema. Note that class names inhideClassesandhideEdgescan contain regular expressions.
hideDiagram Hide diagram for current type
hideIncomingImplicits Hide incoming implicit nodes
hideOutgoingImplicits Hide outgoing implicit nodes
hideSuperclasses Hide superclasses
hideSubclasses Hide subclasses
hideClasses "Class1, ..." List of classes / traits to hide
hideEdges "Class1 -> Class2, ..." List of edges to hide
6
Conclusion
The goal of this project was to include type hierarchy diagrams into documen-tations generated by Scaladoc. This has been achieved by adding class-level diagrams for classes and traits and package-level diagrams for package pages. The diagrams are intuitive to understand and visually fit into the existing user interface design of Scaladoc documentations. Compared to other documentation generators that feature diagrams, Scaladoc’s diagrams provide more interactiv-ity and have an improved styling.
7
Acknowledgements
I would like to thank Vlad Ureche for his supervision of the project and his contributions to it. He contributed to great parts of the project by taking care of building the model of the diagrams and also by putting a lot of effort into helping me and guiding me through the project. Thanks also to the people who gave their feedback, especially Heather Miller, who’s insights on the diagrams were very valuable. At last I would like to thank the Scala team at EPFL for providing the build infrastructure and letting us have nightly builds.
References
[1] Javadoc images: docs.oracle.com/javase/6/docs/api/
[2] www.doxygen.org
[3] Doxygen image: www.stack.nl/~dimitri/doxygen/examples/diagrams/
html/