A Profitable Hybrid Strategy for Binary Options
Luigi Rosa1
1L.S. “Ettore Majorana”, Via Frattini 11 10137, Turin, ITALY Email [email protected] Web Site http://www.advancedsourcecode.com
An emerging trading market is represented by binary options. Binary options are a convenient way of investments as they don’t require a trader to forecast actual quotes, he only needs to determine future price change direction, or predict if a price strikes a given level or not. We have developed an hybrid strategy that combines several thousands of classifiers into one strong classifier with desired performances in terms of positive predictive value and sensitivity. The proposed approach results extremely fast, suitable for high-frequency trading and computationally inexpensive. A Matlab implementation of proposed trading algorithm can be downloaded from
http://www.advancedsourcecode.com/binaryoptions.asp
Index Terms—Binary options, digital options, trading, stock market forecasting, stock price trend forecasting.
I. INTRODUCTION
inary options are trading options that require you only to predict the direction of the price movement. If your prediction is correct at the time of expiry, you will receive a fixed payoff. If your prediction is incorrect then you will lose your initial investment and will not receive any payoff. Binary options are some of the simplest trading options that are available because as a trader you know exactly what you stand to gain, and what you stand to lose. Binary options are a mass market financial instrument as they allow traders to use a flexible approach without dealing with the intricacies of traditional trading options. Binary options can be used to hedge your portfolio or for short-term speculation. These options give you the opportunity to enjoy high payouts in a short amount of time and because of this, binary options are gaining popularity all over the world. Binary options contracts are available on several underlying assets including commodities, stocks, indices and currencies. When trading binary options, you will need to place a put or call option. A put option means that you predict the price of an underlying asset will decrease from the current price at the time of expiry while a call option means you predict the price will increase. If your prediction is correct, you will finish in the money and make a profit. You will finish out of the money if your prediction is incorrect. Sometimes your trade will finish at the money which means the price of the underlying asset is the same as the time of expiry and at the time you opened the trade. If this happens you will usually be given your initial investment back. Binary options contracts have long been available over-the-counter (OTC), i.e. sold directly by the issuer to the buyer. They were generally considered "exotic" instruments and there was no liquid market for trading these instruments between their issuance and expiration. They were often seen embedded in more complex option contracts. Since mid-2008 binary options websites called binary option trading platforms have been offering a simplified version of exchange-traded binary options. It is estimated that around 90 such platforms (including white label products) have been in operation as of January 2012, offering options on some 200 underlying assets. [1]
B
II. CRITICISM
Binary options differ from more conventional options in significant ways. A binary option is a type of options contract in which the payout will depend entirely on the outcome of a yes/no proposition. The yes/no proposition typically relates to whether the price of a particular asset that underlies the binary option will rise above or fall below a specified amount. For example, the yes/no proposition connected to the binary option might be something as straightforward as whether the stock price of XYZ company will be above $9.36 per share at 2:30 pm on a particular day, or whether the price of silver will be above $33.40 per ounce at 11:17 am on a particular day. once the option holder acquires a binary option, there is no further decision for the holder to make as to whether or not to exercise the binary option because binary options exercise automatically. Unlike other types of options, a binary option does not give the holder the right to purchase or sell the underlying asset. When the binary option expires, the option holder will receive either a pre-determined amount of cash or nothing at all. Given the all-or-nothing payout structure, binary options are sometimes referred to as “all-or-nothing options” or “fixed-return options.” Some binary options are listed on registered exchanges or traded on a designated contract market that are subject to oversight by United states regulators such as the SEC or CFTC, respectively, but this is only a portion of the binary options market. Much of the binary options market operates through Internet-based trading platforms that are not necessarily complying with applicable U.S. regulatory requirements. The number of Internet-based trading platforms that offer the opportunity to purchase and trade binary options has surged in recent years. The increase in the number of these platforms has resulted in an increase in the number of complaints about fraudulent promotion schemes involving binary options trading platforms. The SEC and CFTC have received numerous complaints of fraud associated with websites that offer an opportunity to buy or trade binary options through Internet-based
trading platforms. The complaints fall into at least three categories: refusal to credit customer accounts or reimburse funds to customers; identity theft; and manipulation of software to generate losing trades. The first category of alleged fraud involves the refusal of certain Internet-based binary options trading platforms to credit customer accounts or reimburse funds after accepting customer money. These complaints typically involve customers who have deposited money into their binary options trading account and who are then encouraged by “brokers” over the telephone to deposit additional funds into the customer account. When customers later attempt to withdraw their original deposit or the return they have been promised, the trading platforms allegedly cancel customers’ withdrawal requests, refuse to credit their accounts, or ignore their telephone calls and emails. The second category of alleged fraud involves identity theft. For example, some complaints allege that certain Internet-based binary options trading platforms may be collecting customer information such as credit card and driver’s license data for unspecified uses. If a binary options Internet-based trading platform requests photocopies of your credit card, driver’s license, or other personal data, do not provide the information. The third category of alleged fraud involves the manipulation of the binary options trading software to generate losing trades. These complaints allege that the Internet-based binary options trading platforms manipulate the trading software to distort binary options prices and payouts. For example, when a customer’s trade is “winning,” the countdown to expiration is extended arbitrarily until the trade becomes a loss [2].
III. TRADING DEFINITIONS
Like most specialized fields, binary options trading has its own jargon. These words are borrowed from the more established practice of commodities and futures trading, and gives binary options an aura similar to that of derivatives [3].
Current price: The price of the underlying asset.
Strike price: The price of the underlying asset when the binary option is purchased.
Expiry price: The price of the underlying asset at the time of expiry of the binary option.
Call option: The right to buy. In binary options trading, the purchase of an offer is an exercise of the option. In American exchanges this is termed as “Finish High” because the motivation behind a call is the probability that the price of the asset when the contract expires will be higher.
Put option: The right to sell. This is also exercised when the offer to sell an option is taken. This is called “Finish Low” in American exchanges because a put is based on projections that the price of an asset will be lower when the contract expires.
In-the money: A successful trade wherein a call option expires above the strike price or a put option expires below the strike price.
At-the-money: A trade in which the price during expiration is identical to the level during purchase. In some binary options contracts, such a scenario requires the initial investment amount to be fully returned to the customer.
Out-of-the-money: A failed trade wherein a call option expires below the strike price or a put option expires above the strike price.
Usually a binary option platform allows the trader to determine their own return and risk percentages. The investor can manage the degree of risk involved in each trade by customizing the return percentage on either expiry outcome. For example, selecting 75%-10% offers a 10% return, for an out-the-money result, or an additional 75% on the original investment on an in-the-money result. Let us indicate with
F
Pthe additional fraction of money returned in case of in-the-money result ,withF
Qthe fraction of money returned in case of out-of money result, let P be the winning probability,Q
=
1
−
P
the losing probability, S the sum of money that is invested. The expected valueE
[4] is(1) E = [(probability of winning)(amount won per bet) - (probability of losing)(amount lost per bet)] By using the quantities introduced above:
(2)
E
=
P
( )
SF
P−
Q
[
S
(
1
−
F
Q)
]
Since the amount won per bet (in-the-money case) is
SF
P while the amount lost per bet (out-of-money case) isS
(
1
−
F
Q)
. The losing probability isQ
=
1
−
P
, so we have:(3)
E
=
P
( ) (
SF
P−
1
−
P
)
[
S
(
1
−
F
Q)
]
(4) Q p Q
F
F
F
P
−
+
−
=
1
1
Let us make an example: if the profit payout is 75% and the out-of-money refund is 10% we have
F
P=
0
.
75
andF
Q=
0
.
10
,so
0.545
10
.
0
75
.
0
1
10
.
0
1
1
1
=
−
+
−
=
−
+
−
=
Q p QF
F
F
P
. In this case if we want to develop a profitable strategy we have to reach aprecision
P
(also called positive predictive value [5]) equal or greater than 54.5%. If precision is smaller than this threshold value the trading system will generates irremediable losses. Together with an high precision we need also a high sensitivity (also called true positive rate): in this way the trading system will generate a greater number of call signals. On the contrary, a low value for sensitivity means that many profitable trading operations will be lost, but no loss will occur.IV. ARBITRAGE OPPORTUNITY
Let us consider two trading platforms 1 and 2. The first platform returns
F
P1as profit payout for in-the money case andF
Q1asfractional refund for out-of-money case. The second platform returns
F
P2as profit payout for in-the money case andF
Q2 asfractional refund for out-of-money case. We invest
S
1dollars on call option on the first trading platform andS
2dollars on put option on the second trading platform. Let beS
T=
S
1+
S
2the total sum of money we invest. If in-the-money case occurs we will have a net profit equal toS
1F
P1−
S
2(
1
−
F
Q2)
. On the other hand, if out-of-money case occurs we will have a net profitequal to
−
S
1(
1
−
F
Q1)
+
S
2F
P2 . By imposing that the net profits must be equal in both cases:(5)
S
1F
P1−
S
2(
1
−
F
Q2)
=
−
S
1(
1
−
F
Q1)
+
S
2F
P2 We obtain that (6) P2 Q1 P1 Q2 P2 Q2 T 1F
+
2
+
F
-F
+
F
-)
F
F
-(1
S
+
=
S
And (7) P2 Q1 P1 Q2 P1 Q1 T 2F
+
2
+
F
-F
+
F
-)
F
F
-(1
S
+
=
S
In both cases the total net profit is equal to: (8) P2 Q1 P1 Q2 Q2 Q1 Q1 Q2 P2 P1
F
+
2
+
F
-F
+
F
-)
F
F
-F
+
F
+
1
-F
(F
TS
In other terms, if the factor that multiplies
S
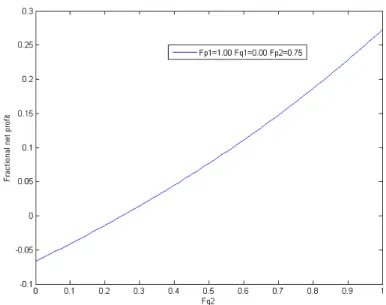
Tin equation (8) is positive, an arbitrage condition is reached, since our profit is positive independently from expiry price. This arbitrage opportunity has been reached with two proper different trading platforms.V. PROPOSED ALGORITHM
We have developed an hybrid algorithm that successfully merges most of technical indicators used in stock market forecasting. Our algorithm includes but it is not limited to:
• Bollinger Bands
• Moving Averages Filters
• Accumulation/Distribution Line
• Correlation Coefficients
• Rate of Change (ROC)
• Momentum
• Relative Strength Index (RSI)
• Discrete Cosine Transform
• Fast Fourier Transform
• Standard Deviation (Volatility)
• Williams %R
• Artificial Neural Networks [6]
• Discrete Wavelet Transform [6]
• Linear Predictive Coding [7]
Moreover we have developed new indicators that have been combined with existing ones. All weak classifiers are combined to create a strong classifier. Our goal is to predict stock price trend, in other words we want to predict if stock’s future share price will be higher than current share price. The trend prediction should have the following features:
1. high positive predictive value 2. high sensitivity
As said in the previous paragraph, a low value for positive predictive value can generate losses. On the other hand a low value for sensitivity will generate a high number of false negatives, i.e. potentially successful trading operations will be missed. We have retrieved historical data from Yahoo Finance data [8]. For each stock share we have considered daily High, Low, Open, Close price and Volume [9][10][11]. Historical data has been divided into two subsets: a variable-length training set and a fixed-length testing set. Fixed fixed-length of testing data has been set equal to 100, i.e. we have forecasted, for a given stock share, 100 consecutive days, without any overlapping between training and testing data.
In the following tables it is possible to examine the following price predictions:
• Tomorrow Closing Price (1-Day Ahead Closing Price) > Current Closing Price
• 2-Days Ahead Closing Price > Current Closing Price
• 3-Days Ahead Closing Price > Current Closing Price
• 4-Days Ahead Closing Price > Current Closing Price
• 5-Days Ahead Closing Price > Current Closing Price
• 6-Days Ahead Closing Price > Current Closing Price
• 7-Days Ahead Closing Price > Current Closing Price
Forecasted formula Tomorrow Closing Price > Current Closing Price
Input data Daily Volume, High, Low, Open and Close
Data source Yahoo Finance
Number of stock shares 487
Number of technical indicators used 4172
True positive TP 1634
False positive FP 1394
True negative TN 24274
False negative FN 21398
Positive predictive value
FP
TP
TP
+
0.5396
Negative predictive value
TN
+
FN
TN
0.5315 SensitivityFN
+
TP
TP
0.0709 SpecificityTN
+
FP
TN
0.9457Forecasted formula 2-Days Ahead Closing Price > Current Closing Price
Input data Daily Volume, High, Low, Open and Close
Data source Yahoo Finance
Number of stock shares 489
Number of technical indicators used 4172
True positive TP 2162
False positive FP 2025
True negative TN 23301
False negative FN 21901
Positive predictive value
FP
TP
TP
+
0.5164
Negative predictive value
TN
+
FN
TN
0.5155 SensitivityFN
+
TP
TP
0.0898 SpecificityTN
+
FP
TN
0.9200Forecasted formula 3-Days Ahead Closing Price > Current Closing Price
Input data Daily Volume, High, Low, Open and Close
Data source Yahoo Finance
Number of stock shares 485
Number of technical indicators used 4172
True positive TP 2911
False positive FP 2583
True negative TN 21896
False negative FN 21595
Positive predictive value
FP
TP
TP
+
0.5299
Negative predictive value
TN
+
FN
TN
0.5035 SensitivityFN
+
TP
TP
0.1188 SpecificityTN
+
FP
TN
0.8945Forecasted formula 4-Days Ahead Closing Price > Current Closing Price
Input data Daily Volume, High, Low, Open and Close
Data source Yahoo Finance
Number of stock shares 488
Number of technical indicators used 4172
True positive TP 3379
False positive FP 2948
True negative TN 21202
False negative FN 21759
Positive predictive value
FP
TP
TP
+
0.5341
Negative predictive value
TN
+
FN
TN
0.4935 SensitivityFN
+
TP
TP
0.1344 SpecificityTN
+
FP
TN
0.8779Forecasted formula 5-Days Ahead Closing Price > Current Closing Price
Input data Daily Volume, High, Low, Open and Close
Data source Yahoo Finance
Number of stock shares 485
Number of technical indicators used 4172
True positive TP 3443
False positive FP 2946
True negative TN 21073
False negative FN 21523
Positive predictive value
FP
TP
TP
+
0.5389
Negative predictive value
TN
+
FN
TN
0.4947 SensitivityFN
+
TP
TP
0.1379 SpecificityTN
+
FP
TN
0.8773Forecasted formula 6-Days Ahead Closing Price > Current Closing Price
Input data Daily Volume, High, Low, Open and Close
Data source Yahoo Finance
Number of stock shares 488
Number of technical indicators used 4172
True positive TP 3517
False positive FP 2971
True negative TN 21029
False negative FN 21771
Positive predictive value
FP
TP
TP
+
0.5421
Negative predictive value
TN
+
FN
TN
0.4913 SensitivityFN
+
TP
TP
0.1391 SpecificityTN
+
FP
TN
0.8762Forecasted formula 7-Days Ahead Closing Price > Current Closing Price
Input data Daily Volume, High, Low, Open and Close
Data source Yahoo Finance
Number of stock shares 487
Number of technical indicators used 4172
True positive TP 3557
False positive FP 3030
True negative TN 21159
False negative FN 21441
Positive predictive value
FP
TP
TP
+
0.5400
Negative predictive value
TN
+
FN
TN
0.4967 SensitivityFN
+
TP
TP
0.1423 SpecificityTN
+
FP
TN
0.8747It is important to notice that, in the testing set, a random classifier would reach a positive predictive value smaller than achieved precision. The positive predictive value of a random classifier can be simply computed as
FP
TN
FN
TP
FN
TP
+
+
+
+
. This implies that our classifier greatly outperforms the stock performance itself. Training algorithm selectively combines all weak classifiers. For each company stock or other financial instrument the proposed merging algorithm adaptively selects and combines best features. We have also experimentally verified that our combining hybrid algorithm outperforms other classifiers such as Artificial Neural Networks, Binary Decision Trees and AdaBoost.VI. TRADING SOFTWARE
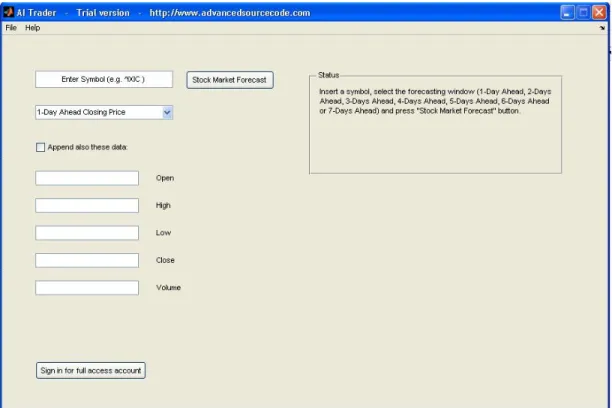
A Matlab implementation of our trading algorithm can be downloaded from
http://www.advancedsourcecode.com/binaryoptions.asp . A simple and intuitive graphical user interface (GUI) can be used to predict future share price of selected stock by simply inserting stock symbol (for example ^GSPC code for S&P 500). Software automatically reads historical data from Yahoo Finance, a trading classifier is trained and a BUY/SELL signal is visualized. Final classifier is periodically re-trained with a batch process.
Software details:
• Name: AI Trader
• Version: 1.0
• Number of technical indicators: 4172
• Requirements: Matlab, Internet connection
• Prediction type: stock price trend forecasting
• Prediction algorithm: hybrid combination of technical indicators, time-domain and frequency-domain descriptors
• Data source: Yahoo Finance
• Prediction window: 1-day ahead, 2-days ahead, 3-days ahead, 4-days ahead, 5-days ahead, 6-days ahead and 7-days ahead
• Software release: free trial with a limited number of stock market indices. Full version has complete access to all stock market indices supported by Yahoo
• Additional features: high positive predictive value, high sensitivity VII. CONCLUSION
Predicting the stock price trend by interpreting the seemly chaotic market data has always been an attractive topic to both investors and researchers. Among those popular methods that have been employed, Machine Learning techniques are very popular due to the capacity of identifying stock trend from massive amounts of data that capture the underlying stock price dynamics. In this project, we applied supervised learning methods to stock price trend forecasting. Based on our prediction result, we built a trading strategy on the stock, which significantly outran the stock performance itself. The proposed approach results extremely intriguing for binary option market.
REFERENCES
[1] Wikipedia, “Binary option,” [viewed 20 June 2014]. Available from http://en.wikipedia.org/wiki/Binary_option
[2] SEC, “Binary Options and Fraud,” [viewed 28 June 2014]. Available from http://www.sec.gov/investor/alerts/ia_binary.pdf
[3] “Binary Options Trading: An All or Nothing Gamble?,” [viewed 12 May 2014]. Available from http://financesonline.com/binary-options-trading-an-all-or-nothing-gamble/
[4] Wikipedia, “Expected value,” [viewed 22 June 2014]. Available from http://en.wikipedia.org/wiki/Expected_value
[5] Wikipedia, “Sensitivity and specificity,” [viewed 28 June 2014]. Available from http://en.wikipedia.org/wiki/Sensitivity_and_specificity
[6] Luigi Rosa, “Stock Market Forecaster,” [viewed 10 March 2007]. Available from http://www.advancedsourcecode.com/neuralnetworkforecasting.asp
[7] Luigi Rosa, “Advanced LPC Trading System,” [viewed 8 July 2009]. Available from http://www.advancedsourcecode.com/lpctrader.asp
[8] Yahoo Finance, [viewed 20 June 2014]. Available from https://finance.yahoo.com/
[9] Zabir Haider Khan et al., “Price Prediction of Share Market using Artificial Neural Network (ANN),” International Journal of Computer Applications, Volume 22, No. 2, pp. 42-47, 2011.
[10] A. Adebiyi Ayodele et al., “Stock Price Prediction using Neural Network with Hybridized Market Indicators,” Journal of Emerging Trends in Computing and Information Sciences , Volume 3, No. 1, pp. 1-9, 2012.
[11] Khalid Alkhatib et al., “Stock Price Prediction Using K-Nearest Neighbor (kNN) Algorithm,” International Journal of Business, Humanities and Technology, Volume 3, No. 3, pp. 32-44, 2013.
Fig. 2 Arbitrage opportunity with two trading platforms.