Tool Support for the Evaluation of Anomaly Traffic
Classification for Network Resilience
Anderson Santos da Silva
∗, Juliano Araujo Wickboldt
∗, Alberto Schaeffer-Filho
∗,
Angelos K. Marnerides
†, Andreas Mauthe
‡∗Institute of Informatics, Federal University of Rio Grande do Sul, Brazil Email:{assilva, jwickboldt, alberto}@inf.ufrgs.br
†School of Computing & Mathematical Sciences, Liverpool John Moores University, United Kingdom Email: [email protected]
‡School of Computing and Communications, Lancaster University, United Kingdom Email: [email protected]
Abstract—Resilience is the ability of the network to maintain an acceptable level of operation in the face of anomalies, such as malicious attacks, operational overload or misconfigurations. Techniques for anomaly traffic classification are often used to characterize suspicious network traffic, thus supporting anomaly detection schemes in network resilience strategies. In this paper, we extend the PReSET toolset to allow the investigation, compar-ison and analysis of algorithms for anomaly traffic classification based on machine learning. PReSET was designed to allow the simulation-based evaluation of resilience strategies, thus enabling the comparison of optimal configurations and policies for combating different types of attacks (e.g., DDoS attacks, worms) and other anomalies. In such resilience strategies, policies written in the Ponder2 language can be used to activate/reconfigure traffic classification modules and other mechanisms (e.g., traffic shaping), depending on monitored results in the simulation envi-ronment. Our results show that PReSET can be a valuable tool for network operators to evaluate anomaly traffic classification techniques in terms of standard performance metrics.
I. INTRODUCTION
Computer and communication networks are becoming in-creasingly important in supporting business, leisure and ev-eryday activities in general. However, due to the possibility of cyber-attacks and security threats, there is a growing need for resilience to become a key property in computer networks. Resilience is the ability of the network to maintain an ac-ceptable level of operation, even in the face of anomalies such as malicious attacks, operational overload, configuration problems or equipment failures [1].
Resilience strategies can be defined in terms of the con-figuration of mechanisms for detection and remediation. On the one hand, detection mechanisms such as link monitors, anomaly detection systems and traffic classifiers allow the identification and characterization of network conditions. On the other hand,remediationmechanisms such as traffic limiters are used in the subsequent mitigation of undesirable char-acteristics in the network. Resilience management requires the configuration of these mechanisms to be dynamically refined when new information about the network becomes available in response to, for example, high resource utilization, performance degradation or application specific alarms.
In particular, traffic classification corresponds to a set of techniques and algorithms that aim to categorize network
traffic. These techniques can be broken down into several domains, including Internet application protocol classification (i.e., classifying transport flows according to their correspond-ing application layer protocol), packet classification (i.e., cate-gorizing packets into transport flows), and traffic classification for anomaly detection (i.e., separating malicious and non-malicious flows). According to the result of the classification, traffic belonging to a given class can be treated differently. Due to the variety of applications, protocols and traffic profiles involved, an approach that can adapt and learn from past experiences is desirable. With this in mind,machine learning techniques show a promising trend in this field [2].
As part of an integrated framework [3] for network re-silience, PReSET [4] was designed in order to allow theoff-line evaluation of resilience strategies, through a simulation envi-ronment. It allows network operators to analyze and identify optimal configurations to combat different types of attacks and other anomalies. PReSET (Policy-driven Resilience Strategy
EvaluationToolset) comprises a series of network components
implementing resilience functions and services, integrated into a policy-based management (PBM) framework. PBM [5] can be used to control the operation of these mechanisms, and to specify how they should be reconfigured dynamically as information about the state of the network is obtained.
Anomaly classification so far has been missing within the overall PReSET framework. In this paper, we extend PReSET to allow the evaluation of anomaly traffic classifi-cation techniques based on machine learning. Our primary contribution is to offer to network operators and administrators a toolset for the simulation and analysis of a variety of anomaly classification algorithms, thus allowing the easy identification of the best configuration parameters and network policies, when different types of attacks and anomalies are simulated. Furthermore, policies written in the Ponder2 [6] language can then be used to enable/disable classification modules, or replace the algorithm being used, depending on the quality of the monitored results in PReSET. As a result, network operators can be more confident when deploying the actual mechanisms and configuration policies in the physical network. We focus on two algorithms that have been widely used for the classification of network traffic [2]: K-means and Na¨ıve Bayes, which are used to categorize malicious and benign network traffic behavior. Our results show that PReSET can be used to
evaluate anomaly traffic classification techniques in terms of standard performance metrics.
This paper is organized as follows: Section II presents an overview of PReSET. Section III outlines the problem of traffic classification, as well as K-means and Na¨ıve Bayes. Section IV describes our implementation and evaluation results. Section V outlines the related work, and Section VI concludes the paper.
II. PRESET: A NETWORKRESILIENCESIMULATOR
PReSET [4] has been developed to allow the simulation of policy-based resilience strategies. It is based on the integration of the OMNeT++ network simulator [7] and the Ponder2 policy framework [6]. PReSET supports the simulation of network attacks and anomalies, and the evaluation of the corresponding resilience strategies. Ponder2 policies can be used to orchestrate the behavior of resilience mechanisms, e.g., components for intrusion detection and rate limiting, which are implemented as OMNeT++ modules. PReSET enables the design of optimal resilience strategies, and the identification of configuration parameters and policies, which can then be easily ported to physical devices.
Events generated by resilience mechanisms running within OMNeT++ are sent to the policy framework using a socket connection. These events indicate conditions observed, such as the detection of an attack. An event can trigger one or
more event-condition-action (ECA) policies, and the actions
specified by a policy will determine which resilience mecha-nism, running in the simulation, should be reconfigured and how. For this, OMNeT++ modules are instrumented with an XML-RPC server, which registers and exports a management interface for each resilience mechanism available. Ponder2 can then use these interfaces to invoke management actions to adapt the operation of simulated components, for example, to adjust the parameters of a traffic classification algorithm. The measurement capabilities of the simulator allow the prompt evaluation of management actions, for example, in terms of key performance indicators. A number of mechanisms have been implemented as OMNeT++ modules, including:LinkMonitor,
FlowExporter,RateLimiter andEntropyDetection[8].
III. NETWORKTRAFFICCLASSIFICATION
Traffic classification techniques are capable of identifying patterns in the sampled network traffic. Their purpose ranges from the identification of malicious traffic up to the catego-rization of Internet traffic for QoS support. However, with the increasing sophistication of applications, protocols and traffic profiles, strategies based on port numbers do not offer reliable classification. Further, strategies based on payload inspection can be very accurate if packets are not encrypted, but at a high processing cost [9]. An alternative is the use
of machine learning. Traffic classification based on machine
learning can be used as part of anomaly detection schemes, in order to separate flows into classes. In this paper we focus on binary anomaly classification, i.e., malicious and non-malicious classes. However, the same principles can be used to separate network traffic into different classes of anomalies. Next we describe the two algorithms used in this study: K-means and Na¨ıve Bayes. We chose these due to their simplicity and wide use in several investigations [2]. Note, PReSET is extensible and other algorithms can be used instead.
A. K-means
K-means is an unsupervised clustering algorithm in which data can be described by ngeneral features. The grouping of these features into a tuple of sizenrepresents a point in ann -dimensional space. Acentroid is determined from the average of themclosest points. Each centroid is represented asci for
i= 0, ..., k, wherekis the maximum number of centroids that
can be created during the clustering process. Each sample p has its centroid cp defined by the following equation:
cp=mink
i=0
q Pn
j=0(pj−(ci)j)2
When a point is associated with the nearest centroid, the centroid coordinates will be updated, which in turn will trigger the recalculation of the closest centroid for all samples. K-means is frequently used for traffic classification, and typically few features are needed to describe a flow in K-means [2].
After all centroids have been calculated, it is necessary to label the clusters, since K-means is only able to group similar data with respect to certain features. Although K-means can be used for Internet traffic classification in general (e.g., VoIP, P2P) [9], we focus on separating benign from malicious traffic because of the impact it has in network resilience.
B. Na¨ıve Bayes
Na¨ıve Bayes uses the theory ofconditional probability of a sample sbelonging to classt. It is calculated as:
P(t|s) = P(sP|t)(∗sP)(t)
Where P(t|s) is the conditional probability of class t given the occurrence of sample s, P(s|t) is the conditional probability of a sample sgiven the occurrence of classt, and P(t) and P(s) are the probabilities of occurrence of classt and sample s, respectively. Assuming a set of classes andsas a data sample, a bayesian classifier estimates the most likely
class CM L considering the si constituent features of sample
s, wherei= 0, ..., nin the following manner:
CM L=argmaxt∈TP(s1,s2,s3P,...,s(s)n|t)∗P(t)
Na¨ıve Bayes uses thena¨ıvehypothesis that the probability associated with each flow feature is independent from the others for a given classt. It is a supervised algorithm, which means it must be provided with a classification model called training set. The training set is a database where each entry has a sample value for a given flow feature and a class label. Our training set is based on the attack traces obtained from simulations in PReSET.
IV. IMPLEMENTATION ANDEXPERIMENTALRESULTS
K-means and Na¨ıve Bayes have been implemented and integrated in PReSET. We analyze two main aspects regarding the use of these algorithms: (a) which flow features are necessary for the classification; (b) what are the performance metrics of these algorithms. We chose these algorithms to illustrate how accurate flow classification can be observed with the proposed classifier in the PReSET toolset, rather than showing an exhaustive list of machine learning algorithms.
A. Prototype implementation and evaluation set-up
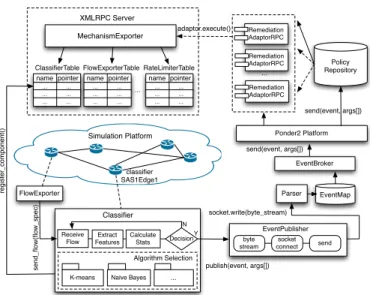
Figure 1 presents an overview of our Classifier
implementation and its integration within PReSET. The
Classifier module runs alongside other resilience com-ponents (e.g., FlowExporter) deployed in the simulated topology. It receives flow records periodically (customized via a policy) from the FlowExporter component. The
Classifierpre-processes the received flows, by extracting the relevant features (feature selection is discussed in Sec-tion IV-B) and calculating their statistics. The Classifier
is extensible and a range of anomaly classification algorithms can be used. Whenever a decision about a malicious flow is made, an event is published into Ponder2, and ECA policies will be used to decide how the network should be reconfigured (e.g., specify that packets belonging to the malicious flow must be dropped). To support the invocation of reconfiguration actions by policies, XMLRPC adaptors are used to interface with simulated components.
MechanismExporter Policy Repository name pointer ... ... ... ... ... ... name pointer ... ... ... ... ... ... ClassifierTable FlowExporterTable ... re g ist e r_ co mp o n e n t() byte stream socket connect send Ponder2 Platform Remediation AdaptorRPC Remediation AdaptorRPC Remediation AdaptorRPC ... EventBroker Simulation Platform EventMap Parser adaptor.execute() XMLRPC Server socket.write(byte_stream) send(event, args[]) send(event, args[]) FlowExporter EventPublisher classifier SAS1Edge1
K-means Naive Bayes ... Receive Flow Classifier publish(event, args[]) Extract Features Calculate Stats Decision Y N Algorithm Selection se n d _ flo w (fl o w _ sp e c) name pointer ... ... ... ... ... ... RateLimiterTable
Fig. 1. Overview of the Classifier implementation and PReSET integration
The scenario simulated was aDistributed Denial of Service (DDoS) attack, which is based on the set of programs Tribe
Flood Network [10]. The general characteristics of this
sim-ulation scenario are summarized in Table I. In this scenario, some parameters of the simulation were changed (such as start time of the attack), generating sub-scenarios of interest.
TABLE I. SIMULATION AND ATTACK TRAFFIC PARAMETERS
Parameter Value
simulation total time 160 s
attack start time 40 s
malicious packet size 64 bytes
port to attack 80
probability of attack 0.1
To simulate large-scale IP networks and attacks, PReSET relies on ReaSE [3], which permits the creation of realistic topologies and the generation of background and attack traffic. The simulation in our experiments included 912 hosts, 82 web servers and 188 routers. The traffic profile used in our experiments is described in Table II.
TABLE II. TRAFFIC PROFILE PARAMETERS
Parameter Value
type Web Traffic
request length 200 bytes
requests per session 10
reply length 1000 bytes
time between requests 2 s
time to respond 0.5 s
time between sessions 3 s
In total, 843 flows were observed, of which 32 were ma-licious. Malicious flows come from malicious hosts launching the DDoS attack. It is noteworthy that each flow is considered unidirectional. ● ● ● ● ● ● ●● ● ● ● ● ● ● ● ● ● ● ● ● ● ● ● ● ● ● ●● ● ● ● ● ● ● ● ● ● ● ● ●●●●●●●●●●●●●●●●●●●●●●●●●●●●●●●●●●●●●●●●●●●●●●●●●●●●●●●●●●●●●●●●●●●●●●●●●●●●●●●●●●●●●●●●●●●●●●●●●●●●●●●●●●●●●●●●●●●●●●●●●●●●●●●●●●●●●●●●●●●●●●●●●●●●●●●●●●●●●●●●●●●●●●●●●●●●●●●●●●●●●●●●●●●●●●●●●●●●●●●●●●●●●●●●●●●●●●●●●●●●● ● ● ● ● ● ●●●●●●●●●● ● ● ● ●●● ● ● ● ● ●●●●●●●● ● ● ● ● ● ● ● ● ● ● ● ● ●●●●●●●●●●●●●●●●●●●●●●●●●●●●●●●●●●●●●●●●●●●●●●●●●●●●●●●●●●●●●●●●●●●●●●●●●●●●●●●●●●●●●●●●●●●●●●●●●●●●●●●●●●●●●●●●●●●●●●●●●●●●●●●●●●●●●●●●●●●●●●●●●●●●●●●●●●●●●●●●●●●●●●●●●●●●●●●●●●●●●●●●●●●●●●●●●●●●●●●●●●●●●●●●●●●●●●●●●●●●●●●●●●●●●●●●●●●●●●●●●●●●●●●●●●●●●●●●●●●●●●●●●●●●●●●●●●●●●●●●●●●●●●●●●●●●●●●●●●●●●●●●●●●●●●●●●●●●●●●●●●●●●●●●●●●●●●●●●●●●●●●●●●●●●●●●●●●●●●●●●●●●●●●●●●●●●●●●●●●●●●●●●●●●●●●●●●●●●●●●●●●●●●●●●●●●●●●●●●●●●●●●●●●●●●●●●●●●●●●●●●●●●●●●●●●●●●●●●●●●●●●●●●●●●●●●●●●●●●●●●●●●●●●●●●●●●●●●●●●●●●●●●●●●●●●●●●●●●●●●●●●●●●●●●●●●●●●●●● 0 200 400 600 800 0 1000 2000 3000 flow pack et count
(a) Packet count per flow
● ● ● ● ● ● ● ● ● ● ● ● ● ● ● ● ●● ● ● ● ● ● ● ● ● ● ● ● ●● ● ● ● ● ● ● ● ● ● ● ● ●●● ● ● ● ● ●●●●●●●●●●●●●●●●●●●●●●●●●●●●●●●●●●●●●●●●●●●●●●●●●●●●●●●●●●●●●●●●● ● ●●● ● ● ● ● ●● ● ● ● ● ● ●●●●●●●●●●●●●●●●●●●●●●●●●●●●●●●●●●●●●●●●●●●●●●●●●●●●●●●●●●●●●●●●●●●●●●●●●●●●●●●●●●●●●●●●●●●●●●●● ● ● ● ●●●●●●●●● ● ● ● ● ● ●●●●●●●●●● ● ● ● ● ● ● ● ● ● ●●●●●● ● ●●●●●●● ●●●●●●● ● ● ● ● ● ● ●●●●● ● ● ●●●●●●●●●●●●●●●●●●●●●●●●●●●●●●●●●●●●●●●●●● ● ● ● ● ●●●●●●●● ● ● ● ● ● ●●●●●●●●●● ● ● ● ● ●●● ● ● ● ●●●●●●●●● ● ● ● ● ● ●●●●●●●●● ● ● ● ● ●●●●●●●●●●●●●●●●●●●●●●●●●●●●●●●●●●●●●●●●●●●●●●●●●●●●●●●●●●●●●●●●●●●●●●●●●●●● ● ● ● ●●●●●●●●●●●●●●●●●●●●●●●●●●●●●●●●●●●●●●●●●●●●●●●●●●●●●●●●●●●●●●●●●●●●●●●●●●●●●●●●●●●●●●●●●●●●●●●●●●●●●●●●●●●●●●●●●●●●●●●●●●● ● ● ● ● ●●●●●●●●●●●●●●●●●●●●●●●●●●●●●●●●●●●●●●●●●●●●●●●●●●●●●●●●●●●●●●●●●●●●●●●●●●●●●●●●●●●●●●●●●●●●●●●●●●●●●●●●●●●●●●●●●●●●●●●●●●●●●●●●●●●●●●●●●●●●●●●●●●●●●●●●●●●●●●●●●●●●●●●●●●●●●●●●●●●●●●●●●●●●●●● ● ●●●●●●●●●●●●●●●●●●●●● ● ● ● ● ● ● ●●●●●●●● ● ● ● ● ● ●●●● 0 200 400 600 800 0 40000 80000 flow b yte count
(b) Byte count per flow
● ● ● ● ● ● ●●●●●●●●●●●●●●●●●●●●●●●●●●●●● ● ● ● ● ● ● ● ● ● ● ● ●● ● ● ● ● ● ● ● ● ● ● ● ● ● ● ● ● ● ● ● ● ● ● ● ● ● ● ● ● ● ● ● ● ● ● ● ● ● ● ● ● ● ● ● ● ● ● ● ● ● ● ● ● ● ● ● ● ● ● ●● ● ● ● ● ● ● ● ● ● ● ● ● ● ● ● ● ● ● ● ● ● ● ● ● ● ● ● ● ● ● ● ● ● ● ● ● ● ● ● ● ● ● ● ● ● ● ● ● ● ● ● ● ● ● ● ● ● ● ● ● ● ● ● ● ● ● ● ● ● ● ● ●● ● ● ● ● ● ● ● ● ● ● ● ● ● ● ● ● ● ● ● ● ● ● ● ● ● ● ● ● ● ● ● ● ● ● ● ● ● ● ● ● ● ● ● ● ● ● ● ● ● ● ● ● ● ● ● ● ● ● ● ● ● ● ● ● ● ● ● ● ● ● ● ● ● ● ● ● ● ● ● ● ● ● ● ● ●● ● ● ● ● ● ● ● ● ● ● ● ●●● ● ● ● ● ● ● ● ● ● ● ●● ● ● ● ● ● ● ● ● ● ● ● ● ● ● ● ● ● ● ● ● ● ● ● ● ● ● ● ● ● ● ● ● ● ● ● ● ● ● ● ● ● ● ● ● ● ● ● ● ● ● ● ● ● ● ● ● ● ● ● ● ● ● ● ● ● ● ● ● ● ● ● ● ● ● ● ● ● ● ● ● ● ● ● ● ● ● ● ● ● ● ● ● ● ● ● ● ● ● ● ● ● ● ● ● ● ● ● ● ● ● ● ● ● ● ● ● ● ● ● ● ● ● ● ● ● ● ● ● ● ● ● ● ● ● ● ● ● ● ● ● ● ● ● ● ● ● ● ● ● ● ● ● ● ● ● ● ● ● ● ● ● ● ● ● ● ● ● ● ● ● ● ● ● ● ● ● ● ● ● ● ● ● ● ● ●● ● ● ● ● ● ● ● ● ● ● ● ● ● ● ● ● ● ● ● ● ● ● ● ● ● ● ● ● ● ● ● ● ● ● ● ● ● ● ● ● ● ● ● ● ● ● ● ● ● ● ● ● ● ● ● ● ● ● ● ● ● ● ● ● ● ● ● ● ● ● ● ●● ● ● ● ● ● ● ● ● ● ● ● ● ● ● ● ● ● ● ● ● ● ● ● ● ● ● ● ● ● ● ● ●●● ● ● ● ● ● ● ● ● ● ● ● ● ● ● ● ● ● ● ● ● ● ● ● ● ● ● ● ● ● ● ● ●● ● ● ● ● ● ● ● ● ● ● ● ● ● ● ● ● ● ● ● ● ● ● ● ● ● ● ● ● ● ● ● ● ● ● ● ● ● ●● ● ● ● ● ● ● ● ● ● ● ● ● ● ● ● ● ● ● ● ● ● ● ● ● ● ● ● ● ● ● ● ● ● ● ● ● ● ● ● ● ● ● ● ● ● ● ● ● ● ● ● ● ● ● ● ● ● ● ● ● ● ● ● ● ● ● ● ● ● ● ● ● ● ● ● ● ● ● ● ● ● ● ● ● ● ● ● ● ● ● ● ● ● ● ● ● ● ● ● ● ● ● ● ● ● ● ● ● ● ● ● ● ● ● ● ● ● ● ● ● ● ● ● ● ● ● ● ● ● ● ● ● ● ● ● ● ● ● ● ● ● ● ● ● ● ● ● ● ● ● ● ● ● ● ● ● ● ● ● ● ● ● ● ● ● ● ● ● ● ● ● ● ● ● ● ● ● ● ● ● ● ● ● ● ● 0 200 400 600 800 80 100 120 140 flow flo w dur ation
(c) Flow duration per flow
● ● ● ●●●●●●●●●●●●●●●●●●●●●●●●●●●●●●●● ● ● ● ● ● ● ● ● ● ● ● ● ● ● ●● ● ● ● ● ● ● ● ● ● ● ● ● ● ● ● ● ● ● ● ● ● ● ● ● ● ● ● ● ● ● ● ● ● ● ● ● ● ● ● ● ● ● ● ● ● ● ● ● ● ● ● ● ● ● ● ● ● ● ● ● ● ● ● ● ● ● ● ● ● ● ● ● ● ● ● ● ● ● ● ● ● ● ● ● ●● ● ● ● ● ● ● ● ● ● ● ● ● ● ● ● ● ● ● ● ● ● ● ● ● ● ●● ● ● ● ● ● ● ● ● ● ● ● ● ● ● ● ● ● ● ● ● ● ● ● ● ● ● ● ● ● ● ● ● ● ● ● ● ● ● ● ● ● ● ● ● ● ● ● ● ● ● ● ●●● ● ● ● ● ● ● ● ● ● ● ● ● ● ● ● ● ● ● ● ● ● ● ● ● ● ● ● ● ● ● ● ● ● ● ● ● ● ● ● ● ● ● ● ● ● ● ● ● ● ● ● ● ● ● ● ● ● ● ● ● ● ● ● ● ● ● ● ● ● ● ● ● ● ● ● ● ● ● ● ● ● ● ● ● ● ● ● ● ● ● ● ● ● ● ● ● ● ● ● ● ● ● ● ● ● ● ● ● ● ● ● ● ● ● ● ● ● ● ● ● ● ● ● ● ● ● ● ● ● ● ● ● ● ● ● ● ●● ● ● ● ● ● ● ● ● ● ● ● ● ● ● ● ● ● ● ● ● ● ● ● ● ● ● ● ● ● ● ● ● ●● ● ● ● ● ● ● ● ● ● ● ● ● ● ● ● ● ● ● ● ● ● ● ● ● ● ● ● ● ● ● ● ● ● ● ● ● ● ● ● ● ● ● ● ● ● ● ● ● ● ● ● ●● ● ● ● ● ● ● ● ● ● ● ● ● ● ● ● ● ● ● ● ● ● ● ● ● ● ● ● ● ● ● ● ● ● ● ● ● ● ●● ● ● ● ● ● ●● ● ● ● ● ● ●● ● ● ● ● ● ● ● ● ● ● ● ● ● ● ● ● ● ● ●●●●●● ● ● ● ● ● ● ● ●●●●● ● ● ● ● ● ● ● ● ● ● ● ● ● ● ● ● ● ● ● ● ● ●● ● ● ● ● ● ● ● ● ● ● ● ● ● ● ● ● ● ● ● ● ● ● ● ● ● ● ● ● ● ● ● ● ● ● ● ● ● ● ● ● ● ● ● ● ● ● ● ● ● ● ● ● ● ● ● ● ● ● ● ● ● ● ● ● ● ● ● ● ● ● ● ● ● ● ● ● ● ● ● ● ● ● ● ● ● ● ● ● ● ● ● ● ● ● ● ● ● ● ● ● ● ● ● ● ● ● ● ● ● ● ● ●● ● ● ● ● ● ● ● ● ● ● ● ● ● ● ● ● ● ● ● ● ● ● ● ● ● ● ● ● ● ● ● ● ● ● ● ● ● ● ● ● ● ● ● ● ● ● ● ● ● ● ● ● ● ● ● ● ● ● ●● ● ● ● ● ● ● ● ● ● ● ● ● ● ● ● ● ● ● ● ● ● ● ● ● ● ● ● ● ● ● ● ● ● ● ● ● ● ● ● ● ● ● ● ● ● ● ● ● ● ● ● ● ● ● ● ● ● ● ● ● ● ● ● ● ● ● ● ● ● ● ● ● ● ● ● ● ● ● ● ● ● ● ● ● ● ● ● ● ● ● ● ● ● ● ● ● ● ● ●● ● ● ● ● ● ● ● ● ● ● ● ● ● ● ● 0 200 400 600 800 40 80 120 160 flow mean inter−arr iv al−time
(d) Mean inter-arrival-time per flow
Fig. 2. All features distribution
B. Preliminary analysis and feature selection
Each flow is represented by the 5-tuple hdestination IP,
source IP, destination port, source port, protocoli. During
the simulation, the following four traffic features (which are widely used in the literature [2]) were collected for each flow:packet count,byte count,flow durationandmean packet
inter-arrival-time. Although feature selection is typically a
challenging issue, it is still possible to find a set of relevant features by inspection. Based on the data collected from the simulator, a two-dimensional plot on each feature was produced, and the distribution of data was observed. These results can be seen in Figure 2, which shows all flows with their respective feature values. Observing the distributions, the
packet count and byte count features seem to more clearly
distinguish different flow samples. In order to validate the classification given by the learning algorithms in this paper, all the malicious flows were manually identified. This was possible due to the ease of customization offered by PReSET. This manual classification could then be used to benchmark the performance of the algorithms analyzed in the next sections. C. K-means analysis
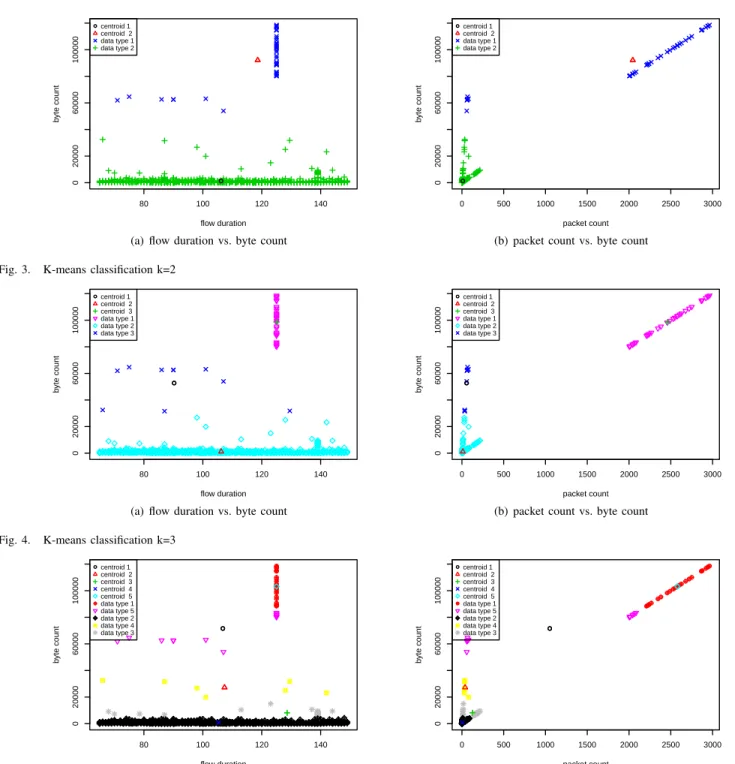
The K-means implementation for the Classifier was executed on all 843 flows involved in the PReSET simulation. The primary goal of this experiment was to identify malicious flows, by separating them in a specific centroid. In a first analysis, we used K-means configured with two centroids
● 80 100 120 140 0 20000 60000 100000 flow duration b yte count ●centroid 1 centroid 2 data type 1 data type 2 ●
(a) flow duration vs. byte count
● 0 500 1000 1500 2000 2500 3000 0 20000 60000 100000 packet count b yte count ●centroid 1 centroid 2 data type 1 data type 2 ●
(b) packet count vs. byte count
Fig. 3. K-means classification k=2
● 80 100 120 140 0 20000 60000 100000 flow duration b yte count ●centroid 1 centroid 2 centroid 3 data type 1 data type 2 data type 3 ●
(a) flow duration vs. byte count
● 0 500 1000 1500 2000 2500 3000 0 20000 60000 100000 packet count b yte count ●centroid 1 centroid 2 centroid 3 data type 1 data type 2 data type 3 ●
(b) packet count vs. byte count
Fig. 4. K-means classification k=3
● 80 100 120 140 0 20000 60000 100000 flow duration b yte count ● ● ● ● ● ● ● ● ● ● ● ● ● ● ● ● ● ● ● ● ● ● ● ● ● ● ● ● centroid 1 centroid 2 centroid 3 centroid 4 centroid 5 data type 1 data type 5 data type 2 data type 4 data type 3 ●
(a) flow duration vs. byte count
● 0 500 1000 1500 2000 2500 3000 0 20000 60000 100000 packet count b yte count ●● ● ● ● ● ● ● ● ● ● ●● ● ● ● ● ● ● ● ● ●● ● ● ● ● ● centroid 1 centroid 2 centroid 3 centroid 4 centroid 5 data type 1 data type 5 data type 2 data type 4 data type 3 ●
(b) packet count vs. byte count
Fig. 5. K-means classification k=5
(k= 2). The result of this clustering is illustrated in Figure 3. In total, all flow features defined in Section IV-B were used and all possible 2 by 2 combinations for plotting the data were considered. However, due to space limitations, Figure 3 presents only the cases in which a better separation of clusters was observed. In particular, we confirmed that byte countand
packet count were good discriminators for the type of flow.
By using manual flow labeling we benchmarked the results in Figure 3. We noted that the K-means algorithm clustered some of the benign flows in centroid 1, and all the malicious flows in centroid 2. However, it also wrongly assigned a few benign
flows to centroid 2.
The use of K-means with a larger number of centroids enables an increase in the degree of clustering, thereby allow-ing more homogeneous centroids. For 3 centroids (k = 3), flows that were previously misclassified now belong to a specific centroid. The final clustering in this case is shown in Figure 4, demonstrating that the isolation of the centroids representing malicious flows is achieved (in centroid 3, data type 1). Since K-means groups flows using feature information, the centroids generated should represent flows that share a similar profile.
TPR SPC p NPV FPR FDR ACC F1−score metric percentage 0 10 20 30 40 50 60 70 80 90 100 100 99.7 94.1 100 0.2 5.8 99.7 96.9
Fig. 6. Classification performance metrics for K-means with 3 centroids
For the execution of K-means with three centroids, Fig-ure 6 summarizes our results with respect to the standard
performance metrics for classification algorithms [11]. The
performance metrics commonly used are true positive rate (TPR), specificity (SPC), precision (p), negative predictive value (NPV), false positive rate (FPR), false discovery rate (FDR), accuracy (ACC) and F1-score. False positive flows are those that should have been marked as benign, but were marked as malicious. In contrast, false negatives are flows that should have been classified as malicious, but were marked as benign. According to Figure 6, 0.2% of the flows were misclassified (FDR) using the K-means implementation.
However, the use of K-means poses some difficulties. The first issue is to determine the optimal number of centroids. Although it is feasible to choose the number of centroids using standard mathematical methods (information criterion or the Elbow method), it is still common to select the optimal number based on manual inspection. To illustrate this, we extended our analysis. Figure 5 shows the result when we run K-means with five centroids (k= 5). Notice that new traffic classes arise even within the centroid representing only the group of malicious flows, which is due to overfitting. Also, there is an issue in defining the optimal set of features to use, and in our case this decision was made by analyzing the results through manual inspection of the plots. Finally, K-means requires an oracle to provide the labeling and the nature of a centroid; this is because at the end of a run all centroids are determined, but the information they represent is not known.
D. Na¨ıve Bayes analysis
Na¨ıve Bayes has been implemented as a complementary approach to the classification provided by K-means, mainly to assist in the labeling of the centroids produced. A training set containing samples of malicious traffic manually classified and other general samples was used. This training set consisted of 562 flows, divided into malicious and non-malicious samples. During the test phase, all 843 flows were used.
The algorithm calculates the conditional probability of a given flow being malicious or not using the training set. Given a flowf with a feature valuev, an interval thresholdt(defined a priori) is used such that all entries that are within the interval [v −t, v +t] are considered candidates for labeling f. These entries are separated in malicious and non-malicious
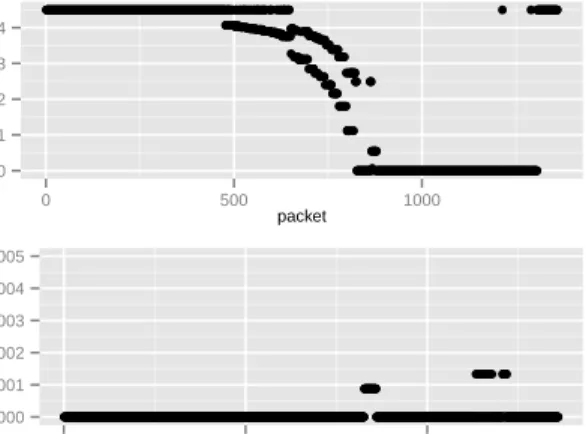
and used to calculate the most likely class for f using the conditional probability for every feature. The results of this classification can be seen in Figure 7 where each flow has a likelihood of being malicious and non-malicious. Notice that every flow has two probabilities calculated: malicious and non-malicious probability1. Subsequently to the calculation of the
class probabilities, the Na¨ıve Bayes algorithm chooses the most probable class for a flow and outputs this class. When the training set is unable to provide sufficient information for the classification, a zero probability is returned and in case of tied probabilities, none of the classes is returned and the PReSET classifier module assumes that the flow is non-malicious.
●●●●●●●●●●●●●●●●●●●●●●●●●●●●●●●●●●●●●●●●●●●●●●●●●●●●●●●●●●●●●●●●●●●●●●●●●●●●●●●●●●●●●●●●●●●●●●●●●●●●●●●●●●●●●●●●●●●●●●●●●●●●●●●●●●●●●●●●●●●●●●●●●●●●●●●●●●●●●●●●●●●●●●●●●●●●●●●●●●●●●●●●●●●●●●●●●●●●●●●●●●●●●●●●●●●●●●●●●●●●●●●●●●●●●●●●●●●●●●●●●●●●●●●●●●●●●●●●●●●●●●●●●●●●●●●●●●●●●●●●●●●●●●●●●●●●●●●●●●●●●●●●●●●●●●●●●●●●●●●●●●●●●●●●●●●●●●●●●●●●●●●●●●●●●●●●●●●●●●●●●●●●●●●●●●●●●●●●●●●●●●●●●●●●●●●●●●●●●●●●●●●●●●●●●●●●●●●●●●●●●●●●●●●●●●●●●●●●●●●●●●●●●●●●●●●●●●●●●●●●●●●●●●●●●●●●●●●●● ● ● ●●●●●●●●●● ● ● ● ● ● ● ●● ● ● ● ●●●● ● ● ● ● ● ● ● ●●● ● ● ● ● ● ● ● ● ●● ● ● ● ●● ● ● ● ● ● ● ● ● ● ● ● ● ● ● ● ● ● ● ● ●● ● ● ● ● ● ● ● ● ● ●●●●● ●● ● ● ● ●●● ● ● ● ●● ● ● ● ●● ● ● ● ●●●●●●●●●● ● ●● ● ● ● ●●●●●●●●●●●● ● ● ● ● ●● ● ● ● ● ●● ● ● ● ●● ● ● ● ●● ● ● ● ● ●● ● ● ● ●●● ● ● ●● ● ● ● ● ●●●● ● ●● ● ● ● ● ● ● ● ● ● ●●●●● ● ● ● ● ● ●●● ● ● ● ●●● ● ● ●● ● ● ● ● ● ● ● ● ●● ● ● ● ● ●●●● ● ● ● ● ● ● ●● ● ● ● ● ●●●● ● ● ● ● ● ● ●●●● ● ● ●● ● ● ● ●●●●● ●●● ● ● ● ●●● ● ● ●● ● ● ● ●●●● ● ● ●●● ● ● ●● ● ● ● ●●● ● ● ● ●●● ● ● ● ● ● ● ● ●● ● ● ● ● ●● ● ● ● ●●●●●●● ● ● ● ● ●● ● ● ● ● ● ● ● ● ●●●●●●●●●●●●●●●●●●●●●●●●●●●●●●● ● ● ● ● ● ● ● ● ● ● ● ● ●●●●●● ● ● ● ● ●●●●●●●●●●●●●●●●●●●●●●●●●●●●●●●●●●●●●●●●●●●●●●●●●●●●●●●●●●●●●●●●●●●●●●●●●●●●●●●●●●●●●●●●●●●●●●●●●●●●●●●●●●●●●●●●●●●●●●●●●●●●●●●●●●●●●●●●●●●●●●●●●●●●●●●●●●●●●●●●●●●●●●●●●●●●●●●●●●●●●●●●●●●●●●●●●●●●●●●●●●●●●●●●●●●●●●●●●●●●●●●●●●●●●●●●●●●●●●●●●●●●●●●●●●●●●●●●●●●●●●●●●●●●●●●●●●●●●●●●●●●●●●●●●●●●●●●●●●●●●●●●●●●●●●●●●●●●●●●●●●●●●●●●●● ● ● ● ● ● ●●●●●●●●●●●●●●●●●●●●●●●●●●●●●●●●●●●●●●●●●●●●●●●●●●●●●●●●●●●●●●●●●●●●●●● ● ● ● ● ●●●●●●●●●●●●● ● ● ● ●●●●●●●●●●●●●●●●●●●●●●●●●●●●●●●●●●●●●●●●●●●●●●●●●●● 0.0 0.1 0.2 0.3 0.4 0 500 1000 packet benign probability ● ●●●●●●●●●●●●●●●●●●●●●●●●●●●●●●●●●●●●●●●●●●●●●●●●●●●●●●●●●●●●●●●●●●●●●●●●●●●●●●●●●●●●●●●●●●●●●●●●●●●●●●●●●●●●●●●●●●●●●●●●●●●●●●●●●●●●●●●●●●●●●●●●●●●●●●●●●●●●●●●●●●●●●●●●●●●●●●●●●●●●●●●●●●●●●●●●●●●●●●●●●●●●●●●●●●●●●●●●●●●●●●●●●●●●●●●●●●●●●●●●●●●●●●●●●●●●●●●●●●●●●●●●●●●●●●●●●●●●●●●●●●●●●●●●●●●●●●●●●●●●●●●●●●●●●●●●●●●●●●●●●●●●●●●●●●●●●●●●●●●●●●●●●●●●●●●●●●●●●●●●●●●●●●●●●●●●●●●●●●●●●●●●●●●●●●●●●●●●●●●●●●●●●●●●●●●●●●●●●●●●●●●●●●●●●●●●●●●●●●●●●●●●●●●●●●●●●●●●●●●●●●●●●●●●●●●●●●●●●●●●●●●●●●●●●●●●●●●●●●●●●●●●●●●●●●●●●●●●●●●●●●●●●●●●●●●●●●●●●●●●●●●●●●●●●●●●●●●●●●●●●●●●●●●●●●●●●●●●●●●●●●●●●●●●●●●●●●●●●●●●●●●●●●●●●●●●●●●●●●●●●●●●●●●●●●●●●●●●●●●●●●●●●●●●●●●●●●●●●●●●●●●●●●●●●●●●●●●●●●●●●●●●●●●●●●●●●●●●●●●●●●●●●●●●●●●●●●●●●●●●●●●●●●●●●●●●●●●●●●●●●●●●●●●●●●●●●●●●●●●●●●●●●●●●●●●●●●●●●●●●●●●●●●●●●●●●●●●●●●●●●●●●●●●●●●●●●●●●●●●●●●●●● ●●●●●●●●●●●●●●●●●●●●●●●●●●●●●●●●● ●●●●●●●●●●●●●●●●●●●●●●●●●●●●●●●●●●●●●●●●●●●●●●●●●●●●●●●●●●●●●●●●●●●●●●●●●●●●●●●●●●●●●●●●●●●●●●●●●●●●●●●●●●●●●●●●●●●●●●●●●●●●●●●●●●●●●●●●●●●●●●●●●●●●●●●●●●●●●●●●●●●●●●●●●●●●●●●●●●●●●●●●●●●●●●●●●●●●●●●●●●●●●●●●●●●●●●●●●●●●●●●●●●●●●●●●●●●●●●●●●●●●●●●●●●●●●●●●●●●●●●●●●●●●●●●●●● ● ●●●● ● ● ●●●●●●●●● ● ● ●● ● ● ● ● ● ● ● ● ● ● ● ● ● ● ● ● ● ● ● ● ●●●● ● ●●●●●●●●●●●●●●●●●●●●●●●●●●●● ● ● ● ● ● ●● ● ● ● ● ● ● ● ● ● ●●●●●●●●●●●●●●●●●●●●●●●●●●●●●●●●●●●●●●●●●●●●●●●●●●●●●●●●●●●●●●●●●●●●●●●●●●●●●●●●●●●●●●●●●●●●●●●●●●●●●●●●●●●●●●●●●●●●●●●●●●●●●●●●●●●●●●●●●● 0.000 0.001 0.002 0.003 0.004 0.005 0 500 1000 packet malicious probability
Fig. 7. Classification of Na¨ıve Bayes for probability involved
Figure 8 summarizes the standard classification perfor-mance metrics for the Na¨ıve Bayes algorithm. According to Moore and Zuev [12], a precision of about 60% is expected for an implementation of Na¨ıve Bayes without advanced tech-niques, such askernel estimation. In our results, we observed a precision of 59.2%, and also a low FPR of only 1.58%.
TPR SPC p NPV FPR FDR ACC F1−score metric percentage 0 10 20 30 40 50 60 70 80 90 100 100 96.1 59.2 100 1.58 40.7 98.4 74.4
Fig. 8. Classification performance metrics for the Naive Bayes algorithm
E. Discussion
New flows could be captured by K-means and assigned to a centroid. In this case, it would be enough for the Na¨ıve Bayes algorithm to classify at least one flow within the centroid
1Na¨ıve Bayes can be used to classify flows. However, it also provides
classification of individual packets. In this case, a flow is considered malicious when the number of packets classified as malicious exceeds a certain limit.
to identify all other remaining flows in this cluster. Samples that could not be classified by Na¨ıve Bayes could be clus-tered by K-means and thereby have their class inferred from other flows within the same cluster. Given the complementary characteristics of K-means and Na¨ıve Bayes, their joint use seems to be a viable option. As part of our future work, we will investigate how PReSET can be used to combine different classification techniques. A key feature of PReSET is that it allows the use of policies written in Ponder2 to dynamically reconfigure resilience mechanisms in response to monitored events in the simulation. Future work will also investigate how the algorithms analyzed in this paper can be reconfigured through policies [8] (e.g., dynamically altering the parameters of the algorithms or recorded traffic features, according to the performance of the classifier). Furthermore, more complete resilience strategies will be evaluated, by having policies to block or limit malicious traffic that is identified.
V. RELATED WORK
Gamer and Mayer [13] describe the use of OMNeT++ to evaluate the detection of large-scale network attacks, such as DDoS and worm propagations. In particular, OMNeT++ has been integrated with Distack [14], a framework for evaluating detection mechanisms. These mechanisms are based on a combination of shared libraries for basic functions, such as packet inspection, filtering, and sampling. PReSET itself uses some of the functionality provided by Distack. Further, Lam et al. [15] present techniques for the evaluation of resilience strategies against a variety of attacks also in OMNeT++. The authors demonstrate metrics to assign scores, which identify the parameters that influence the performance of resilience strategies. While these investigations have similarities with the theme of our paper (evaluation of resilience strategies in simulation environments), our work differs in the sense that it focuses specifically on the evaluation of traffic classification mechanisms. The contributions presented in this paper not only complement the work in [13], [14] and [15], but also extend PReSET with the ability to allow the development and evaluation of strategies for anomaly traffic classification.
VI. CONCLUSIONS
Traffic classification is an important component in strate-gies used to ensure network resilience against, for example, malicious attacks. Classification allows categorizing the net-work traffic in a number of classes. Further, as result of the classification, traffic belonging to a particular class can be treated differently (e.g., dropped or rate limited). In this paper, two algorithms for anomaly traffic classification based on
machine learningwere implemented and analyzed in PReSET.
Our main goal with this paper is to offer to network opera-tors a toolset for the simulation and analysis of anomaly traffic classification algorithms, thus allowing the easy identification of the best algorithms, configuration parameters and network policies, when different types of attacks and anomalies are simulated. The toolset supports the analysis and comparison of classification techniques. By using characteristics observed in the simulation, for example, the required sampling rate, the computational cost, the classification accuracy and the percentage of false positives, PReSET permits the execution of reconfiguration mechanisms. As future work, we will evaluate
policies written in Ponder2 to enable/reconfigure classification modules, depending on the quality of the results. We also plan to extend PReSET with alternative classification algorithms, including Support Vector Machine (SVM) and AutoClass [2]. This will permit a more systematic and comprehensive com-parison of classification techniques.
REFERENCES
[1] J. P. G. Sterbenz, D. Hutchison, E. K. C¸ etinkaya, A. Jabbar, J. P.
Rohrer, M. Sch¨oller, and P. Smith, “Resilience and survivability in communication networks: Strategies, principles, and survey of
disciplines,”Comput. Netw., vol. 54, no. 8, pp. 1245–1265, Jun. 2010.
[Online]. Available: http://dx.doi.org/10.1016/j.comnet.2010.03.005
[2] T. Nguyen and G. Armitage, “A Survey of Techniques for Internet
Traffic Classification using Machine Learning,”IEEE Communications
Surveys & Tutorials, vol. 10, no. 4, pp. 56–76, 2008. [Online]. Available: http://dx.doi.org/10.1109/SURV.2008.080406
[3] A. Schaeffer-Filho, P. Smith, A. Mauthe, D. Hutchison, Y. Yu, and
M. Fry, “A framework for the design and evaluation of network
resilience management,” inNetwork Operations and Management
Sym-posium (NOMS), 2012 IEEE, 2012, pp. 401–408.
[4] A. Schaeffer-Filho, A. Mauthe, D. Hutchison, P. Smith, Y. Yu, and
M. Fry, “PReSET: A toolset for the evaluation of network resilience
strategies,” in Integrated Network Management (IM 2013), 2013
IFIP/IEEE International Symposium on, 2013, pp. 202–209.
[5] W. Han and C. Lei, “A survey on policy languages
in network and security management,” Computer Networks,
vol. 56, no. 1, pp. 477 – 489, 2012. [Online]. Available:
http://www.sciencedirect.com/science/article/pii/S1389128611003562
[6] K. Twidle, E. Lupu, N. Dulay, and M. Sloman, “Ponder2 - a policy
environment for autonomous pervasive systems,” inPOLICY ’08: IEEE
Workshop on Policies for Distributed Systems and Networks. Palisades, NY, USA: IEEE Computer Society, 2008, pp. 245–246.
[7] A. Varga and R. Hornig, “An overview of the OMNeT++ simulation
environment,” inSIMUTools ’08: Proceedings of the 1stInternational
Conference on Simulation Tools and Techniques. Marseille, France: ICST, 2008, pp. 1–10.
[8] Y. Yu, M. Fry, A. Schaeffer-Filho, P. Smith, and D. Hutchison, “An
adaptive approach to network resilience: Evolving challenge
detec-tion and mitigadetec-tion,” inDesign of Reliable Communication Networks
(DRCN), 2011 8th International Workshop on the, 2011, pp. 172–179.
[9] J. Erman, M. Arlitt, and A. Mahanti, “Traffic classification using
clustering algorithms,” in Proceedings of the 2006 SIGCOMM
workshop on Mining network data, ser. MineNet ’06. New York, NY, USA: ACM, 2006, pp. 281–286. [Online]. Available: http://doi.acm.org/10.1145/1162678.1162679
[10] C. Douligeris and A. Mitrokotsa, “DDoS attacks and defense
mechanisms: Classification and state-of-the-art,” Comput. Netw.,
vol. 44, no. 5, pp. 643–666, Apr. 2004. [Online]. Available: http://dx.doi.org/10.1016/j.comnet.2003.10.003
[11] E. Alpaydin,Introduction to Machine Learning (Adaptive Computation
and Machine Learning). The MIT Press, 2004.
[12] A. W. Moore and D. Zuev, “Internet traffic classification using
bayesian analysis techniques,” SIGMETRICS Perform. Eval. Rev.,
vol. 33, no. 1, pp. 50–60, Jun. 2005. [Online]. Available:
http://doi.acm.org/10.1145/1071690.1064220
[13] T. Gamer and C. P. Mayer, “Large-scale evaluation of distributed attack
detection,” in Simutools ’09: Proceedings of the 2nd International
Conference on Simulation Tools and Techniques. ICST, Brussels, Belgium, Belgium: ICST (Institute for Computer Sciences, Social-Informatics and Telecommunications Engineering), 2009, pp. 1–8.
[14] T. Gamer, C. P. Mayer, and M. Zitterbart, “Distack – a framework
for anomaly-based large-scale attack detection,” inSECURWARE ’08:
Proceedings of the 2008 Second International Conference on Emerging Security Information, Systems and Technologies. Washington, DC, USA: IEEE Computer Society, 2008, pp. 34–40.
[15] D. Lam, E. Skiles, and P. Grisham, “Simulation tool for evaluation and
design of resilience strategies,” inResilient Control Systems (ISRCS),