Studies have linked epigenetics to an increasing number of diseases, and the need for epigenetics analyses are expected to keep growing in a variety of research areas. Takara Bio is in the process of assembling a lineup of products needed in epigenetics analyses. With a focus on regional DNA methylation analysis, this feature article provides an overview of techniques that may serve as a useful reference for those who plan to carry out epigenetics analyses.
[1] What is Epigenetics?
Epigenetics is a term used to refer to the mechanism of
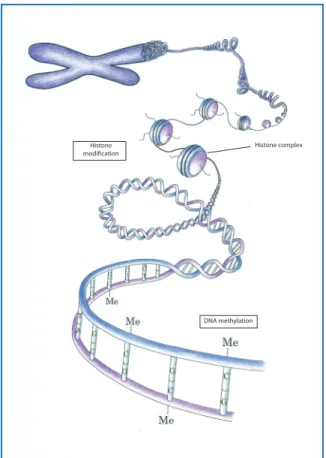
regulating gene expression by an acquired modification and the maintenance of that modification without any changes in DNA sequence. DNA methylation and histone chemical modification, among other things, are involved in this mechanism (Figure 1). DNA methylation plays a role in suppressing gene expression, whereas histone chemical modification is involved in activation or suppression of gene expression through such things as transcription regulation or chromatin structural change.
Histone
modification Histone complex
DNA methylation
Figure 1. Epigenetic Modifications.
DNA Methylation and CpG Island
Cytosines (C) undergo methylation in CpG dinucleotides in animal genomic DNA and in CpG and CpNpG sequences in plants. CpG sequences are present sporadically in many genomic regions, but they occur at a high frequency in regions called CpG islands. These islands tend to overlap with gene regulatory regions and their length ranges from 500 to 2000 base pairs. In human and mouse genomes, about 70% of CpG dinucleotides outside of CpG islands have a methylated cytosine; however, cytosines within CpG islands of expressed genes are not methylated. Methylation of CpG islands generally leads to chromatin condensation and suppression of gene transcription. The primary focus of DNA methylation analysis is the methylation status of these CpG islands. [2] Work Flow of DNA Methylation Analyses
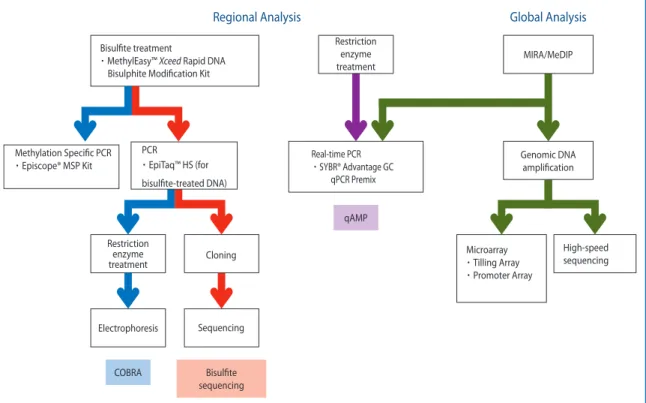
A host of techniques developed to assay DNA methylation are classified below. They each have their own distinct features; select a suitable technique that meets your experimental objectives (Figure 2 on next page).
Classification by experimental objective
1. Methylation analysis of a particular genomic DNA region Bisulfite sequencing, combined bisulfite restriction analysis (COBRA), and quantitative analysis of DNA methylation using real-time PCR (qAMP), etc.
2. Global methylation analysis of genome-wide DNA Methylated DNA immunoprecipitation (MeDIP) and microarray-based integrated analysis of methylation by isoschizomers (MIAMI), etc.
Classification by principle of DNA methylation detection 1. Base substitutions by bisulfite treatment
2. Digestion by methylation-sensitive restriction enzyme 3. Enrichment by anti-methylated cytosine antibody or
methylated DNA-binding protein Recommended analytical methods
1. Methylation analysis of a specific genomic DNA region Bisulfite sequencing is the most suitable technique for regional genomic DNA methylation analysis when the objective is to determine the methylation status of individual CpG sequences within the region being as-sayed. MSP (methylation specific PCR) is used to study the methylation status of any group of CpG sites within a CpG island. This method does not require cloning or use of methylation-sensitive restriction enzymes. COBRA (combined bisulfate restriction analysis), which requires no special analytical apparatuses, is superior in cost ef-fectiveness. It may also be used as a simple tool to assay methylation status, but COBRA can only be used to assay the CpG sequences of a restriction enzyme site.
Regional Analysis qAMP Restriction enzyme treatment Sequencing Bisulfite sequencing Cloning Real-time PCR SYBR® Advantage GC qPCR Premix COBRA Electrophoresis Restriction enzyme treatment Bisulfite treatment
MethylEasy™ Xceed Rapid DNA Bisulphite Modification Kit
Methylation Specific PCR Episcope® MSP Kit Microarray Tilling Array Promoter Array High-speed sequencing Genomic DNA amplification MIRA/MeDIP Global Analysis PCR EpiTaq™ HS (for bisulfite-treated DNA)
Figure 2. Work flow of DNA Methylation Analyses.
2. Global methylation analysis of genome-wide DNA Global DNA methylation analyses have been carried out using methylation-sensitive restriction enzyme treatment, typically by MIAMI, or a combination of microarray analysis and enrichment by anti-methylated cytosine antibody (MeDIP) or methylated DNA-binding protein (MIRA: methylated CpG island recovery assay). Next-generation sequencing has also been used in combination with these treatments in place of microarray analysis. Direct assay by high-speed sequencing of bisulfite-modified DNA is also available.
Although microarray analysis offers the advantage of superior cost effectiveness when there is a large number of samples to be assayed, it has drawbacks. The target region must be narrowed down just as in a promoter-array, or alternatively, multiple array plates must be used when high resolution analysis is required. High-speed sequencing, on the other hand, allows across-the-board high-resolution analysis. It also offers the advantages of reducing cross-hybridization and other sequence-dependent errors attributable to experimental technique, which are a concern with microarray analyses, and allowing direct acquisition of methylated bases. Nevertheless, every technique has its advantages and drawbacks; it is important to select a combination that meets the assay objectives.
[3] Regional Genomic DNA Methylation Analyses Preceded by Bisulfite Treatment
3-1 Bisulfite treatment
Bisulfite treatment converts unmethylated cytosines to uracils in DNA. Bisulfite, however, does not convert methylated cytosines (mC). This treatment, therefore, enables the differentiation of methylated cytosines from unmethylated cytosines. Unmethylated DNA and methylated DNA have different base sequences after bisulfite treatment, allowing DNA methylation analyses by means such as sequence analysis following PCR amplification or restriction enzyme digestion (Figure 3).
▀ MethylEasy™ Xceed Rapid DNA Bisulphite Modification Kit
Compared with the conventional methods, the MethylEasy™ Series* of products can provide a quicker and more accurate conversion of unmethylated cytosines. The enhanced MethylEasy™ Xceed Rapid DNA Bisulphite Modification Kit (Cat. #ME002) requires only 90 minutes of treatment and as little as 50 pg of genomic DNA. DNA degradation is minimized during treatment, resulting in 99% or greater conversion efficiency. Treated DNA may be easily recovered by use of a purification column.
Genomic DNA amplification When a CpG sequence is unmethylated
mCGmCGTCTATGmCGAGGCmCGG CGCGTCTATGCGAGGCCGG
↓ Bisulfite treatment ↓
mCGmCGTUTATGmCGAGGUmCGG UGUGTUTATGUGAGGUUGG
↓ PCR amplification ↓
CGCGTTTATGCGAGGTCGG
GCGCAAATACGCTCCAGCC ATGCATGTCATATATGATACTAGAGGCTCCTTAAGGCC Figure 3. Bisulfite Treatment and PCR Amplification
▀ Experimental Example 1: Cytosine Conversion Efficiency and Methylation Pattern Analysis [Method]
MethylEasy™ Xceed was used to treat genomic DNA (500 ng) prepared from HeLa cells with a FastPure® DNA Kit, yielding 20 µl of treated genomic DNA solution. A 500-ng sample of EpiScope® Methylated HeLa Genomic DNA (Cat. #3520), a HeLa genome with methylated CpG, was also treated with MethylEasy™ Xceed to serve as the control. A 1-µl aliquot of each treated genomic DNA was used as the template. Part of the CpG island region of CDH1, CDKN2A, and MLH1 were PCR amplified using TaKaRa Taq ™ Hot Start Version (Cat. #R007A) and then cloned. Sequence analyses were performed on 24 clones from each amplification reaction. CpG methylation results were analyzed using RIKEN’s QUMA (Quantification Tool for Methylation Analysis, http://quma.cdb.riken.jp/) analytical tool. Note: Takara Bio has developed a new
enzyme for this application: EpiTaq™ HS (for bisulfite-treated DNA) (Cat. #RR110A). This enzyme demonstrates superior amplification of bisulfite-treated DNA.
[Result]
Cytosines outside of CpG sequences generally are unmethylated. As a result, they are all converted to uracils following a bisulfite treatment. The sequence analyses showed a conversion efficiency of 99.6%, indicating that virtually all cytosines outside of CpG sequences were converted (Table 1).
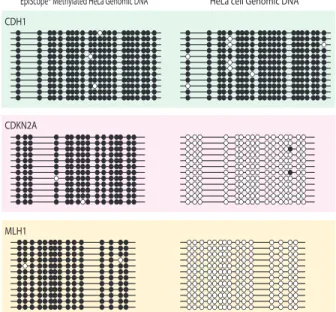
The results also indicated that the CpG islands of CDH1 are methylated in the HeLa cells used in this experiment and that the CpG islands of CDKN2A and MLH1 are unmethylated (Figure 4). Meanwhile, the CpG sequences of the control, EpiScope® Methylated HeLa Genomic DNA (methylated HeLa genome), were found to have almost all of its cytosines methylated at a 98.9% methylation rate.
Table 1. Rate of Cytosine Conversion by Bisulfite Treatment
EpiScope*1 HeLa*2 Total number of cytosines outside of
CpG sequences *3 1,800
Total number of above cytosines
converted to U *3 1,793 1,792
Conversion efficiency 99.61% 99.56%
*1 : EpiScope™ Methylated HeLa Genomic DNA (Cat. #3520) *2 : HeLa cell Genomic DNA
*3 : Total number in 12 clones each of CDH1, CDKN2A, and MLH1 used in the assay. Within the cloned region there are, respectively, 49, 47 and 54 cytosines located outside CpG sequences.
CDH1
CDKN2A
MLH1
EpiScope® Methylated HeLa Genomic DNA HeLa cell Genomic DNA
Based on the results of sequence analyses, methylation patterns were
determined using QUMA. (● : methylated CpG; ○ : unmethylated CpG)
Figure 4. Methylation Patterns.
Sample: HeLa cell genomic DNA 500 ng
EpiScope® Methylated HeLa Genomic DNA 500 ng
PCR amplification TaKaRa Taq™ Hot Start Version (Cat. #R007A)
Cloning: T-Vector pMD20, DNA Ligation Kit <Mighty Mix> (Cat. #6023)
E. coli HST08 Premium Competent Cells
Target gene/ amplification size:
CDH1 297 bp, CDKN2A 316 bp, MLH1 292 bp
PCR condition: (98°C 10 sec/ 55°C 30 sec/ 72°C 1 min) × 40 cycles
▀ Experimental Example 2: A Comparison with Other Companies’ Products
(1) PCR amplification [Method]
1-µg aliquots of genomic DNA prepared from HeLa cells with FastPure® DNA Kit underwent bisulfite treatment according to the protocol for each manufacturer’s product. PCR amplifications of part of the CpG island region of CDH1, CDKN2A and MLH1 were carried out using the treated genomic DNA solutions as the template.
[Result]
The PCR amplification pattern obtained from the
MethylEasy™ Xceed-treated genomic DNA solution was the same as those obtained from genomic DNA solutions treated with one of the other manufacturers’ kits. Amplifications
of approximately 600-bp and 900-bp regions were also seen when this kit was used to treat DNA but not when Companies B’s and C’s kits were used. These results suggest that MethylEasy™ Xceed-treated genomic DNA was not excessively fragmented, allowing recovery of longer DNA strands (Figure 5).
MethylEasy™ Xceed
M 1 2 3 4 5 6 7 8 9 M
M 1 2 3 4 5 6 7 8 9 M
M 1 2 3 4 5 6 7 8 9 M
M 1 2Company C’s Bisulfite Kit3 4 5 6 7 8 9 M
Company B’s Bisulfite Kit Company A’s Bisulfite Kit
Figure 5. A Comparison between This Kit and Other Manufacturers’ Kits (PCR Amplification).
Sample: HeLa cell genomic DNA 1µg
Bisulfite treatment
MethylEasy™ Xceed Rapid DNA Bisulphite Modification Kit (Cat. #ME002) and the bisulfite kits of Companies A, B, and C
* Company C’s kit yielded 60 µl of bisulfite-treated genomic DNA solution, and 3 µl (25-µl reaction system) of which was used as the template in PCR. Each of other kits yielded 20 µl of bisulfite-treated genomic DNA solution, and 1 µl (25-µl reaction system) of which was used as the template in PCR.
PCR amplification: TaKaRa Taq™ Hot Start Version (Cat. #R007A)
PCR condition: (98°C 10 sec/ 55°C 30 sec/ 72°C 1 min) × 40 cycles
Target gene/ amplification size
Lane: 1: CDH1 153 bp 6:MLH1 136 bp
2: CDH1 297 bp 7:MLH1 292 bp
3: CDKN2A144 bp 8:MLH1 607 bp
4: CDKN2A 316 bp 9:MLH1 877 bp
5: CDKN2A 655 bp
M: 100 bp DNA Ladder (Dye Plus) 5 µl
Used 2% Agrose L03, and applied 10 µl of PCR reaction mixture
(2) A comparison of the minimum quantity of genomic DNA required
[Method]
Genomic DNA in amounts of 500 ng, 50 ng, 5 ng, 500 pg, and 50 pg prepared from HeLa cells with FastPure® DNA Kit were given a bisulfite treatment according to the protocol of each kit, yielding 20 µl each of treated genomic DNA solutions. PCR amplifications were carried out on part of the CpG island region of CDH1 using 4-µl aliquots of each genomic DNA solution (amplification size: 153 bp and 297 bp).
[Result]
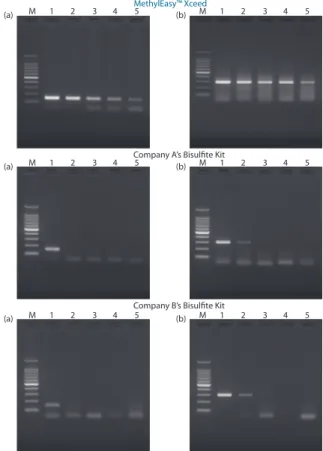
When using other manufacturers’ kits, no PCR amplification was detected with 5 ng or less of genomic DNA. In contrast, MethylEasy™ Xceed enabled detection of PCR amplification with as little as 50 pg of genomic DNA, demonstrating a potential to carry out bisulfite treatment without losing genomic DNA when assaying a very small amount of sample (Figure 6).
MethylEasy™ Xceed
Company A’s Bisulfite Kit
Company B’s Bisulfite Kit
M 1 2 3 4 5 M 1 2 3 4 5 M 1 2 3 4 5 M 1 2 3 4 5 M 1 2 3 4 5 M 1 2 3 4 5 (a) (a) (a) (b) (b) (b)
Figure 6. A Comparison between This Kit and Other Manufacturers’ Kits (Minimum Quantity of Genomic DNA Required).
Sample: HeLa cell genomic DNA
Bisulfite treatment
MethylEasy™ Xceed Rapid DNA Bisulphite Modification Kit (Cat. #ME002) and the bisulfite kits of Companies A and B
* Companies A’s and B’s kits yielded 20 µl of bisulfite-treated genomic DNA solution, and 1 µl (25-µl reaction system) of which was used as the template in PCR.
PCR amplification: TaKaRa Taq™ Hot Start Version (Cat. #R007A)
PCR condition: (98°C 10 sec/ 55°C 30 sec/ 72°C 1 min) × 40 cycles Amplification size: (a)CDH1 153 bp,(b)CDH1 297 bp
Lane: 1: 500 ng 4: 500 pg
2: 50 ng 5: 50 pg
3: 5 ng
M: 100 bp DNA Ladder (Dye Plus) 5 µl
3-2 Methylation specific PCR
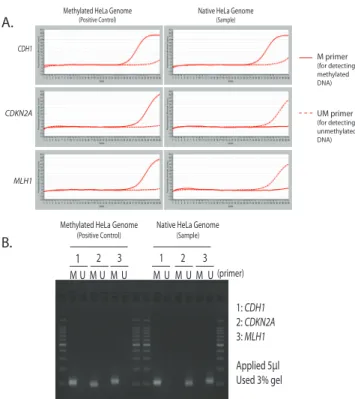
MSP requires two pairs of primers; one pair specific for methylated DNA (M) and the other for unmethylated DNA (U). To differeniate methylated and unmethylated DNA, one or more CpG sites are included in each primer sequence (or at least one of the pair). First, DNA is modified with sodium bisulfite and purified. Sodium bisulfite converts unmethylated cystosine bases to uracil; 5-methylcytosines are nonreactive. Then, two PCR reactions are performed using the M primer pair and U primer pair (Figure 7). Uracils are amplified as thymines and 5-mC residues are amplified as cystosines. The amplification products can be sequenced directly, cloned and then sequenced or put through high resolution melting (HRM) to provide methylation data.
▀ Experimental Example 3: Methylation Analysis by
MSP [Method]
MSP was performed using the Episcope® MSP Kit (Cat. #R100A) for the promoter region of each of the CDH1, CD-KN2A and MLH1 genes using bisulfite-treated genomic DNA templates. Positive Control: Methylated HeLa Genome (Cat. #3520); Sample: Native HeLa Genome (30 ng/25 µl reaction for each).
[Result]
Comparable results were obtained with real-time PCR (qMSP) and endpoint detection (MSP).
CDH1
CDKN2A
MLH1
Methylated HeLa Genome
(Positive Control) Native HeLa Genome(Sample)
M primer (for detecting methylated DNA) UM primer (for detecting unmethylated DNA)
Native HeLa Genome
(Sample)
Methylated HeLaGenome
(Positive Control) MUM M M MUM 1 2 3 1 2 3 (primer) 1: CDH1 2: CDKN2A 3: MLH1 Applied 5µl Used 3% gel U U U U A. B.
Figure 7. Bisulfite-treated genomic DNA was used in qMSP reactions (A) or in MSP using end-point detection (B). With the native HeLa genome, CDH1 CpG regions are methylated, but the CpG regions of CDKN2A and MLH1 are unmethylated.
3-3 Bisulfite sequence analysis
Following bisulfite treatment, PCR amplification of the region being assayed is carried out using a primer common for both methylated and unmethylated DNAs. The step is followed by cloning and sequence analysis. (For the study protocol, please refer to Experimental Example 1.)
▀ Tips for Bisulfite DNA Sequencing PCR enzyme
TaKaRa Taq ™ HS (Cat. #R007A) is recommended for PCR following bisulfite treatment. Please keep in mind that bisulfite treated DNA contains uracils and cannot be efficiently amplified with an α-type DNA polymerase. Sequence number
In order to obtain a correct analytical result, it is necessary to sequence a large number of clones. Even in a qualitative analysis, it is recommended to analyze a minimum of 24 clones.
CpG Island Search and Primer Design
The location and sequence of a CpG island may be checked using the UCSC Genome Browser.
http://genome.ucsc.edu/cgi-bin/hgGateway
1. Input the key word in the space for “Position or search term” and click the “submit” button.
2. Select the target gene from the search result.
3. The gene’s genomic structure will be displayed, with the CpG islands shown in green.
4. Click a CpG island shown in green; the information will be displayed.
5. Click the link labeled “View DNA for this feature” to display the screen for obtaining sequence information. 6. Click the “get DNA” button to display the sequence
information.
Designing primers for bisulfite-treated sequences is difficult to accomplish manually. The use of a designing tool specifically created for this purpose is recommended. The following design tools are available free of charge online.
(For details of operating methods, please refer to the “Help” or a similar section of each tool.
• MethPrimer:
http://www.urogene.org/methprimer/index1.html • BiSearch: http://bisearch.enzim.hu/?m=msp
3-3. COBRA
In the COBRA method, after bisulfite treatment, PCR
amplification of the region being assayed is carried out using a common primer for both methylated and unmethylated DNAs. This step is followed by restriction enzyme digestion to identify sites with different sequences in terms of methylated and unmethylated DNAs.
▀ Experimental Example 4: Methylation Analyses by
COBRA [Method]
HeLa cell genomic DNA (HeLa genome) and EpiScope® Methylated HeLa Genomic DNA (methylated HeLa genome) in the amount of 2.6 µg each were given bisulfite treatment with MethylEasy™ Xceed. An 80-ng sample of each treated genomic DNA was used as the template to amplify part of the CpG island region of MLH1 using TaKaRa Taq™ HS. PCR products (amplification size: 384 bp) were purified with a spin-column and eluted in a 50 µl volume. A 20-µl aliquot of the eluent was digested with a restriction enzyme
(Taq I; T↓CGA, 65°C for 4 h) and condensed to 10 µl by ethanol precipitation, followed by electrophoresis. We now recommend use of EpiTaq™ HS (for bisulfite-treated DNA in place of TaKaRa Taq™ HS for superior amplification.
[Result]
If the region being examined is methylated, the DNA
sequence will remain unchanged after bisulfite treatment. As a result, the 384-bp amplification product is cleaved by Taq I, yielding a 128-bp and a 254-bp fragments. The PCR product derived from the methylated HeLa genome was cut into the expected sizes (Figure 8). Meanwhile, the PCR product from HeLa genome was not cleaved. This is because cytosines were converted to uracils by bisulfite treatment in the region of the MLH1 gene targeted for analysis, suggesting this region of the HeLa genome is unmethylated.
M 1 2 M
Figure 8. Example of Analysis by COBRA.
Lane 1: Methylated HeLa genome (Cat. #3520) 2: HeLa genome
M: 100 bp DNA Ladder 200 ng Used 3% NuSieve® 3:1 Agarose
[4] Regional Genomic DNA Methylation
Quantitative Analyses without Bisulfite Treatment
Real-time PCRs, which allow accurate quantitative
determination, are used when assaying target gene regions after enrichment of the methylated/unmethylated DNA regions by a technique such as MIRA or MeDIP -- which will be discussed later, or when performing analyses by the qAMP method. Real-time PCRs are also effective in investigating the correlation between DNA methylation and gene expression level.
▀ Quantitative Determination of Specific Genomic
Regions by Real-Time PCR
Quantitative determination of the region upstream of a transcription initiation site that has been demonstrated to have a strong correlation with gene expression (approximately 300 bp) is performed in DNA methylation analyses. This region frequently has CpG islands and high-GC-content sequences. When performing real-time PCRs for this purpose, Takara Bio recommends using SYBR® Advantage GC (Clontech Cat. #638320).
▀ Gene Expression Analyses by Real-Time PCR Genes with methylated CpG islands in general have their expression strongly suppressed. For quantitative determination of mRNA expression levels, real-time RT-PCR is recommended. Takara Bio offers a complete lineup of real-time PCR reagents to meet your needs.
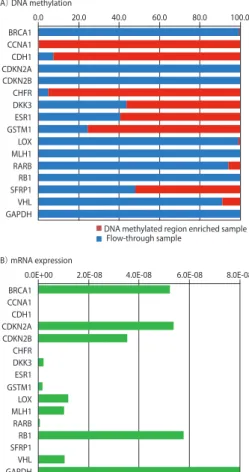
▀ Experimental Example 5: Gene Expression Analysis A sample of enriched DNA methylated region (red) prepared from HeLa genomic DNA with DNA-binding protein and a flow-through sample (blue) were assayed quantitatively by real-time PCR with the area upstream of the multi-gene transcription initiation site as the target. The results are shown in Figure 9-A as percentages present in the two samples. Real-time PCR was conducted using SYBR® Premix Ex Taq™ GC (Perfect Real Time). Note: this product is not sold in Europe or the U.S., but SYBR® Advantage GC (Clontech Cat. #638320) may be used in its place. Gene expression analyses were also performed on each gene with total RNA prepared from HeLa cells as the template (Figure 9-B).
These results also indicate a correlation between DNA methylation and gene expression level.
㧔B㧕 mRNA expression
0.0E+00 2.0E-08 4.0E-08 6.0E-08 8.0E-08 BRCA1 CCNA1 CDH1 CDKN2A CDKN2B CHFR DKK3 ESR1 GSTM1 LOX MLH1 RARB RB1 SFRP1 VHL GAPDH 㧔A㧕 DNA methylation 0.0 20.0 40.0 60.0 80.0 100.0 BRCA1 CCNA1 CDH1 CDKN2A CDKN2B CHFR DKK3 ESR1 GSTM1 LOX MLH1 RARB RB1 SFRP1 VHL GAPDH
DNA methylated region enriched sample Flow-through sample
Figure 9. Quantitative Determination of Methylation in a Specific Genomic Region and Gene Expression Analyses by Real-Time PCR.
▀ Analyses by qAMP
The qAMP (quantitative analysis of DNA methylation using real-time PCR) method uses restriction enzymes with different methylation sensitivities. The genomic DNA sample was divided into four aliquots, with three of them receiving treatment by methylation-sensitive restriction enzyme digestion, methylation-dependent restriction enzyme digestion, or a double-digestion by these two enzymes, and the remaining aliquot receiving no treatment to serve as the control. After restriction enzyme treatment, real-time PCRs were conducted with a primer sandwiching the cleavage site to determine the residual quantity of genomic DNA (Figure 10). Sample DNA mC C qPCR result Measure total Measure unmethylated status Measure methylation status No detection After treatment Restriction enzyme treatment Without treatment Methylation-dependent restriction enzyme Methylation-sensitive restriction enzyme Double-digestion
Figure 10. Principle of How qAMP Works.
Generally, methylation-dependent cleavage is achieved by McrBC (an endonuclease that specifically cleaves both single- and double-strand DNAs containing methylated cytosine).
Table 2 provides a summary list of methylation sensitive restriction enzymes (MSREs) that may be useful for mammalian epigenetics analyses when used with CpG methylase. For details of each restriction enzyme, please refer to our website.
Table 2. Methylation Sensitive Restriction Enzymes
Restriction
Enzyme Recognition Sequence Cat. #
Aat II GACGT↓C 1112A/B
Acc II CG↓CG 1002A/B
Aor13H I T↓CCGGA 1224A/B
Aor51H I AGC↓GCT 1118A/B
BspT104 I TT↓CGAA 1225A/B
BssH II G↓CGCGC 1119A/B
Cfr10 I R↓CCGGY 1120A/B
Cla I AT↓CGAT 1034A/B/AH/BH
Cpo I CG↓GWCCG 1035A/B
Eco52 I C↓GGCCG 1039A/B
Hae II RGCGC↓Y 1050A/B
Hap II* C↓CGG 1053A/B/AH/BH
Hha I GCG↓C 1056A/B
Mlu I A↓CGCGT 1071A/B/AH/BH
Nae I GCC↓GGC 1155A/B
Not I GC↓GGCCGC 1166A/B/BH
Nru I TCG↓CGA 1168A/B
Nsb I TGC↓GCA 1226A/B
PmaC I CAC↓GTG 1177A/B
Psp1406 I AA↓CGTT 1108A/B
Pvu I CGAT↓CG 1075A/B
Sac II CCGC↓GG 1079A/B
Sal I G↓TCGAC 1080A/B/AH/BH
Sma I CCC↓GGG 1085A/B/AH/BH
SnaB I TAC↓GTA 1179A/B
* Just as Hap II, Msp I (Cat, #1150A/B/AH/BH), an isoschizomer of Hap II, recognizes and cleaves C↓CGG, except it is non-sensitive to CpG methylation.
[5] Global Methylation Analyses of Genome-Wide DNA
5-1. MIRA
MIRA (methylated CpG island recovery assay) is a technique for enriching methylated regions of genomic DNA using methylated DNA-binding protein. Enriched genomic DNAs are generally assayed by microarray. Assays by a next-generation sequencer have become available in recent years.
8
5-2. MeDIP
MeDIP (methylated DNA immunoprecipitation) is also a technique for enriching methylated regions of genomic DNA just as MIRA, except it uses an anti-methylated cytosine antibody. The enriched DNA may be assayed by either a microarray or a next-generation sequencer.
▀ Conclusion
This article is focused on the regional methylation analyses of genomic DNA. Takara Bio will continue to endeavor to develop products that help improve efficiency in epigenetics studies. Announcements will be made as new products and services become available.
Notice to Purchaser. Your use of these products and technologies is subject to compliance with any applicable licensing requirements described on the product’s web page at http://www.takara-bio.us. It is your responsibility to review, understand and adhere to any restrictions imposed by such statements.
TB 633275 US
▀ Related Takara Products
Product Cat. # Size Price
MethylEasy™ Xceed Rapid DNA Bisulphite Modifcation Kit* ME002 40 rxns $207
MethylEasy™ DNA Bisulphite Modifcation Kit* ME001 25 rxns $311
EpiScope® Methylated HeLa Genomic DNA 3520 15 µg $220
EpiScope® MSP Kit R100A 200 rxns $425
R100B 400 rxns $750
EpiTaq™ HS (for bisulfite-treated DNA) R110A 250 U $190
R110B 1,000 U $610
SYBR® Premix Ex Taq ™ II (Tli RNaseH Plus) RR820A 200 rxns $284
RR820B 400 rxns $555
DNA Ligation Kit, Mighty Mix 6023 75–150 rxns $173
Anti-Histone H3, Mouse Monoclonal Antibody MA301B 100 µL $320
Anti -Monomethyl Histone H3 (Lys4), Mouse Monoclonal Antibody MA302B 100 µL $320
Anti-Dimethyl Histone H3 (Lys4), Mouse Monoclonal Antibody MA303B 100 µL $320
Anti-Trimethyl Histone H3 (Lys4), Mouse Monoclonal Antibody MA304B 100 µL $320
Anti-Acetyl Histone H3 (Lys9), Mouse Monoclonal Antibody MA305B 100 µL $320
Anti-Monomethyl Histone H3 (Lys9), Mouse Monoclonal Antibody MA306B 100 µL $320
Anti-Dimethyl Histone H3 (Lys9), Mouse Monoclonal Antibody MA307B 100 µL $320
Anti-Trimethyl Histone H3 (Lys9), Mouse Monoclonal Antibody MA308B 100 µL $320
Anti-Acetyl Histone H3 (Lys27), Mouse Monoclonal Antibody MA309B 100 µL $320
Anti-Acetyl Histone H3 (Lys9/27), Mouse Monoclonal Antibody MA310B 100 µL $320
Anti-Phospho Histone H3 (Ser10), Mouse Monoclonal Antibody MA312B 100 µL $320
* Product of Human Genetic Signatures
Please visit the Takara web site for MSRE (Methylation Sensitive Restriction Enzyme) pricing and our complete list of Anti-histone antibodies: http://www.clontech.com/takara.
▀ Related Clontech Products
Product Cat. # Size Price
EpiXplore Methyl Detection Kit 631968 10 rxns $175
EpiXplore Methylated DNA Enrichment and Detection Kit 631967 10 rxns $373
EpiXplore Methylated DNA Enrichment Kit 631963 10 rxns $198
631962 20 rxns $350
SYBR® Advantage GC 638320 200 rxns $175