Detecting Algorithmically Generated Domain-Flux
Attacks with DNS Traffic Analysis
Sandeep Yadav, Student Member, IEEE, Ashwath Kumar Krishna Reddy, A.L. Narasimha Reddy, Fellow, IEEE,
and Supranamaya Ranjan
Abstract—Recent Botnets such as Conficker, Kraken and Torpig
have used DNS based “domain fluxing” for command-and-control, where each Bot queries for existence of a series of domain names and the owner has to register only one such domain name. In this paper, we develop a methodology to detect such “domain fluxes” in DNS traffic by looking for patterns inherent to domain names that are generated algorithmically, in contrast to those generated by humans. In particular, we look at distribution of alphanumeric characters as well as bigrams in all domains that are mapped to the same set of IP-addresses. We present and compare the performance of several distance metrics, including KL-distance, Edit distance and Jaccard measure. We train by using a good data set of domains obtained via a crawl of domains mapped to all IPv4 address space and modeling bad data sets based on behaviors seen so far and expected. We also apply our methodology to packet traces collected at a Tier-1 ISP and show we can automatically detect domain fluxing as used by Conficker botnet with minimal false positives, in addition to discovering a new botnet within the ISP trace. We also analyze a campus DNS trace to detect another unknown botnet exhibiting advanced domain name generation technique.
Index Terms—Components, Domain flux, Domain names, Edit
distance, Entropy, IP Fast Flux, Jaccard Index, Malicious
I. INTRODUCTION
R
ECENT botnets such as Conficker, Kraken and Torpig have brought in vogue a new method for botnet operators to control their bots: DNS “domain fluxing”. In this method, each bot algorithmically generates a large set of domain names and queries each of them until one of them is resolved and then the bot contacts the corresponding IP-address obtained that is typically used to host the command-and-control (C&C) server. Besides for command-and-control, spammers also routinely generate random domain names in order to avoid detection. For instance, spammers advertise randomly generated domain names in spam emails to avoid detection by regular expression based domain blacklists that maintain signatures for recently ‘spamvertised’ domain names.The botnets that have used random domain name generation vary widely in the random word generation algorithm as well as the way it is seeded. For instance, Conficker-A [27] bots generate 250 domains every three hours while using the current date and time at UTC (in seconds) as the seed, which in turn is obtained by sending empty HTTP GET queries to a few legitimate sites such as google.com, baidu.com, answers.com etc. This way, all bots would generate the same domain names every day. In order S. Yadav and A.L. Narasimha Reddy are with the Department of Electrical and Computer Engineering, Texas A&M University, College Station, TX, 77843 USA e-mail:{sandeepy@, reddy@ece.}tamu.edu
A.K.K. Reddy is at Microsoft, Redmond, WA, USA e-mail : [email protected]
S. Ranjan is at MyLikes Corp., CA, USA e-mail : [email protected]
to make it harder for a security vendor to pre-register the domain names, the next version, Conficker-C [28] increased the number of randomly generated domain names per bot to 50K. Torpig [30], [6] bots employ an interesting trick where the seed for the random string generator is based on one of the most popular trending topics in Twitter. Kraken employs a more sophisticated random word generator and constructs English-language like words with properly matched vowels and consonants. Moreover, the randomly generated word is combined with a suffix chosen randomly from a pool of common English nouns, verbs, adjective and adverb suffixes, such as -able, -hood, -ment, -ship, or -ly.
From the point of view of botnet owner(s), the economics work out quite well. They only have to register one or a few domains out of the several domains that each bot would query every day. Whereas, security vendors would have to pre-register
all the domains that a bot queries every day, even before the
botnet owner registers them. In all the cases above, the security vendors had to reverse engineer the bot executable to derive the exact algorithm being used for generating domain names. In some cases, their algorithm would predict domains successfully until the botnet owner would patch all his bots with a re-purposed executable with a different domain generation algorithm [30].
We argue that reverse engineering of botnet executables is resource- and time-intensive and precious time may be lost before the domain generation algorithm is cracked and consequently before such domain name queries generated by bots are detected. In this regard, we raise the following question: Can we detect
algorithmically generated domain names while monitoring DNS traffic even when a reverse engineered domain generation algo-rithm may not be available?
Hence, we propose a methodology that analyzes DNS traffic to detect if and when domain names are being generated algo-rithmically as a line of first defense. Our technique for anomaly detection may be applied by analyzing groups of domains ex-tracted from the DNS queries, seen at the edge of an autonomous system. Therefore, our proposed methodology can point to the presence of bots within a network and the network administrator can disconnect bots from their C&C server by filtering out DNS queries to such algorithmically generated domain names.
Our proposed methodology is based on the following observa-tion: current botnets do not use well formed and pronounceable language words since the likelihood that such a word is already registered at a domain registrar is very high; which could be self-defeating as the botnet owner then would not be able to control his bots. In turn, this means that such algorithmically generated domain names can be expected to exhibit characteristics vastly different from legitimate domain names. Hence, we develop
metrics using techniques from signal detection theory and statis-tical learning which can detect algorithmically generated domain names that may be generated via a myriad of techniques: (i) those generated via pseudo-random string generation algorithms as well as (ii) dictionary-based generators, for instance the one used by Kraken ([5], [3], [4]) as well as the Kwyjibo tool [12] which can generate words that are pronounceable yet not in the English dictionary.
Our method of detection comprises of two parts. First, we propose several ways to group together DNS queries: (i) either by the Top Level Domain (TLD) they all correspond to or; (ii) the IP-address that they are mapped to or; (iii) the connected component that they belong to, as determined via connected component analysis of the IP-domain bipartite graph. Second, for each such group, we compute metrics that characterize the distribution of the alphanumeric characters or bigrams (two consecutive alphanumeric characters) within the set of domain names. Specifically, we propose the following metrics to quickly differentiate a set of legitimate domain names from malicious ones: (i) Information entropy of the distribution of alphanu-merics (unigrams and bigrams) within a group of domains; The distribution comparison is made using the Kullback-Leibler (K-L) divergence which computes the “distance” between two distributions. (ii) Jaccard index to compare the set of bigrams between a malicious domain name with good domains and; (iii) Edit-distance which measures the number of character changes needed to convert one domain name to another.
We apply our methodology to a variety of data sets. First, we obtain a set of legitimate domain names via reverse DNS crawl of the entire IPv4 address space. Next, we obtain a set of malicious domain names as generated by Conficker and Kraken as well as model a much more sophisticated domain name generation algorithm: Kwyjibo [12]. Finally, we apply our methodology to one day of network traffic from one of the largest Tier-1 ISPs in Asia and South America and show how we can detect Conficker as well as a botnet hitherto unknown, which we call Mjuyh (details in Section V).
Our extensive experiments allow us to characterize the effec-tiveness of each metric in detecting algorithmically generated domain names in different attack scenarios. With our experiments, we observe that in general, our tool’s performance improves with a larger data set used for analysis. For instance, when 200 domains are generated per TLD, then Edit distance achieves 100% detection accuracy with 8% false positives and when 500 domains are generated per TLD, Jaccard Index achieves 100% detection with 0% false positives. Applying our metrics to a campus DNS trace, we discover an unknown botnet which generates domain names by combining English dictionary words, which we detect with a false positive rate of 2.56%.
The terminology we use in this work is as follows. For a host name such as physics.university.edu, we refer to
univer-sity as the second-level domain label, edu as the first-level
domain, and university.edu as the second-level domain. Similarly,
physics.university.edu is considered a third-level domain and physics, a third-level domain label. The ccTLDs such as co.uk
are effectively considered as first-level domains.
The rest of this paper is organized as follows. In Section II, we compare our work against related literature. In Section
III, we present our detection methodology and introduce the metrics we have developed. In Section IV, we present the various ways by which domains can be grouped in order to compute the different metrics over them. Next, in Section V, we present results to compare each metric as applied to different data sets and trace data. Further, in Section VI, we present the detection of malicious domains in a supervised learning framework. Section VII discusses limitations and improvements, with conclusions in Section VIII.
II. RELATEDWORK
Characteristics, such as IP addresses, whois records and lexical features of phishing and non-phishing URLs have been analyzed by McGrath and Gupta [22]. They observed that the different URLs exhibited different alphabet distributions. Our work builds on this earlier work and develops techniques for identifying domains employing algorithmically generated names, potentially for “domain fluxing”. Ma, et al [17], employ statistical learning techniques based on lexical features (length of domain names, host names, number of dots in the URL etc.) and other features of URLs to automatically determine if a URL is malicious, i.e., used for phishing or advertising spam. While they classify each URL independently, our work is focused on classifying a group of URLs as algorithmically generated or not, solely by making use of the set of alphanumeric characters used. In addition, we experimentally compare against their lexical features in Section V and show that our alphanumeric distribution based features can detect algorithmically generated domain names with lower false positives than lexical features. Overall, we consider our work as complimentary and synergistic to the approach in [17]. [33] develops a machine learning technique to classify individual domain names based on their network features, domain name string composition style and presence in known reference lists. Their technique, however, relies on successful resolution of DNS domain name query. Our technique instead, can analyze groups of domain names, based only on alphanumeric character features. With reference to the practice of “IP fast fluxing”, e.g., where the botnet owner constantly keeps changing the IP-addresses mapped to a C&C server, [24] implements a detection mechanism based on passive DNS traffic analysis. In our work, we present a methodology to detect cases where botnet owners may use a combination of both domain fluxing with IP fluxing, by having bots query a series of domain names and at the same time map a few of those domain names to an evolving set of IP-addresses. Also earlier papers [23], [20] have analyzed the inner-working of IP fast flux networks for hiding spam and scam infrastructure. With regards to botnet detection, [14], [15] perform correlation of network activity in time and space at campus network edges, and Xie et al in [34] focus on detecting spamming botnets by developing regular expression based signatures for spam URLs . We find that graph analysis of IP addresses and domain names embedded in DNS queries and replies reveal interesting macro re-lationships between different entities and enable identification of bot networks (Conficker) that seemed to span many domains and TLDs. With reference to graph based analysis, [35] utilizes rapid changes in user-bot graphs structure to detect botnet accounts.
Statistical and learning techniques have been employed by various studies for prediction [10], [25], [13]. We employed
results from detection theory in designing our strategies for classification [31], [11].
Several studies have looked at understanding and reverse-engineering the inner workings of botnets [5], [3], [4], [16], [30], [26], [29]. Botlab has carried out an extensive analysis of several bot networks through active participation [19] and provided us with many example datasets for malicious domains.
III. DETECTIONMETRICS
In this section, we present our detection methodology that is based on computing the distribution of alphanumeric characters for groups of domains. First, we motivate our metrics by showing how algorithmically generated domain names differ from legiti-mate ones in terms of distribution of alphanumeric characters. Next, we present our three metrics, namely Kullback-Leibler (KL) distance, Jaccard Index (JI) measure and Edit distance. Finally, in Section IV we present the methodology to group domain names.
A. Data Sets
We first describe the data sets and how we obtained them:
(i) ISP Dataset: We use network traffic trace collected from
across 100+ router links at a Tier-1 ISP in Asia. The trace is one day long (21-hour long, collected on Nov 3, 2009) and provides details of DNS requests and corresponding replies. This dataset consumes 66 GB of hard drive space and consists of 355M packets with 38M flows. These flows include various protocols such as DNS, HTTP, SMTP, etc. Of these flows, there are about 270,000 DNS name server replies. The queries captured at the ISP edge, come from approximately 8,400 clients which are mostly recursive DNS resolvers for smaller networks. (ii) Non-malicious DNS Dataset: We performed a reverse DNS crawl of
the entire IPv4 address space to obtain a list of domain names and their corresponding IP-addresses. The crawl was performed on Mar 04, 2010 and lasted for approximately 20 hours. We perform this crawl through a system utilizing a DNS recursive nameserver for resolving DNS PTR queries issued for IPv4 addresses. We issue DNS PTR requests for various subnets and IP addresses, barring certain subnets belonging to military and un-assigned zones. Such a request excludes DNS type A records where multiple domains map to a single server (CDNs or website-hosts). We further divided this data set in to several parts, each comprising of domains which had 500, 200, 100 and 50 domain labels. The DNS Dataset is considered as non-malicious for the following reasons. Botnets may own only a limited number of IP addresses. Based on our study, we find that a DNS PTR request maps an IP address to only one domain name. The dataset thus obtained will contain very few malicious domain names per analyzed group. In the event that the bots exhibit IP fluxing, the botnet owners cannot change the PTR DNS mapping for IP addresses not owned. Although, the malicious name servers may map domain names to any IP address. (iii) Malicious datasets: We obtained the list of domain names that were known to have been generated by recent Botnets: Conficker [27], [28], Torpig [30], Kraken [5], [3], Pushdo, etc. We obtain these domains from BotLab [19] which provides us with URLs used by bots belonging to the respective botnets. Specifically, we extract domains from
10K URLs for Kraken, 25K URLs for MegaD, 17K URLs for Srizbi, 4.8K URLs for Storm, and 5.4K URLs for Pushdo. We also leverage our analysis with previous studies to identify the domains for Conficker and Torpig. As described earlier in the Introduction, Kraken exhibits the most sophisticated domain generator by carefully matching the frequency of occurrence of vowels and consonants as well as concatenating the resulting word with common suffixes in the end such as -able, -dom, etc. (iv) Kwyjibo: We model a much more sophisticated algorithmic domain name generation algorithm by using Kwyjibo [12], a tool which generates domain names that are pronounceable yet not in the English language dictionary and hence much more likely to be available for registration at a domain registrar. The algorithm uses a syllable generator, where they first learn the frequency of one syllable following another in words in English dictionary and then automatically generate pronounceable words by modeling it as a Markov process.
B. Motivation
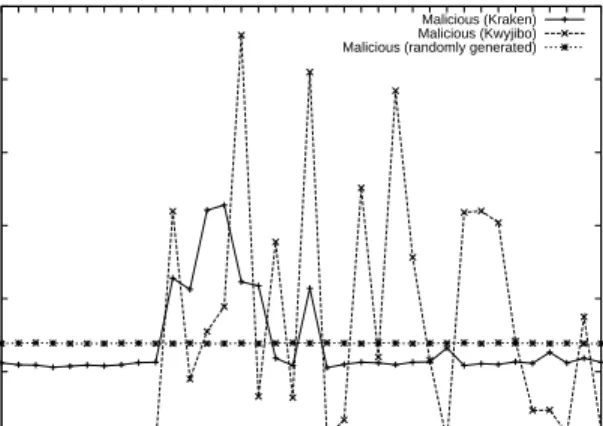
Our detection methodology is based on the observation that algorithmically generated domains differ significantly from le-gitimate (human) generated ones in terms of the distribution of alphanumeric characters. Figure 1(a) shows the distribution of alphanumeric characters, defined as the set of English alphabets (a-z) and digits (0-9) for both legitimate as well as malicious domains 1. We derive the following points: (i) First, note that both the non-malicious data sets exhibit a non-uniform frequency distribution, e.g., letters ‘m’ and ‘o’ appear most frequently in the non-malicious ISP data set whereas the letter ‘s’ appears most frequently in the non-malicious DNS data set.(ii)Even the most sophisticated algorithmic domain generator seen in the wild for Kraken botnet has a fairly uniform distribution, albeit with higher frequencies at the vowels: ‘a’, ‘e’ and ‘i’. (iii) If botnets of future were to evolve and construct words that are pronounceable yet not in the dictionary, then they would not exhibit a uniform distribution as expected. For instance, Kwyjibo exhibits higher frequencies at alphabets, ‘e’, ‘g’, ‘i’, ‘l’, ‘n’, etc. In this regards, techniques that are based on only the distribution of unigrams (single alphanumeric characters) may not be sufficient, as we will show through the rest of this section.
C. Metrics for anomaly detection
The K-L(Kullback-Leibler) divergence metric is a non-symmetric measure of ”distance“ between two probability tributions. The divergence (or distance) between two dis-cretized distributions P and Q is given by: DKL(P||Q) =
Pn
i=1P(i)log
P(i)
Q(i).
where n is the number of possible values for a discrete random variable. The probability distribution P represents the test distribution and the distribution Q represents the base distribution from which the metric is computed.
Since the K-L measure is asymmetric in nature, we use a sym-metric form of the sym-metric. The modified K-L sym-metric is computed using the formula:Dsym(P Q) = 12(DKL(P||Q)+DKL(Q||P)). 1Even though domain names may contain characters such as ‘-’, we currently limit our study to alphanumeric characters only as very few domains in practice use the ‘-’ character. Previous work has also studied lexical features associated with a domain/URL.
0 0.02 0.04 0.06 0.08 0.1 0.12 0.14 0 1 2 3 4 5 6 7 8 9 a b c d e f g h i j k l m n o p q r s t u v w x y z Probability of occurrence Alphanumeric characters Non-malicious(ISP dataset) Non-malicious (DNS dataset) Malicious (randomly generated)
(a) Non-malicious and malicious domains.
0 0.02 0.04 0.06 0.08 0.1 0.12 0 1 2 3 4 5 6 7 8 9 a b c d e f g h i j k l m n o p q r s t u v w x y z Probability of occurrence Alphanumeric characters Malicious (Kraken) Malicious (Kwyjibo) Malicious (randomly generated)
(b) Only malicious entities Fig. 1. Distinction between probability distributions of malicious and non-malicious domains.
For cases with singular probabilities of the random variable in the distribution, we apply suitable modifications to compute a well-defined K-L value. The modifications include ignoring computation for singular probabilities for random variables of test/malicious/non-malicious distributions.
Given a test distribution q computed for the domain to be tested, and non-malicious and malicious probability distribution over the alphanumerics as g and b respectively, we characterize the distribution as malicious or not via the following optimal classifier: Dsym(qb)−Dsym(qg) g ≷ b 0 (1)
We now prove that equation (1) presents an optimal classifier. LetA={a1, a2, . . . , aM}denoteM the letters of the alphabet from which the domain names are chosen (in our case, this is English alphabet with spaces and special characters). Let g = [g1, g2, . . . , gM] and b = [b1, b2, . . . , bM] be the distribution of the letters in the good and bad domains, respectively. Let x be the actual domain name of lengthN, that has to be classified as being good or bad. Let the letter ai appear ni times in x such that P
ini =N. Let q= [q1, q2, . . . , qM] be the distribution of the different letters in x, i.e., qi=ni/N.
Under the assumption that a priori,xcan belong to a good or bad domain with equal probability, the classifier that minimizes the probability of error (wrong classification) is given by the maximum-likelihood classifier which classifies xaccording to
P(x|g)≷g b
P(x|b) (2)
Intuitively, x is classified as good, if it is more likely to have resulted from the good distribution than from the bad distribution. The above classifier can be specified in terms of the likelihood ratio given by λ(x) = P(x|g) P(x|b) g ≷ b 1 (3)
As we will see later, it is easier to work with an equivalent quantity N1 logλ(x). The classifier is then given according to
1 N logλ(x) = 1 N log P(x|g) P(x|b) g ≷ b 0 (4)
Under the assumption that the letters inxhave been generated independently from the same distribution,P(x|g)is given by
P(x|g) = N Y k=1 P(xk|g) = M Y i=1 P(ai|g)ni= M Y i=1 gni i = M Y i=1 gqiN i . (5) The second equality follows by grouping all the occurrences of the letters ai together and recall that there are ni such occurrences. Similarly, P(x|b) = N Y k=1 P(xk|b) = M Y i=1 P(ai|b)ni = M Y i=1 bni i = M Y i=1 bqiN i . (6) Using (5) and (6) in (4), the log-likelihood ratio can be seen to be 1 N logλ(x) = 1 N log P(x|g) P(x|b) = log QM i=1g qi i QM i=1b qi i (7) Dividing the numerator and the denominator by Q
iqiqi, we get 1 N logλ(x) = log QM i=1 gi qi qi QM i=1 bi qi qi (8) = X i qilog gi qi −X i qilog bi qi (9) = D(q|b)−D(q|g) (10) where D(q|b)is the Kullback-Leibler (KL) distance between the two distributions. Thus, the optimal classifier given in (4) is equivalent to
D(q|b)−D(q|g)≷g b
0 (11)
This result is intuitively pleasing since the classifier essentially computes the KL “distance” betweenqand the two distributions and chooses the one that is ‘closer’. Hence, for the test distri-butionq to be classified as non-malicious, we expectDsym(qg) to be less thanDsym(qb). However, ifDsym(qg)is greater than
1) Measuring K-L divergence with unigrams: The first metric
we design measures the KL-divergence of unigrams by consid-ering all domain names that belong to the same group, e.g. all domains that map to the same IP-address or those that belong to the same top-level domain. We postpone discussion of groups to Section IV. Given a group of domains for which we want to establish whether they were generated algorithmically or not, we first compute the distribution of alphanumeric characters to obtain the test distribution. Next, we compute the KL-divergence with a good distribution obtained from the non-malicious data sets (ISP or DNS crawl) and a malicious distribution obtained by modeling a botnet that generates alphanumerics uniformly. The net K-L divergence metric is defined by:
d=Dsym(qb)−Dsym(qg) (12) A higher value ofdfor a group indicates lower maliciousness for the group.
As expected, a simple unigram based technique may not suf-fice, especially to detect Kraken or Kwyjibo generated domains. Hence, we consider bigrams in our next metric.
2) Measuring K-L divergence with bigrams: A simple
ob-fuscation technique that can be employed by algorithmically generated malicious domain names could be to generate domain names by using the same distribution of alphanumerics as com-monly seen for legitimate domains. Hence, in our next metric, we consider distribution of bigrams, i.e., two consecutive characters. We argue that it would be harder for an algorithm to generate domain names that exactly preserve a bigram distribution similar to legitimate domains since the algorithm would need to consider the previous character already generated while generating the current character. The choices for the current character will hence be more restrictive than when choosing characters based on unigram distributions. Thus, the probability of test bigrams matching a non-malicious bigram distribution, becomes smaller. From our datasets, we observe only a few bigrams occurring more often than others, reinforcing our idea. Thus, the classification based on bigram distribution may be used as an additional test for identifying malicious behavior.
Analogous to the case above, given a group of domains, we ex-tract the set of bigrams present in it to form a bigram distribution. Note that for the set of alphanumeric characters that we consider [a-z,0-9], the total number of bigrams possible are 36x36, i.e., 1,296. Our improved hypothesis now involves validating a given test bigram distribution against the bigram distribution of non-malicious and non-malicious domain labels. We use the database of non-malicious words to determine a non-malicious probability distribution. For a sample malicious distribution, we generate bigrams randomly. Here as well, we use KL-divergence over the bigram distribution to determine if a test distribution is malicious or legitimate (again using equation (12)).
3) Using Jaccard Index between bigrams: We present the
second metric to measure the similarity between a known set of components and a test distribution, namely the Jaccard index measure. The metric is defined as
JI =A∩B A∪B
where, A and B each represent the set of random variables. For our particular case, the set comprises of bigrams that compose a
domain label or a host name. Note that Jaccard index (JI) measure based on bigrams is a commonly used technique for web search engine spell-checking [21].
The core motivation behind using the JI measure is same as that for KL-divergence. We expect that bigrams occurring in ran-domized (or malicious) host names to be mostly different when compared with the set of non-malicious bigrams. To elaborate, we construct a database of bigrams where each bigram points to a list of non-malicious words, domain labels or host names, as the case may be. We then determine all non-malicious words that contain at least 75% of the bigrams present in the test word. Such a threshold helps us discard words with less similarity. However, longer test words may implicitly satisfy this criteria and may yield ambiguous JI value. As observed for test words in the DNS PTR dataset, the word sizes for 95% of non-malicious words do not exceed 24 characters, and hence we divide all test words into units of 24 character strings.
Calculating the JI measure is best explained with an ex-ample. Considering a randomized host name such as
ick-oxjsov.botnet.com, we determine the JI value of the domain label ickoxjsov by first computing all bigrams (eight, in this case).
Next, we examine each bigram’s queue of non-malicious domain labels, and short list words with at least 75% of bigrams, i.e., six of the eight bigrams. Words satisfying this criteria may include thequickbrownfoxjumpsoverthelazydog (35 bigrams). However, such a word still has a low JI value owing to the large number of bigrams in it. Therefore, the JI value is thus computed as 6/(8 + 35 - 6) = 0.16. The low value indicates that the randomized test word does not match too well with the word from the non-malicious bigram database.
0 0.1 0.2 0.3 0.4 0.5 0.6 0.7 0.8 0.9 1 0 10 20 30 40 50 60 70 Jaccard measure Domain index Kraken (0.018) MegaD (0.006) Pushdo (0.051) Srizbi (0.102) Storm (0.005) apple.com (0.587) cisco.com (0.788) mit.edu (0.781) stanford.edu (0.864) yahoo.com (0.665)
Fig. 2. Scatter plot with Jaccard Index for bigrams (500 test words). Malicious groups have low Jaccard Index measure value than non-malicious groups.
The JI measure is thus computed for the remaining words. Note that for a group of test words, we compute the JI value only with a benign database, unlike K-L divergence which is computed with both a benign and a malicious distribution. We compute the JI measure using the equation described above and average it for all test words belonging to a particular group being analyzed. The averaged JI value for a non-malicious domain is expected to be higher than those for malicious groups.
The scatter plot presented in Fig. 2 indicates the clear sepa-ration obtained between non-malicious and malicious domains.
The plot represents the Jaccard measure using a case of 500 test words (details follow in section V). We highlight the detection of botnet based malicious domains such as Kraken, MegaD, Pushdo,
Srizbi, and Storm. A few well-known non-malicious domains such
as apple.com, cisco.com, stanford.edu, mit.edu, and yahoo.com have also been indicated for comparison purposes.
As observed via our experiments in Section V, the JI measure is better at determining domain based anomalies. However, it is also computationally expensive as the database of non-malicious bigrams needs to be maintained in the memory. Section VII examines the computational complexity of this metric.
4) Edit distance: Note that the two metrics described earlier,
rely on definition of a “good” distribution (KL-divergence) or database (JI measure). Hence, we define a third metric, Edit distance, which classifies a group of domains as malicious or legitimate by only looking at the domains within the group, and is hence not reliant on definition of a good database or distribution. The Edit distance between two strings represents an integral value identifying the number of transformations required to transform one string to another. It is a symmetric measure and provides a measure of intra-domain entropy. The type of eligible transformations are addition, deletion, and modification. For instance, to convert the word cat to dog, the edit distance is three as it requires all three characters to be replaced. With reference to determining anomalous domains, all domain labels (or host names) which are randomized, have on an average, a higher edit distance value. We use the Levenshtein edit distance dynamic algorithm for determining anomalies [21].
IV. GROUPINGDOMAINNAMES
In this section, we present ways by which we group together domain names in order to compute metrics that were defined in Section III earlier.
A. Per-domain analysis
Note that several botnets use several second-level domain names to generate algorithmic sub-domains. Hence, one way by which we group together domain names is via the second-level domain name. The intention is that if we begin seeing several algorithmically generated domain names being queried such that all of them correspond to the same second-level domain, then this may be reflective of a few favorite domains being exploited. Hence for all sub-domains, e.g., abc.examplesite.org,
def.examplesite.org, etc., that have the same second-level domain
name examplesite.org, we compute all the metrics over the al-phanumeric characters and bigrams of the corresponding domain labels. Since domain fluxing involves a botnet generating a large number of domain names, we consider only domains which contain a sufficient number of third-level domain labels, e.g., 50, 100, 200 and 500 sub-domains.
B. Per-IP analysis
As a second method of grouping, we consider all domains that are mapped to the same IP-address. This would be reflective of a scenario where a botnet has registered several of the algorithmic domain names to the same IP-address of a command-and-control server. Determining if an IP address is mapped to
several such malicious domains is useful as such an IP-address or its corresponding prefix can be quickly blacklisted in order to sever the traffic between a command-and-control server and its bots. We use the dataset from a Tier-1 ISP to determine all IP-addresses which have multiple host names mapped to it. For a large number of host names representing one IP address, we explore the above described metrics, and thus identify whether the IP address is malicious or not.
C. Component analysis
A few botnets have taken the idea of domain fluxing further and generate names that span multiple TLDs, e.g., Conficker-C generates domain names in 110 TLDs. At the same time domain fluxing can be combined with another technique, namely “IP fluxing” [24] where each domain name is mapped to an ever changing set of IP-addresses in an attempt to evade IP blacklists. Indeed, a combination of the two is even harder to detect. Hence, we propose the third method for grouping domain names into connected components.
We first construct a bipartite graph G with IP-addresses on one side and domain names on the other. An edge is constructed between a domain name and an IP-address if that IP-address was ever returned as one of the responses in a DNS query. When multiple IP addresses are returned, we draw edges between all the returned IP addresses and the queried host name.
First, we determine the connected components of the bipartite graphG, where a connected component is defined as one which does not have any edges with any other components. Next, we compute the various metrics (KL-divergence for unigrams and bi-grams, JI measure for bibi-grams, Edit distance) for each component by considering all the domain names within a component.
Component extraction separates the IP-domain graph into components which can be classified in to the following classes: (i) IP fan: these have one IP-address which is mapped to several domain names. Besides the case where one IP-address is mapped to several algorithmic domains, there are several legitimate sce-narios possible. First, this class could include domain hosting services where one IP-address is used to provide hosting to several domains, e.g. Google Sites, etc. Other examples could be mail relay service where one mail server is used to provide mail relay for several MX domains. Another example could be when domain registrars provide domain parking services, i.e., someone can purchase a domain name while asking the registrar to host it temporarily. (ii) Domain fan: these consist of one domain name connected to multiple IPs. This class will contain components belonging to the legitimate content providers such as Google, Yahoo!, etc. (iii)Many-to-many component: these are components that have multiple IP addresses and multiple domain names, e.g., Content Distribution Networks (CDNs) such as Akamai.
In section VI, we briefly explain the classification algorithm that we use to classify test components as malicious or not.
V. RESULTS
In this section, we present results of employing various metrics across different groups, as described in section III and IV. We briefly describe the data set used for each experiment.
With all our experiments, we present the results based on the consideration of increasing number of domain labels. In general, we observe that using a larger test data set yields better results.
A. Per-domain analysis
1) Data set: The analysis in this sub-section is based only
on the domain labels belonging to a domain. The non-malicious distribution g may be obtained from various sources. For our analysis, we use a database of DNS PTR records corresponding to all IPv4 addresses. The database contains 659 second-level domains with at least 50 third-level sub-domains, while there are 103 second-level domains with at least 500 third-level sub-domains. From the database, we extract all second-level domains which have at least 50 third-level sub-domains. All third-level domain labels corresponding to such domains are used to generate the distribution g. For instance, a second-level domain such as
university.edu may have many third-level domain labels such as physics, cse, humanities etc. We use all such labels that belong
to trusted domains, for determining g.
To create a malicious base distributionb, we randomly generate the same number of characters as in the non-malicious distribu-tion. However, for verification with our metrics, we use domain labels belonging to well-known malware based domains identified by Botlab, and also a publicly available webspam database, as malicious domains [1], [9]. Botlab provides us with various domains used by Kraken, Pushdo, Storm, MegaD, and Srizbi [1]. For per-domain analysis, the test words used are the third-level domain labels.
We present the results for all the four measures described earlier, for domain-based analysis. In later sections, we will only present data from one of the measures for brevity.
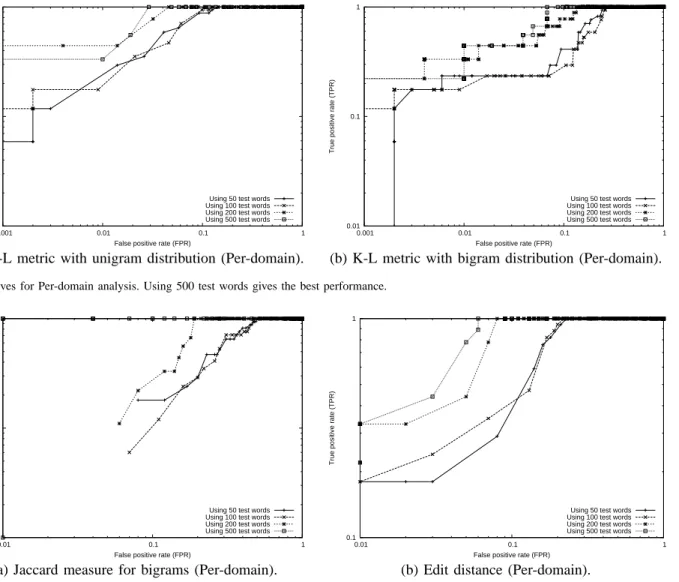
2) K-L divergence with unigram distribution: We measure
the symmetric K-L distance metric from the test domain to the malicious/non-malicious alphabet distributions. We classify the test domain as malicious or non-malicious based on equation (1). Figure 3(a) shows the results from our experiment presented as an ROC curve.
The figure shows that the different sizes of test data sets produce relatively different results. The area under the ROC is a measure of the goodness of the metric. We observe that with 200 or 500 domain labels, we cover a relatively greater area, implying that using many domain labels helps obtain accurate results. For example, using 500 labels, we obtain 100% detection rate with only 2.5% false positive rate. We also note a detection rate of approximately 33% for a false positive rate of 1%. Note that with a larger data set, we indeed expect higher true positive rates for small false positive rates, as larger samples will stabilize the evaluated metrics.
The number of domain labels required for accurate detection corresponds to the latency of accurately classifying a previously unseen domain. The results suggest that a domain-fluxing domain can be accurately characterized by the time it generates around 500 names.
3) K-L divergence with bigram distribution: Figure 3(b)
presents the results of employing K-L distance metric over bigram distributions. As before, we compute the bigram distribution of our test sets and compare the K-L divergence measure computed
against the good distribution and the uniform distribution (of bigrams). We again observe that using 200 or 500 domain labels does better than using smaller number of labels, with 500 labels doing the best. Experiments with 50/100 domain labels yield similar results.
We note that the performance with unigram distributions is relatively better than using bigram distributions. However, when botnets employ counter measures to our techniques, the bigram distributions provide an additional layer of defense along with the unigram distributions.
4) Jaccard measure of bigrams: The Jaccard Index measure
does significantly better in comparison to the previous metrics. From figure 4(a), it is evident that using 500 domain labels gives us a clear separation for classification of test domains (and hence an area of 1). Using 50 or 100 labels is fairly equivalent with 200 labels doing comparatively better. The JI measure produces higher false positives for smaller number of domains (50/100/200) than K-L distance measures.
5) Edit distance of domain labels: Figure 4(b) shows the
performance using edit distance as the evaluation metric. The detection rate for 50/100 test words reaches 1 only for high false positive rates, indicating that a larger test word set should be used. For 200/500 domain labels, 100% detection is achieved at false positive rates of 5-7%. Compare this to the detection rate of about 32% for a 1% false positive rate.
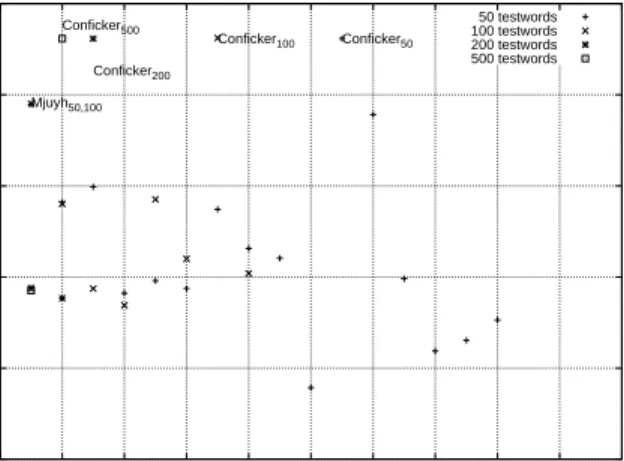
6) Kwyjibo domain label analysis: Kwyjibo is a tool to
generate random words which can be used as domain labels [12]. The generated words are seemingly closer to pronounceable words of the English language, in addition to being random. Thus many such words can be created in a short time. We anticipate that such a tool can be used by attackers to generate domain labels or domain names quickly with the aim of defeating our scheme. Therefore, we analyze Kwyjibo based words, considering them as domain labels belonging to a particular domain.
The names generated by Kwyjibo tool could be accurately characterized by our measures given sufficient names. Example results are presented in Fig. 5 with K-L distances over unigram distributions. From figure 5, we observe that verification with unigram frequency can lead to a high detection rate with low false positive rate. Again, the performance using 500 labels is the best. We also observe a very steep rise in detection rates for all the cases. The Kwyjibo domains could be accurately characterized with false positive rates of 6% or less.
The initial detection rate for Kwyjibo is low as compared to the per-domain analysis. This is because the presence of highly probable non-malicious unigrams in Kwyjibo based domains makes detection difficult at lower false positive rates. The results with other measures (K-L distance over bigram distributions, JI and edit distances) were similar: kwyjibo domains could be accurately characterized at false positive rates in the range of 10-12%, but detection rates were nearly zero at false positive rates of 10% or less.
7) Progressive demarcation: The earlier results have showed
that very high good detection rates can be obtained at low false positive rates once we have 500 or more host names of a test domain. As discussed earlier, the number of host names required for our analysis corresponds to latency of accurately charac-terizing a previously unseen domain. During our experiments,
0.01 0.1 1
0.001 0.01 0.1 1
True positive rate (TPR)
False positive rate (FPR)
Using 50 test words Using 100 test words Using 200 test words Using 500 test words
(a) K-L metric with unigram distribution (Per-domain).
0.01 0.1 1
0.001 0.01 0.1 1
True positive rate (TPR)
False positive rate (FPR)
Using 50 test words Using 100 test words Using 200 test words Using 500 test words
(b) K-L metric with bigram distribution (Per-domain). Fig. 3. ROC curves for Per-domain analysis. Using 500 test words gives the best performance.
0.01 0.1 1
0.01 0.1 1
True positive rate (TPR)
False positive rate (FPR)
Using 50 test words Using 100 test words Using 200 test words Using 500 test words
(a) Jaccard measure for bigrams (Per-domain).
0.1 1
0.01 0.1 1
True positive rate (TPR)
False positive rate (FPR)
Using 50 test words Using 100 test words Using 200 test words Using 500 test words
(b) Edit distance (Per-domain).
Fig. 4. ROC curves for Per-domain analysis. The figure again confirms best performance with 500 test words with JI measure giving the best performance among all metrics.
0.01 0.1 1
0.001 0.01 0.1 1
True positive rate (TPR)
False positive rate (FPR)
Using 50 test words Using 100 test words Using 200 test words Using 500 test words
Fig. 5. ROC curve : K-L metric with unigram distribution for Kwyjibo. Kwyjibo domains are relatively difficult to detect owing to pronounceable vowels in the seemingly random words.
not all the test domains required 500 host names for accurate characterization since the distributions were either very close to the good distributiong or bad distributionb. These test domains
could be characterized with a smaller latency (or smaller number of host names).
In order to reduce the latency for such domains, we tried an experiment at progressive demarcation or characterization of the test domains. Intuitively, the idea is to draw two thresholds above one there are clearly good domains, below the second threshold there are clearly bad domains and the domains between the two thresholds require more data (or host names) for accurate charac-terization. These thresholds are progressively brought closer (or made tighter) as more host names become available, allowing more domains to be accurately characterized until we get 500 or more host names for each domain. The results of such an experiment using the JI measure are shown in Fig. 6.
We establish the lower bound using the formulaµb+σbwhere
µbis the mean of JI values observed for bad or malicious domains and σb is the standard deviation. Similarly, the upper bound is obtained using the expression µg −σg where the subscript g implies good domains. Figure 6 shows the detection rate for the considered domains. We see a monotonically increasing detection rate for both good and bad domains. It is observed that 85% of bad domains could be so characterized accurately with only 100 host names while only about 23% of good domains can be so
characterized with 100 host names. In addition, our experiments indicate that only a small percentage of domains require 200 or more host names for their characterization.
0.2 0.3 0.4 0.5 0.6 0.7 0.8 0.9 1 0 100 200 300 400 500
Percentage of domains correctly identified
Number of test words used
Malicious domains detection rate Non-malicious domains detection rate
Fig. 6. Illustrating benefits of progressive demarcation with JI measure.
B. Per-IP analysis
1) Data set: Here, we present the evaluation of domain
names that map to an IP address. For analyzing the per-IP group, for all host names mapping to an IP-address, we use the domain labels except the top-level domain TLD as the test word. For instance, for host names physics.university.edu and
cse.university.edu mapping to an IP address, say 6.6.6.6, we use physicsuniversity and cseuniversity as test words. However, we
only consider IP addresses with at least 50 host names mapping to it. We found 341 such IP addresses, of which 53 were found to be malicious, and 288 were considered non-malicious. The data is obtained from DNS traces of a Tier-1 ISP in Asia.
Many host names may map to the same IP address. Such a mapping holds for botnets or other malicious entities utilizing a large set of host names mapping to fewer C&C(Command and Control) servers. It may also be valid for legitimate Internet service such as for Content Delivery Networks (CDNs). We first classify the IPs obtained into two classes of malicious and non-malicious IPs. The classification is done based on manual checking, using blacklists, or publicly available Web of Trust information [7]. We manually confirm the presence of Conficker based IP addresses and domain names [28]. The ground truth thus obtained may be used to verify the accuracy of classification. Figure 1 shows the distribution of non-malicious test words and the randomized distribution is generated as described previously. We now discuss the results of per-IP analysis below. The ROC curve for K-L metric shows that bigram distribution can be effective in accurately characterizing the domain names belonging to different IP addresses. We observe a very clear separation between malicious and non-malicious IPs with 500, and even with 200 test words. With a low false positive rate of 1%, high detection rates of 90% or more are obtained with 100 or greater number of test words.
The bigram analysis is found to perform better than unigram distributions. The per-IP bigram analysis performed better than per-domain bigram analysis. We believe that the bigrams obtained
from the ISP dataset provide a comprehensive non-malicious dis-tribution. The second-level domain labels also assist in discarding false anomalies, and therefore provide better accuracy.
The JI measure performs well, even for small set of test words. The area covered under the ROC curve is 1 for 200/500 test words. For the experiment with 100 test words, we achieve the detection rates of 100% with false positive rate of about 2%. Edit distance with domains mapping to an IP, results in a good performance in general. The experiments with 100 test words results in a false positive rate of about 10% for a 100% detection rate. However for using only 50 test words, the detection rate reaches about 80% for a false positive rate of 20%. Thus, we conclude that for per-IP based analysis, the JI measure performs relatively better than previous measures applied to this group. However, as highlighted in section VII, the time complexity for computing jaccard index is higher.
2) Detection of dictionary-based DGA botnet: In the previous
section, we highlight that the Kwyjibo tool may be used by attackers as a tool for generating randomized words whose alphanumeric character composition may not be clearly distin-guishable from the good references used for comparison. We however, detect Kwyjibo based domains efficiently. Attackers may also utilize an approach where domain names may be composed of words chosen from a language dictionary in an attempt to exhibit lower information entropy as a group of test words being analyzed. To elaborate, the more frequently used words from the dictionary comprise of vowels which may thus resemble the benign distribution more closely (see figure 1(a)).
To verify our hypothesis, we analyze a week long campus DNS trace collected between Aug 22, 2010 and Aug 29, 2010. The trace is collected by capturing DNS traffic exchanged between the campus’ primary DNS recursive resolver and local clients within the autonomous system. Our analysis leads us to identify a new botnet behavior where the domain names mapping to the C&C server IP address, are composed of two words from the English language. Some example domain names include elephantcode.ru,
gainpizza.ru, icepipe.ru, licensemoon.ru, and networkjack.ru. A
similar behavior is observed with the Storm botnet where the domain names used for spamming, were composed of one English language word and a randomized string [1]. Interestingly, all domain names observed for this botnet belong to the “ru” TLD. We verify the malfeasance of the observed domain names by cross verifying with domain reputation services [7] and hence declare the IP address as malicious if majority of domain names mapping to it, are not trustworthy.
We again apply our detection metrics to the above dataset. We compare the alphanumeric character distribution of dictionary-based DGA domain names, with the randomly generated (bad) distribution and the alphanumeric distribution from the DNS dataset (good). This is essentially a per-IP analysis where we evaluate the domain names mapping to the C&C server IP addresses. From our experiments, we observe that the edit dis-tance metric provides the lowest false positive rate (2.56%) for a 100% detection rate. Our findings imply that characters in the test group still exhibit malicious features detectable by our metrics. We also evaluate the usefulness of combining all four metrics when detecting malicious behavior by considering false positives common between the metrics used for detecting the
new botnet’s domain names. Our experiments yield a relatively lower false positive rate (2.04%) for a 100% detection rate. Thus, we infer a better performance, however, disregarding the resource complexity associated with every metric concluding that the information entropy exhibited by the botnet’s modified DGA, may still be detectable. The average normalized edit distance for the pairs of domains that we observe for dictionary-based domains, is in fact 0.8, only marginally lower than observed for Conficker based domains (0.9 on an average).
C. Applying Individual Metrics to Components
We extend the application of our metrics to components extracted from the Tier-1 ISP dataset from Asia (as utilized for Per-IP analysis). We choose components with at least 50 domain names, and then apply each of the metric, namely, K-L divergence with unigrams, Jaccard Index, and Edit distance, by randomly choosing appropriate number of test words(domains). In section VI, we highlight detection of Mjuyh, a botnet hitherto unknown, using a supervised learning approach. We find fourth-level domain labels of Mjuyh composed of random alphanumeric characters, thus detectable through a combination of metrics. To analyze Mjuyh based on individual metrics, however, we combine all domains for the botnet into a single connected component.
0 0.2 0.4 0.6 0.8 1 0 2 4 6 8 10 12 14 16 18 20 Mjuyh50,100 Conficker500 Conficker200 Conficker50 Conficker100 50 testwords 100 testwords 200 testwords 500 testwords
Fig. 7. Evaluation of the Edit Distance (ED) measure when applied to connected components. The ED measure is useful for identifying malicious connected components.
We apply the Edit Distance (ED) metric for the set of four test words, as shown in Figure 7. For components with at least 50 domains, we randomly choose 50, 100, 200, and 500 domains, discard the TLDs, and apply the metric to the obtained test words. Thus, each point in Figure 7 represents a component with 50, 100, 200, or 500 test words. We also label the malicious components (Conficker and Mjuyh). When detecting malicious components, we note good performance with the ED measure. ED detects the Mjuyh botnet because, although the fourth-level domain label is composed of a restricted set of characters, their combination is still not consistent, highlighting the anomaly. Note that a relatively longer randomized domain label also contributes towards amplifying the ED metric, making detection feasible. We also note false positives with small number of test words. For instance, the component represented by (12, 0.75) in Figure 7 refers to a mail server providing emailing infrastructure for
multiple domains. This behavior is analogous to the higher false positives observed for lower test words with other groups used for evaluation.
On evaluating the K-L divergence metric for various connected components (results not shown here), we observe that the distri-bution of alphanumeric characters for the Conficker component is distinct even with 50 test words, although there are greater false positives (as concluded through previous sections). Interestingly, we also note that the K-L metric does not help in identifying
Mjuyh. This is because the 57-character long fourth-level domain
label present in every domain, is composed of characters 0-9 and a-f, which suggests a hexadecimal encoding. Due to confined character set for comparing probability distributions, the divergence thus obtained is insufficient to be conclusive.
Similarly, we apply the Jaccard Index (JI) measure to different sets of test words as obtained earlier (results not shown here). We observe that Mjuyh has no similarity when compared to the benign database of bigrams. The malicious Conficker component also has a lower correlation. However, we also note several benign components having small (or zero) values for this metric indicating higher false positives. The analysis with JI measure generally leads us to conclude that a good performance is ensured in the case where the benign database is exhaustive, which directly impacts the computational complexity as well.
The above analysis leads us to the following question: Is
the Edit Distance metric sufficient for detecting anomalies? We
caution that while the ED measure appears to distinguish Mjuyh and Conficker components, it may be vulnerable to scenarios where Content Distribution Networks (CDNs) are involved. With CDNs, we expect that different domains hosted on the CDN servers, will yield a higher ED measure, thus designating the CDN as a false anomaly. However, the JI similarity will be higher as well. Thus, the supervised learning algorithm (as described in section VI) with weighted consideration of K-L divergence, Jaccard measure, and Edit distance, yields an accurate analysis where erroneous conclusions due to, say the ED measure, can be compensated by the remaining metrics, such as JI.
TABLE II
SUMMARY OF INTERESTING NETWORKS DISCOVERED THROUGH COMPONENT ANALYSIS
Comp. #Comps. #domains #IPs type Conficker 1 1.9K 19 botnet Helldark 1 28 5 botnet Mjuyh 1 121 1.2K botnet Misspelt 5 215 17 Domains Domain Parking 15 630 15 Adult content 4 349 13 D. Summary
For a larger set of test words, the relative order of efficacy of different measures decreases from JI, to edit distance to K-L distances over bigrams and unigrams. However, interestingly, we observe the exact opposite order when using a small set of
TABLE I
DIFFERENT TYPES OF CLASSES
Type of class # of components # of IP addresses # of domain names Types of components found
Many-to-many 440 11K 35K Legitimate services (Google, Yahoo),
CDNs, Cookie tracking, Mail service, Conficker botnet
IP fans 1.6K 1.6K 44K Domain Parking, Adult content, Blogs,
small websites
Domain fans 930 8.9K 930 CDNs (Akamai), Ebay, Yahoo, Mjuyh
bot-net
TABLE III
DOMAIN NAMES USED BY BOTS
Type of group Domain names Conficker botnet
vddxnvzqjks.ws gcvwknnxz.biz joftvvtvmx.org
Mjuyh bot 935c4fe[0-9a-z]+.6.mjuyh.com
c2d026e[0-9a-z]+.6.mjuyh.com
Helldark Trojan
may.helldark.biz X0R.ircdevils.net www.BALDMANPOWER.ORG
test words. For instance, with 50 test words used for the per-domain analysis, the false positive rates at which we obtain 100% detection rates, are approximately 50% (JI), 20% (ED), 25% (K-L with bigram distribution), and 15% (K-L with unigram distribution). Even though the proof for equation (1) indicates that K-L divergence is an optimal metric for classification, in practice, it does not hold as the proof is based on the assumption that it is equally likely to draw a test distribution from a good or a bad distribution.
VI. DETECTION VIASUPERVISEDLEARNING
As discussed in Section V-D immediately above, the relative merits of each measure vary depending, for instance, on the number of sub-domains present in a domain being tested. In this section, we formulate detection of malicious domains (algorith-mically generated) as a supervised learning problem such that we can combine the benefits afforded by each measure while learning the relative weights of each measure during a training phase. We divide the one-day long trace from the South Asian Tier-1 ISP in to two halves such that the first one of 10 hours duration is used for training. We test the learnt model on the remainder of the trace from South Asian ISP as well as over a different trace from a Tier-1 ISP in South America. In this section, we use the grouping methodology of connected components, where all “domain name, response IP-address” pairs present during a time window (either during training or test phases) are grouped in to connected components.
A. L1-regularized Linear Regression
We formulate the problem of classifying a component as ma-licious (algorithmically generated) or legitimate in a supervised learning setting as a linear regression or classification problem. Linear regression based classifier allows us to attach weights with each feature, making it flexible to analyze the effect of individual features. We first label all domains within the components found in the training data set by querying against domain reputation sites such as McAfee Site Advisor [2] and Web of Trust [7] as
well as by searching for the URLs on search-engines [32]. Next, we label a component as good or bad depending on a simple majority count, i.e., if more than 50% of domains in a component are classified as malicious (malware, spyware, etc.) by any of the reputation engines, then we label that component as malicious.
Define the set of features as F which includes the following metrics computed for each component: KL-distance on unigrams, JI measure on bigrams and Edit distance (thus, |F|= 3). Also
define the set of Training examples asT and its size in terms of number of components as |T|. Further, define the output value for each component yi = 1 if it was labeled malicious or = 0 if legitimate. We model the output value yi for any component
i ∈T as a linear weighted sum of the values attained by each feature where the weights are given byβjfor each featurej∈F:
yi=Pj∈Fβjxj+β0
In particular, we use the LASSO, also known as L1-regularized Linear Regression [18], where an additional constraint on each feature allows us to obtain a model with lower test prediction errors than the non-regularized linear regression since some variables can be adaptively shrunk towards lower values. We use 10-fold cross validation to choose the value of the regularization parameter λ ∈ [0-1] that provides the minimum training error (equation below) and then use that λvalue in our tests:
argmin β |T| X i=1 (yi−β0− X j∈F βjxj)2+λ X j∈F |βj|. (13) B. Results
First, note the various connected components present in the South Asian trace as classified in to three classes: IP fans, Domain fans and Many-to-many components in Table I. During the training phase, while learning the LASSO model, we mark 128 components as good (these consist of CDNs, mail service providers, large networks such as Google) and one component belonging to the Conficker botnet as malicious. For each compo-nent, we compute the features of KL-divergence, Jaccard Index measure and Edit distance. We train the regression model using glmnet tool [18] in statistical package R, and obtain the value for the regularization parameterλas1e−4, that minimizes training error during the training phase. We then test the model on the remaining portion of the one day long trace. In this regard, our goal is to check if our regression model can not only detect Conficker botnet but whether it can also detect other malicious domain groups during the testing phase over the trace. During the testing stage, if a particular component is flagged as suspicious then we check against Web of Trust [7], McAfee Site Advisor [2] as well as via Whois queries, search engines, to ascertain the
exact behavior of the component. Next, we explain the results of each of the classes individually.
On applying our model to the rest of the trace, 29 components (out of a total of 3K components) are classified as malicious, and we find 27 of them to be malicious after cross checking with external sources (Web of Trust, McAfee, etc.) while two components (99 domains) are false positives and comprise of Google and domains belonging to news blogs. Note that here we use a broad definition of malicious domains as those that could be used for any nefarious purposes on the web, i.e., we do not necessarily restrict the definition to only include botnet domain generation algorithm. Out of the 27 components classified as malicious, one of them corresponds to the Conficker botnet, which is expected since our training incorporated features learnt from Conficker. We next provide details on the remaining 26 components that were determined as malicious (see Table II).
Mjuyh Botnet: The most interesting discovery from our
component analysis is that of another Botnet, which we call Mjuyh, since they use the domain name mjuyh.com (see Table III). The fourth-level domain label is generated randomly and is 57 characters long. Each of the 121 domain names belonging to this bot network return 10 different IP addresses on a DNS query for a total of 1.2K IP-addresses. Also, in some replies, there are invalid IP addresses like 0.116.157.148. All the 10 IP addresses returned for a given domain name, belong to different network prefixes. Furthermore, there is no intersection in the network prefixes between the different domain names of the mjuyh bot. We strongly suspect that this is a case of “domain fluxing” along with “IP fast fluxing”, where each bot generated a different randomized query which was resolved to a different set of IP-addresses.
Helldark Trojan: We discovered a component containing
five different third-level domains (a few sample domain names are as shown in Table III) The component comprises of 28 different domain names which were all found to be spreading multiple Trojans. One such Trojan spread by these domains is Win32/Hamweq.CW that spreads via removable drives, such as USB memory sticks. They also have an IRC-based backdoor, which may be used by a remote attacker directing the affected machine to participate in Distributed Denial of Service attacks, or to download and execute arbitrary files [8].
Mis-spelt component: There are about five components
(com-prising 220 domain names) which used tricked (mis-spelt or slightly different spelling) names of reputed domain names. For example, these components use domain names such as uahoo.co.uk to trick users trying to visit yahoo.co.uk (since the alphabet ‘u’ is next to the alphabet ‘y’, they expect users to enter this domain name by mistake). Dizneyland.com is used to misdirect users trying to visit Disneyland.com (which replaces the alphabet ‘s’ with alphabet ‘z’). We still consider these components as malicious since they comprise of domains that exhibit unusual alphanumeric features.
Domain Parking: We found 15 components (630 domain
names) that were being used for domain parking, i.e., a practice where users register for a domain name without actually using it, in which case the registrar’s IP-address is returned as the DNS response. In these 15 components, one belongs to GoDaddy (66 domain names), 13 of them belong to Sedo domain parking (510
domain names) and one component belongs to OpenDNS (57 domain names). Clearly these components represent something abnormal as there are many domains with widely disparate algorithmic features clustered together on account of the same IP-address they are mapped to.
Adult Content: We find four components that comprise of 349
domains primarily used for hosting adult content sites. Clearly this matches the well known fact, that in the world of adult site hosting, the same set of IP-addresses are used to host a vast number of domains, each of which in turn may use very different words in an attempt to drive traffic.
In addition, for comparison purposes, we used the lexical features of the domain names such as the length of the domain names, number of dots and the length of the second-level domain name (for example, xyz.com) for training on the same ISP trace, instead of using the KL-divergence, JI measure and Edit distance measures used in our study. These lexical features were found to be useful in an earlier study in identifying malicious URLs [17]. The model trained on these lexical features correctly labeled four components as malicious (Conficker bot network, three adult content components and one component containing mis-spelt domain names) during the testing phase, but it also resulted in 30 components which were legitimate as being labeled incorrectly; compare this against 27 components that were correctly classified as malicious and two that were false positives on using our alphanumeric features.
We also test our model on a trace obtained from a South America based Tier-1 ISP. This trace is about 20 hours long and is collected on a smaller scale as compared to the ISP trace from Asia. The time lag between the capture of S. American Tier-1 ISP trace and the previously used ISP trace from Asia, is about 15 days. We use the same training set for the prediction model as we use for the ISP trace from Asia. In the prediction stage, we successfully detect the Conficker component with no false positives. The Conficker component has 185 domain names and 10 IP addresses. Of the 10 IP addresses determined for the Conficker component of the South American trace, nine are common with the Asia ISP trace’s Conficker component. We conclude that Conficker based C&C servers have relatively large TTLs. However, out of the 185 domain names only five domains are common from this component and the component from the ISP trace from Asia. Clearly, the Conficker botnet exhibits rapid domain fluxing. Overall, this experiment shows that a training model learnt in one network can successfully detect malicious domain groups when applied to a completely different network.
VII. DISCUSSION
A. Limitations
K-L divergence uses comparison with a good and a bad distribution for distinguishing a test group. However, since our good distribution is based on the publicly available dataset, the attacker may collect such a dataset and modify the DGA to generate the domain names based on the good distribution. The reference comparison with the good database also holds for Jaccard measure computation. However, the edit distance metric does not require comparison with an external reference, rather it evaluates the intra-group entropy, and hence is robust against the above mentioned weakness.