1st CSCE Specialty Conference on Infrastructure Technologies, Management and Policy 1ere conférence spécialisée sur la gestion, les politiques et les technologies des infrastructures
Toronto, Ontario, Canada
June 2-4,2005 / 2-4 juin 2005
AUGMENTED REALITY INTERACTION MODEL FOR MOBILE INFRASTRUCTURE
MANAGEMENT SYSTEMS
A. Hammad¹, B. Khabeer², E. Mozaffari², P. Devarakonda³ and P. Bauchkar³
1. Concordia Institute for Information Systems Engineering, Concordia University, Montreal, QC, Canada 2. Department of Electrical and Computer Engineering, Concordia University, Montreal, QC, Canada 3. Department of Building, Civil & Environmental Engineering, Concordia University, Montreal, QC,
Canada
ABSTRACT: The next generation of mobile infrastructure management systems will allow on-site infrastructure field workers, such as construction superintendents and bridge inspectors, to use mobile and wearable computers to interact with geo-referenced spatial models of the infrastructure and to automatically retrieve the necessary information in real time based on their location, orientation, and the specific task context using Augmented Reality (AR) techniques. AR allows interaction with 3D virtual objects and other types of information superimposed over 3D real objects in real time. The augmentation can be realized by looking at the real world through a transparent head-mounted display equipped with sensors that accurately track head movements to register the virtual objects with the real objects in real time. In these systems, field workers will be able to access and update information related to their tasks in the field with minimum efforts spent on the interaction with the system, which results in increasing their efficiency and potentially, their safety. In this paper, we discuss a new AR interaction model that has been developed especially to suit the requirements of mobile infrastructure management systems. The model is based on automatic picking of the objects of interest and augmenting the 3D real scene with data extracted from a database. The algorithm of the model is explained and implemented in a prototype system for a building construction project.
1. INTRODUCTION
Infrastructure plays a key role in the economic prosperity and the quality of life of a nation. If not maintained, the quality of service of that infrastructure drops due to the effects of deterioration, and in some cases, results in sudden failure and loss of lives. The type and amount of data to be collected during inspection vary according to the specific approach adopted by an infrastructure management agency. Field engineers and technicians working on infrastructure projects need to determine and verify the location of structures and structural elements in order to collect the necessary data. They usually use maps, engineering drawings, databases, and other technical documents for this purpose (Bridge, 1995). Mobile and wearable computers are providing new opportunities to support on-site data collection. However, using these computers in the field under severe working and environmental conditions requires new types of interaction that increase the efficiency and safety of field workers. One promising approach to facilitate hands-free and eyes-free interaction is to use Augmented Reality (AR) techniques. AR allows interaction with 3D virtual objects and other types of information superimposed over 3D real objects in real time (Azuma, 1997; Azuma et al., 2001). The benefits of AR have been discussed in many engineering applications including design perception (Dunston et al., 2002). The augmentation can be realized by looking at the real world using a see-through head-mounted display equipped with sensors that accurately track head movements (3 displacements and 3 rotations) to register the virtual objects with the real objects
in real time. Using AR, field workers do not have to look back and forth at the structure and the computer screen to mentally achieve the spatial mapping of the information displayed on the screen. This helps them to better focus on their actual tasks and improves their efficiency and safety. The main challenge of AR is the requirement for accurate 3D spatial databases and head tracking. For example, if an inspector is looking at a structural element from a distance of 10 m, a 1 m position error will result in about 5 degrees error assuming that the inspector is still and not moving his or her head.
AR has many potential applications as a visualization aid in assembling, maintaining and repairing complex engineered systems. Examples of such AR systems include a laser printer maintenance application (Feiner et al., 1993), X-ray vision that allows seeing the location of reinforcement within a reinforced concrete wall (Webster et al., 1996), and a construction support system for a space frame (Webster et al., 1996). Mobile AR systems are emerging as powerful support tools for field tasks. The “Touring Machine” is an example of such systems that allows users to view information linked to specific buildings of a university campus while walking (Höllerer at al., 1999). Thomas et al. (1998) have demonstrated the use of AR to visualize architectural designs in an outdoor environment.
The first author discussed the concept of a mobile data collection system for engineering field tasks using Location-Based Computing (LBC) and AR (Hammad et al., 2002). The concept of LBC-Infra is to integrate spatial databases, mobile computing, tracking technologies and wireless communications in a computer system that allows infrastructure field workers using mobile and wearable computers to interact with georeferenced spatial models of the infrastructure and to automatically retrieve the necessary information in real time based on their location, orientation, and specific task context. Using LBC-Infra, field workers will be able to access and update information related to their tasks in the field with minimum efforts spent on the interaction with the system, which results in increasing their efficiency and reducing the cost of infrastructure inspection. In addition, the wirelessly distributed nature of LBC will allow field workers to share the collected information and communicate with each other and with personnel at a remote site (office). This feature is of a great value especially in emergency cases. This concept was demonstrated by developing a prototype system called LBC for Infrastructure field tasks or LBC-Infra. In this paper, we discuss a new framework of LBC-Infra that can be used for inspection data collection within facilities management or bridge management systems. This framework considers the general requirements for this type of applications including indoor and outdoor tracking, 3D modelling, interaction patterns and the interaction model. In the subsequent sections, we explore the specific interaction patterns and propose an interaction model for LBC-Infra. Finally, we report on a prototype system that has been developed to test and illustrate the discussed issues.
2. Interaction Components and Patterns of LBC-Infra
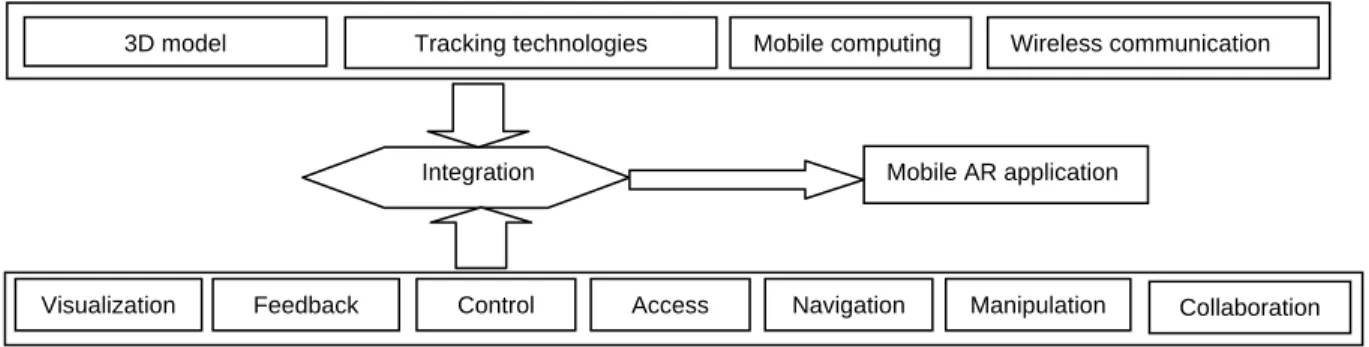
The proposed approach integrates 3D models, tracking technologies, mobile computing and distributed wireless communication in one framework that is based on the following main user interface interaction components (Barrilleaux, 2001): (1) visualization, (2) feedback, (3) Control (4) access, (5) navigation, (6) manipulation, and (7) collaboration (Figure 1).
3D model Tracking technologies Mobile computing Wireless communication
Mobile AR application
Control
Visualization Feedback Access Navigation Manipulation Collaboration Integration
Figure 1. Main components of proposed approach
LBC-Infra aims to facilitate data collection and access in the field by allowing field workers to interact with georeferenced infrastructure models to automatically retrieve the necessary information in real time based on their location and orientation, and the task context. The following interaction patterns are typical
examples that have been identified based on common tasks that field workers usually perform and the type of information they collect (Bridge, 1995).
(1) Visualization and feedback
Displaying graphical details: LBC-Infra displays to the field worker structural details retrieved from previous inspection reports. This can happen in a proactive way based on spatial events, such as the proximity of the inspector to specific elements. For example, once a cracked element is within an inspector field-of-view, the system displays the cracks on that element discovered during previous inspections. This will help focus the inspector’s attention on specific locations. The user of the system can control the level of details of representing objects depending on his or her needs.
Displaying non-graphical information and instructions: The user interface can provide links to documents related to the project, such as reports, regulations and specifications. In addition, LBC-Infra allows for displaying context sensitive instructions on the steps involved in a specific task, such as instructions about the method of checking new cracks, and measuring crack size and crack propagation. (2) Control
LBC-Infra interprets the user input differently depending on the selected feature and the context. For example, clicking the mouse can result in selecting a menu option or in picking an object from the 3D virtual world depending on where the user clicked the mouse. Also, the user can directly control the system by moving. In this case, the system tracks his/her location and updates his/her view point accordingly.
(3) Access
Accessing data in LBC-Infra can be achieved through the real-time location tracking. In fact, the user needs just to walk or move to the object for which information is needed then clicks on it or stands in front of it for a short period of time. Then, relevant data will be retrieved from the database and displayed (more details are given in Section 4)
(4) Navigation
As an extension to conventional navigation systems based on 2D maps, LBC-Infra can also present navigation information in 3D. Within a specific field task, the system can guide a field worker by providing him/her with navigation information and focusing his or her attention on the next element to be inspected. Taking crack inspection as an example, the system displays arrows to navigate the inspector to the locations where cracks are most likely to be found or the locations found in previous inspections. The system intelligently asks the inspector for information about the data to be acquired based on similar previous cases in the database, thus reducing the data collection burden.
In LBC-Infra, the navigation guidance is provided through animated 3D arrows showing the user the path to the object of interest. The arrow goes from the current user location straight to the object. If the user can not take a straight path to the object for any reason, such as obstacles and walls, he/she can take a different way without losing the object because the arrow will be automatically updated to go from his/her new location to the object.
(5) Manipulation
Once an object is found, the inspector can add inspected damages by directly editing their shapes in 3D and manipulating them using a pointing device.
(6) Collaboration
LBC-Infra facilitates the wireless communications among a team of field workers, geographically separated at the project site, by establishing a common spatial reference about the site of the project. In some cases, the field workers may collaborate with an expert engineer stationed at the office who monitors the same scene generated by the mobile unit in the field.
3. Interaction Model
An interaction model is discussed in this section that identifies a collection of high-level reusable software objects and their relationships. The generic structure of this model embodies the general functionalities of
LBC-Infra so that it can be extended and customized to create more specific applications, e.g., a bridge inspection application or a building construction progress monitoring application. Because the LBC-Infra concept integrates several evolving technologies, its implementation should follow an open and extensible framework so that the application development can adapt to new requirements and new technologies while reducing the time and cost of the development.
The Model-View-Controller (MVC) software development model (Potel, 1996) has been selected as the basic framework of LBC-Infra because of its simplicity and flexibility in manipulating complex and dynamic data structures requiring diverse representations. The MVC model has three main high-level objects: Model, View, and Controller. The Model represents the data underlying the application that are accessible only through the View object. The Model of LBC-Infra has three basic databases for managing the spatial data, data about the attributes of the infrastructure (e.g., inspection data), and data about field tasks (e.g., information about inspection tasks, their order, and devices and methods used for performing them). The View object accesses the data from the Model database and specifies how these data are presented to the user, e.g., the information about the members can be used to create the 3D model of the structure. The Controller determines how user interactions with the View, in the form of events, cause the data in the Model to change, e.g., clicking on a “no defect” button causes the value of the “inspection” attribute of the selected member to be set to “no defect” in the attribute database. The Model closes the loop by notifying the View to update itself so that it reflects the changes that occurred in the data. Using the MVC model, new methods of interaction can easily be introduced to the system by developing new View objects. Using the MVC model in distributed client-server applications involves deciding which parts of the model are implemented, in whole or in part, on the client or the server (Potel, 1996). The Model represents typical server-side functionality while the View represents typical client-side functionality. The Controller can be partitioned between the client and the server; most of the processing could be on the client side in a fat client or on the server side with only a simple GUI application on a thin client. In more elaborate architectures, other partitioning of the functionalities between the client and the server are possible, e.g., the client may have a proxy of the Model to lower the demand for communication with the server. In addition to the Model, View and Controller, LBC-Infra has a Tracker object that handles location-related functionalities as explained in the following paragraph.
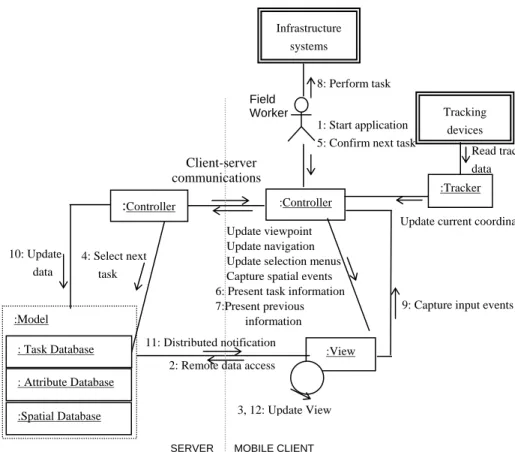
Figure 2 shows the relationship between the high-level objects of LBC-Infra using a Unified Modeling Language (UML) collaboration diagram, where objects interact with each other by sending messages. The numbers in the diagram refer to the order of execution of the messages. Messages that are not numbered are threads that are executed at the beginning of the application and run continuously and concurrently with other messages, or they are event-driven messages that may occur at any time.
A Field Worker starts interacting with the system by sending a message (start application) to the Controller (message 1). As part of the initialization of the system, the View accesses the databases of the Model that reside on a remote server to retrieve the information necessary to create its contents (message 2) before it updates itself (message 3). Once the application is initialized, the Tracker starts continuously reading the location and orientation measurements of the Field Worker from the tracking devices and updating the Controller about the current coordinate of the Field Worker. The Controller retrieves the information about the next task to be performed from the Task Database that contains a plan defining the tasks (message 4). However, the Field Worker has the freedom to confirm this selection or override it by selecting another task if necessary (message 5). Based on the changing coordinates of the Field Worker, the Controller updates the viewpoint of the View, filters the contents of the selection menus, and updates the navigation information towards the best location and orientation to perform the present task. These updating and filtering steps ensure that the presented information coincides with what the Field Worker can see in the real scene. The navigation is performed by presenting visual or audible guidance. As the Field Worker follows the navigation guidance towards the new location, the Controller provides him or her with information about the task (message 6). Another function of the Controller is to capture spatial events, such as the proximity to an element of interest. This flexibility allows switching the order of the tasks when adequate to inspect an element planned for inspection in a subsequent task. As in message 5 above, the Field Worker can accept or reject this change in the task order.
Once the Field Worker is at the right position and orientation to perform the task at hand, the Controller presents him or her with previously collected information (if available) that may help in performing the present task (message 7). At this point, the Field Worker performs the task, e.g., collecting inspection data visually of using some devices (message 8). He or she can input the collected data by interacting with the View, e.g., by clicking on an element displayed within the View for which data have to be updated.The input events are captured by the View (message 9), and used by the Controller to update the data in the Model (message 10). Finally, the changes in the databases are channelled to the View by distributed
notification (message 11) so that the View can update itself (message 12). Client-server communications can happen whenever needed depending on the nature of the client (thin or fat).
8: Perform task
1: Start application 5: Confirm next task
:View :Controller Field Worker 3, 12: Update View Read tracking data :Model 11: Distributed notification 2: Remote data access
9: Capture input events 10: Update data 4: Select next task :Spatial Database : Attribute Database : Task Database Update viewpoint Update navigation Update selection menus Capture spatial events 6: Present task information 7:Present previous
information
Update current coordinates Client-server communications :Tracker :Controller Tracking devices Infrastructure systems
SERVER MOBILE CLIENT
Figure 2. Collaboration Diagram between the Entities of the Framework
4. Automatic Picking Mode
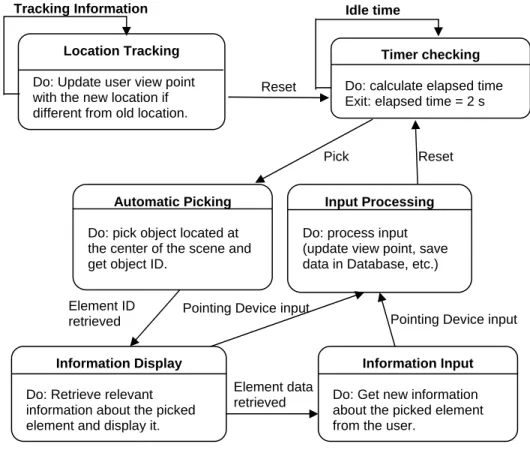
The automatic picking feature allows the field worker to pick an element from the structure just by looking at it continuously for a certain short time (e.g., 2 sec). Once an element is picked, relevant information related to it is retrieved from the database and displayed. The automatic picking process consists of six main operations (Figure 3): (1) Tracking user location: the user location is continuously tracked using GPS or video tracking for outdoor or indoor tracking, respectively. (2) Tracking user input: The user interaction has to be tracked to find out if the system entered in an idle state. To do this, whenever the user moves or generates an event (e.g., using the pointing device) a trigger gets automatically launched then resets the idle time. (3) Computing idle time: The idle time is calculated by comparing the current system time with the last system time when the idle timer was reset. If the idle time is two seconds, then the automatic picking gets launched. (4) Automatic picking: The element that lies at the center of the scene is the one that will be automatically picked. In fact, the picking consists of creating a picking tool, selecting a picking mode, creating a picking shape, picking the closest element, getting the intersection point, and getting the picked element. (5) Displaying relevant information: Based on the ID of the picked element, a connection with the database is established and then a query is generated and executed. The returned data is displayed as a tooltip text (e.g., the inspection and maintenance history). (6) Entering information: Based on the displayed data about the picked element, the user is able to enter inspection and maintenance information; for instance, he/she can specify the location of a defect on the picked element itself, which will automatically create a 3D symbol depicting the defect type on the surface of the element. The newly entered information is saved in the database for future reference.
Input Processing Do: process input (update view point, save data in Database, etc.)
Timer checking Do: calculate elapsed time Exit: elapsed time = 2 s
Automatic Picking Do: pick object located at the center of the scene and get object ID.
Pick Idle time
Reset Location Tracking
Do: Update user view point with the new location if different from old location.
Reset Tracking Information
Information Display Do: Retrieve relevant information about the picked element and display it.
Element ID retrieved
Pointing Device input
Element data retrieved
Information Input Do: Get new information about the picked element from the user.
Pointing Device input
Figure 3. Automatic picking state machine model
5. Tracking Algorithm
Two tracking technologies are investigated: GPS for exterior applications using Trimble 5700 RTK-GPS receiver, and video tracking using ARToolKit for interior applications (Kato, 2004). However, in the rest of this paper, only the preliminary results with video tracking will be discussed.
Video tracking generally depends on modifying the environment with fiducial markers placed in the environment at well-known locations. The ARToolKit has been developed allowing video tracking of markers using a video camera and computer vision algorithm to calculate the camera position and orientation relative to physical markers in real time. Some of the features of ARToolKit are: single camera position/orientation tracking, the ability to use any square marker patterns, easy camera calibration, and tracking speed suitable for real time AR applications. The tracking range can be improved by varying the size of the markers.
The marker absolute location is used to compute the transformation from the world coordinate system to the marker coordinate system (TMW ) as shown in Figure 4. ARToolkit provides the relative position of the
camera with respect to the marker (in the marker coordinate system) through a transformation TUM. These
transformations TUM and TMW are used in computing the user absolute location (camera location) in the
world coordinate system. Thus, the outcome transformation TUW is computed as follows:
[1] TUW = TUM · TMW
Since the coordinates of the objects in our VR model are real, the computed user location is actually the real user location in the real world. Therefore, after hiding the virtual 3D model, the augmentation is easily realized by overlaying the virtual objects on the real world and displaying them on a Head-Mounted Display (HMD).
The marker recognition algorithm (Rekimoto, 1998) used by ARToolkit consists of 5 steps: (1) Binarization: each captured video image is binarized using the adaptive threshold method; (2) Connected component Analysis: the system searches for connected regions of binary-1 (black) pixels. Then, for each region a
heuristic checking is done to select code candidate areas; (3) Code frame fitting: for each region a quad-tangle is fitted on the frame of the region using the least-square method. Then, transformation parameters are computed based on the four corners of this quad-tangle; (4) Decoding and error checking: a corresponding image is projected on the code rectangle space then a CRC-error check is done to get the recognized code ID; and (5) Camera position and pose estimation: the recognized code frame is used to estimate the camera pose. The system allows using multi markers at the same time.
TMW TUW Marker TUM Object yU xU User yM xM yW World xW
Figure 4. Different coordinate systems involved in computing user position
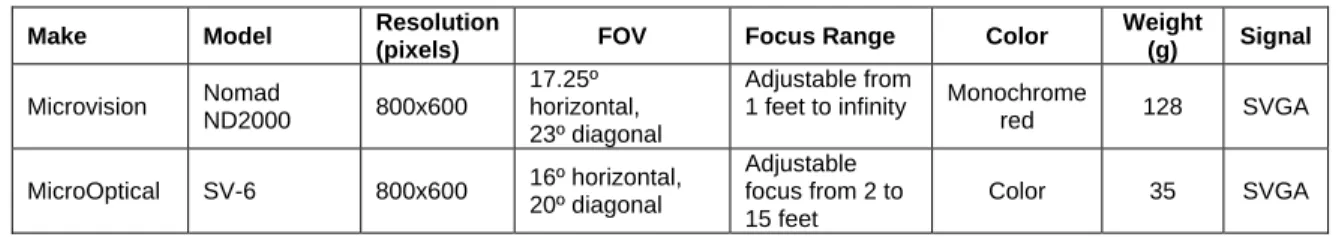
Table 1. Specifications of the head-mounted displays
Make Model Resolution
(pixels) FOV Focus Range Color
Weight (g) Signal Microvision Nomad ND2000 800x600 17.25º horizontal, 23º diagonal Adjustable from
1 feet to infinity Monochrome
red 128 SVGA MicroOptical SV-6 800x600 16º horizontal, 20º diagonal Adjustable focus from 2 to 15 feet Color 35 SVGA
6. Prototype System and Case Study
To demonstrate the feasibility and usefulness of the proposed approach, a prototype system is developed for the case of a building construction project. In order to allow for information sharing on the Internet, Java programming language is used to build the system. Java is a platform-independent and versatile language, enabling developers to create applets that can be downloaded and run within a web browser while interacting with server-side applications. Java 3D is used to implement the 3D graphics of the system (Walsh and Gehinger, 2001). Java 3D is a runtime API for developing portable applications and applets that can run on multiple platforms and multiple display environments.
Java3D has been used to build non-immersive and immersive virtual reality (VR) applications for the desktop and Cave environments, respectively. A VR or AR application must track the user’s head position and orientation to generate an image of the virtual world as if the user’s head was at that position and orientation. Furthermore, the application must continuously integrate the tracker information into the rendering loop. Java3D includes specific features for automatically incorporating head tracker inputs into the image generation process (Henry, 1999). To support head tracking, Java 3D has to provide access to six-degrees-of-freedom (6DOF) tracker information. Instead of trying to support all possible 6DOF input devices, Java 3D defines an InputDevice interface to be used by vendors and developers to support a particular 6DOF device. The Java3D API defines the values returned by 6DOF detectors as primitive Java3D objects called Sensors. Different tracking devices work differently and require different interactions and drivers. The InputDevice interface requires the implementer of a device driver to define several methods (open, close, read, etc.).
The system integrates a 3D model with object-relational database, GIS and tracking components to develop a system that can be used on-site for retrieving and updating information of a certain element by directly interacting with the 3D model. The system is designed to provide a user-friendly interface that can be used in mobile situations with access control to databases including construction, inspection and maintenance records. Users can query the database through the GUI or by picking a specific element, and get the results as visual feedback in the 3D model, e.g., information about the inspection history of an element.
The Java 3D binding of ARToolkit has been used (jARTookit, 2004). When the user launches the video tracking option of the system, the latter checks for the available video camera and loads its parameters in a window so that the user can customize them in terms of video resolution, frame rate, color system, etc. Then, the system starts searching for markers that are visible through the camera. Once a marker is detected, the user location in the virtual world is updated using several transformations as explained in Section 5, and information about the object associated with the marker is loaded and displayed in the 3D scene as augmentation to the scene.
6.1 Hardware used in the test
Two types of web cams were satisfactorily tested with ARToolKit: Logitech QuickCam and IO-Data USB CCD Camera. Two types of head-mounted displays (HMDs) were tested: Microvision Nomad ND2000 (Microvision, 2005) and MicroOptical SV-6 (MicroOptical, 2005). Microvision Nomad ND2000 has a rugged, monochrome red display (32 gray levels) readable in all lighting conditions with automatic brightness adjustment. MicroOptical BV-3 is smaller, less rugged and has color display. Both displays support resolution of 800x600 pixels. Table 1 shows the basic specifications of both displays. After testing these displays under different conditions, it was found that the MicroOptical BV-3 is more suitable for LBC-Infra because of its overall superior visibility using colours. As for the size of the text displayed with the above resolution, it was found that a minimum font size of 25 points is required for comfortable readability. A test has been conducted to check the relationship between the size of a marker and the range to the video camera where the marker can be detected and tracked. These ranges were found to be 7 m and 15 m for markers with edge lengths of 20 cm and 50 cm, respectively. The effects of light conditions on the tracking were also measured. It was found that the camera can detect the marker even under dark lighting conditions. For example, a marker with edge length of 20 cm can be detected under luminance equal to or greater than 4 Lux within the range of 7 m.
6.2 Case study
The 3D virtual model of Concordia University downtown campus was developed using the following data: (1) 3D CAD drawings of the buildings obtained from the FM department of the university; (2) A digital map of the city of Montreal obtained from the municipality of Montreal; and (3) Digital Elevation Model (DEM) of the city obtained from USGS website. This model is used as a test bed for indoor and outdoor mobile AR using video and GPS tracking, respectively. Because of space limitation, in this paper, only the indoor case is discussed. The new building under construction within the downtown campus of the university has been considered as a case study to validate the proposed approach.
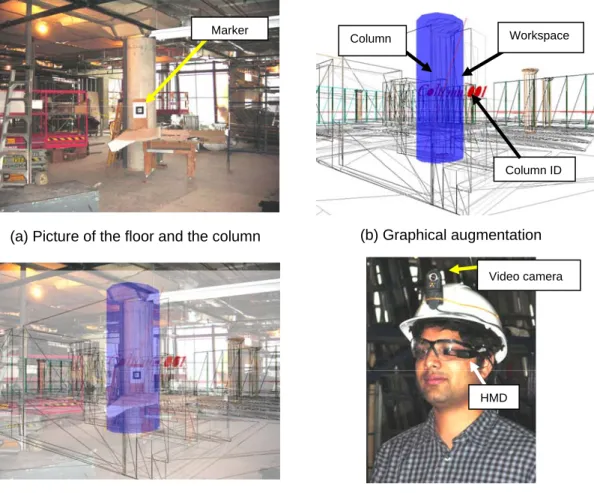
Figure 5 shows an example of the results of the AR application used in the building construction project. Figure 5(a) shows a column on the fifth floor with a marker attached to it with an edge length of 20 cm. Figure 5(b) shows the graphical augmentation with the virtual workspace associated with the column. Figure 5(c) simulates the view that the user sees when the real structure of the column is augmented with the virtual workspace and the ID of the column. Figure 5(d) shows a construction superintendent equipped with the AR devices where he is checking the workspace by viewing it through the HMD.
At this stage, the prototype system successfully integrates the databases of the 3D model and inspection tasks and allows the user to interact with the 3D model to identify the elements of the structure or to retrieve and update the related attributes in the database. User position and orientation are tracked and used to update the 3D view. Furthermore, the tracking information and all interactions with the system can be logged to record the activities of the inspector in the field. This will eventually allow the system to automatically generate a multimedia report of inspection activities and to replay the report in a way similar to replaying a digital movie.
The purpose of the preliminary evaluation of the prototype system at this stage of the development is to demonstrate the feasibility of the proposed concept of LBC-Infra by testing the basic functionalities of the
prototype system. A more formal usability study of the system is planned in the near future after more detailed functionalities are implemented. In the partial testing of the prototype system using the above hardware and software, several problems were identified, e.g., the field of view is too narrow, reading the HMD in the outdoors is rather difficult, etc. Further investigation is needed to identify and test the optimal hardware architecture suitable for the prototype system.
Marker
Column
Column ID Workspace
(d) Construction superintendent equipped with AR devices
(a) Picture of the floor and the column
Figure 5. Example of AR application in building construction (c) Augmentation of the column as
seen by the superintendent
HMD
Video camera
(b) Graphical augmentation
7. CONCLUSIONS
In this paper, we discussed the technologies, requirements, and the framework for Location-Based Computing for Infrastructure field tasks (LBC-Infra). LBC-Infra facilitates collecting inspection data by allowing field workers to interact with georeferenced infrastructure models and automatically retrieve the necessary information in real time based on their location and orientation, and the task context. The framework of LBC-Infra integrates mobile and wearable computers, 3D GIS/CAD databases, positioning technologies and wireless communications to provide field workers with the specific information they need in a proactive manner. The prototype, using video-based or GPS tracking demonstrated the basic functionalities of LBC-Infra, such as tracking, navigation, and interacting with the 3D model to identify elements of the structure or to retrieve and update the related attributes in the database. This is expected to improve the efficiency and safety of the field workers by allowing them to concentrate on their job. Future work will focus on further development and testing of the prototype system, considering both hardware and software issues, and on investigating the usage of LBC-Infra as a base for collaborative environment for field workers.
REFERENCES
Azuma, R.T. (1997). Survey of Augmented Reality, Presence: Teleoperators and Virtual Reality, 6(4), pp. 355-386.
Azuma, R., Baillot, Y., Behringer, R., Feiner, S., Julier, S., MacIntyre, B. (2001). Recent Advances in Augmented Reality, IEEE Computer Graphics and Animation, Nov/Dec, pp. 34-47.
Bridge Inspector’s Training Manual, (1995). U.S. Department of Transportation, Federal Highway Administration.
Barrilleaux J. (2001). 3D User Interface with Java3D, Manning Publications, pp. 41-87.
Dunston, P., Wang, X., Billinghusrt, M., and Hampson, B. (2002). Mixed Reality Benefits for Design Perception. 19th International Symposium on Automation and Robotics Construction (ISARC 2002), NIST, Gaithersburg, MD, pp. 191-196.
Feiner, S., MacIntyre, B. and Sleegmann, D. (1993). Knowledge-Based AR. Communications of ACM, 36:7, pp. 55-62.
Höllerer, T., Feiner, S., Terauchi, T., Rashid, G. and Hallaway, D. (1999). Exploring MARS: Developing Indoor and Outdoor User Interfaces to a Mobile AR System, Computers and Graphics, Elsevier Publishers, 23(6), pp. 779-785.
Hammad, A., Zhang, C., Hu, Y. and Mozaffari, E. (2004). Mobile Model-Based Bridge Lifecycle Management Systems. Proc., Conference on Construction Application of Virtual Reality, ADETTI/ISCTE, Lisbon, pp. 109-120
Hammad, A., Garrett, J.H. and Karimi, H. (2002). Location Based Computing for Infrastructure Field Tasks, in Karimi, H. and Hammad, A. (editors), Telegeoinformatics: Location-Based Computing and Services, CRC Press.
Henry A., Deering, M. F. (1999). IEEE Computer Graphics and Applications archive, Volume 19 , Issue 3, pp. 12-15.
jARTookit - Java Binding for ARToolKit (2004). http://www.c-lab.de/jartoolkit/
Kato, H., Billinghurst, M., Poupyrev, I. (2004). ARToolKit version 2.33: A Software Library for AR Applications, <http://www.hitl.washington.edu/artoolkit/> (accessed December, 2004).
MicroOptical web site (2005). < http://www.microopticalcorp.com/>
Nomad Display Systems (2005). Microvision web site. <http://www.microvision.com>
Potel, M. (1996). MVP: Model-View-Presenter, The Taligent Programming Model for C++ and Java, <ftp://www6.software.ibm.com/software/developer/library/mvp.pdf>
Rekimoto, J. (1998). Matrix: A Realtime Object Identification and Registration Method for Augmented Reality, Proc. of Asia Pacific Computer Human Interaction (APCHI '98).
Thomas, B., Piekarski, W. and Gunther, B. (1998). Using AR to Visualize Architectural Designs in an Outdoor Environment, DCNet'98 Online Conference,
<http://www.arch.usyd.edu.au/kcdc/journal/vol2/dcnet/sub8> (accessed February, 2005). Walsh, A. and Gehinger, D. (2001). Java 3D API Jump-Start, Prentice Hall PTR, 1st edition.
Webster, A., Feiner, S., MacIntyre, B., Massie, W., and Krueger, T. (1996). AR in architectural construction, inspection and renovation, Proc. of ASCE Third Congress on Computing in Civil Engineering, Anaheim, CA, pp. 913-919.