Imperial College London
Department of Electrical and Electronic Engineering
Low-complexity algorithms for automatic
detection of sleep stages and events for
use in wearable EEG systems
Syed Anas Imtiaz
December 2015
Supervised by Prof. Esther Rodriguez-Villegas
Submitted in part fulfilment of the requirements for the degree of
Doctor of Philosophy in Electrical and Electronic Engineering of Imperial College London and the Diploma of Imperial College London
Abstract
Objective: Diagnosis of sleep disorders is an expensive procedure that requires per-forming a sleep study, known as polysomnography (PSG), in a controlled environment. This study monitors the neural, eye and muscle activity of a patient using electroen-cephalogram (EEG), electrooculogram (EOG) and electromyogram (EMG) signals which are then scored in to different sleep stages. Home PSG is often cited as an alternative of clinical PSG to make it more accessible, however it still requires patients to use a cumbersome system with multiple recording channels that need to be precisely placed. This thesis proposes a wearable sleep staging system using a single channel of EEG. For realisation of such a system, this thesis presents novel features for REM sleep de-tection from EEG (normally detected using EMG/EOG), a low-complexity automatic sleep staging algorithm using a single EEG channel and its complete integrated circuit implementation.
Methods: The difference between Spectral Edge Frequencies (SEF) at 95% and 50% in the 8-16 Hz frequency band is shown to have high discriminatory ability for detecting REM sleep stages. This feature, together with other spectral features from single-channel EEG are used with a set of decision trees controlled by a state machine for classification. The hardware for the complete algorithm is designed using low-power techniques and implemented on chip using 0.18µm process node technology.
Results: The use of SEF features from one channel of EEG resulted in 83% of REM sleep epochs being correctly detected. The automatic sleep staging algorithm, based on contextually aware decision trees, resulted in an accuracy of up to 79% on a large dataset. Its hardware implementation, which is also the very first complete circuit-level implementation of any sleep staging algorithm, resulted in an accuracy of 98.7% with great potential for use in fully wearable sleep systems.
Contents
Abstract 2 List of Figures 8 List of Tables 12 List of Publications 14 Acknowledgements 16 Declaration of Originality 17 Copyright Declaration 18Terms and Abbreviations 19
1 Introduction 22
1.1 Overview . . . 22
1.2 Thesis structure . . . 24
2 Sleep: What is it, why is it important and how is it monitored? 28 2.1 Introduction . . . 28
2.1.1 Sleep disorders . . . 29
2.1.2 Types of sleep studies . . . 29
2.2 Polysomnography . . . 31
2.2.1 EEG . . . 33
2.2.2 EOG . . . 33
2.2.3 EMG . . . 34
2.3 Sleep staging rules . . . 34
2.3.1 R&K rules of sleep staging . . . 34
2.3.2 AASM rules of sleep staging . . . 35
2.3.3 Limitations and drawbacks of PSG . . . 36
2.4 Literature review of automatic sleep staging algorithms . . . 38
2.4.1 Validation of commercial sleep staging softwares and systems . . . 50
2.5 Review of commercial sleep scoring systems . . . 52
2.5.2 PSG systems . . . 54
2.5.3 Sleep scoring softwares . . . 58
2.5.4 Conclusions . . . 59
2.6 Proposed solution and challenges . . . 60
2.6.1 Challenges of the proposed approach . . . 62
2.7 Conclusion . . . 64
References . . . 64
3 Performance assessment of automatic sleep staging algorithms 76 3.1 Introduction . . . 76
3.2 Polysomnography databases . . . 77
3.2.1 PhysioNet Sleep EDF Database . . . 78
3.2.2 PhysioNet Sleep EDF Expanded Database . . . 78
3.2.3 DREAMS Subjects Database . . . 78
3.2.4 DREAMS Patients Database . . . 78
3.2.5 Montreal Archive of Sleep Studies . . . 78
3.3 Recommendations for using PSG databases . . . 78
3.3.1 Classification: AASM and R&K . . . 79
3.3.2 Epoch size and signal duration . . . 80
3.3.3 Selecting data from long term recordings . . . 80
3.3.4 Training and test set . . . 81
3.3.5 Unscored epochs . . . 81
3.3.6 Channels . . . 81
3.4 Performance metrics . . . 81
3.5 Demonstration of the performance assessment recommendations using a sleep staging algorithm . . . 83
3.5.1 Case 1: Using DREAMS Subjects Database . . . 83
3.5.2 Case 2: Using Sleep-EDF Database . . . 84
3.5.3 Case 3: Using Sleep-EDF Database with different training and test set . . . 85
3.6 Discussion . . . 86
References . . . 87
4 REM sleep detection using single channel EEG 89 4.1 Introduction . . . 89
4.2 Literature review of REM detection algorithms . . . 90
4.3 Material . . . 93
4.4 Methodology . . . 94
4.4.1 Frequency range of analysis . . . 94
4.4.3 Quantifying the discriminatory power ofSEFd . . . 101
4.4.4 Channel selection . . . 105
4.4.5 Further features . . . 106
4.5 REM detection algorithm . . . 110
4.5.1 Overview . . . 110
4.5.2 Establishing the threshold values . . . 110
4.6 Results . . . 113
4.6.1 Performance metrics . . . 113
4.6.2 Training data results . . . 113
4.6.3 Test data results . . . 114
4.6.4 Performance comparison . . . 122
4.7 Discussion . . . 123
References . . . 125
5 Automatic sleep staging using state machine-controlled decision trees 130 5.1 Introduction . . . 130
5.2 Material and methods . . . 131
5.2.1 Database . . . 131
5.2.2 Features . . . 132
5.3 Sleep staging algorithm . . . 134
5.4 Design of decision trees . . . 137
5.4.1 Core tests . . . 138
5.4.2 Peripheral tests . . . 145
5.4.3 Final set of features . . . 149
5.5 Results . . . 150
5.6 Discussion . . . 151
References . . . 153
6 Integrated circuit design and implementation of an automatic sleep staging algorithm 155 6.1 Introduction . . . 155
6.2 Input Controller . . . 155
6.3 Fast Fourier Transform . . . 157
6.3.1 Overview . . . 157
6.3.2 Data Input & Bit Reversal . . . 160
6.3.3 Register Banks . . . 163
6.3.4 Address Generator . . . 164
6.3.5 Fetch Data . . . 164
6.3.6 Twiddle Generator . . . 166
6.3.8 Save Data . . . 171
6.3.9 Save Magnitudes . . . 172
6.3.10 Valid Out and Subepoch Address . . . 173
6.4 Feature Calculation . . . 173
6.4.1 Power calculation . . . 174
6.4.2 Spectral edge frequency calculation . . . 174
6.4.3 Data validity . . . 176
6.4.4 Block level implementation . . . 176
6.5 Classifier . . . 180
6.5.1 Design of each test . . . 181
6.5.2 Further optimisations . . . 182
6.5.3 Block level implementation . . . 183
6.6 Top level system . . . 183
6.7 RTL simulation . . . 185
6.8 Synthesis . . . 189
6.9 Formal verification . . . 189
6.9.1 Logic equivalence check . . . 190
6.9.2 Gate-level simulation . . . 190
6.10 Place and route . . . 190
6.11 Discussion . . . 191 References . . . 193 7 Conclusions 195 7.1 Contributions . . . 195 7.2 Further work . . . 197 Appendices 198 A Databases 199 A.1 PhysioNet Sleep EDF Database . . . 199
A.2 PhysioNet Sleep EDF Expanded Database . . . 200
A.3 DREAMS Subjects Database . . . 202
A.4 DREAMS Patients Database . . . 203
A.5 Montreal Archive of Sleep Studies . . . 204
References . . . 204
B An open-source toolbox for standardised use of PhysioNet sleep EDF expanded database 205 B.1 Introduction . . . 205
B.2 Getting the data . . . 206
B.2.2 Conversion to Matlabformat . . . 206
B.2.3 Downloading and processing annotations . . . 207
B.3 Using the data . . . 208
B.3.1 Performance evaluation . . . 210
B.4 Discussion . . . 210
References . . . 211
C Automatic detection of sleep spindles 213 C.1 Introduction . . . 213
C.2 Literature review of spindle detection algorithms . . . 215
C.3 Issues with automatic spindle detection . . . 218
C.3.1 Frequency range of spindles . . . 218
C.3.2 Amplitude . . . 218 C.3.3 Performance metrics . . . 218 C.3.4 Alpha rhythms . . . 218 C.3.5 Complexity . . . 219 C.4 Material . . . 219 C.5 Performance metrics . . . 220
C.6 Spindle detection: Algorithm I . . . 221
C.6.1 Methods . . . 221
C.6.2 Algorithm . . . 222
C.6.3 Results . . . 224
C.7 Spindle detection: Algorithm II . . . 227
C.7.1 Methods . . . 227 C.7.2 Algorithm . . . 227 C.7.3 Hardware implementation . . . 228 C.7.4 Results . . . 230 C.7.5 Power consumption . . . 231 C.8 Discussion . . . 231 References . . . 232
D Compression in wearable sensor nodes for data transmission and stor-age 236 D.1 Introduction . . . 236
D.2 Sensor platforms . . . 238
D.2.1 Hardware set up . . . 238
D.2.2 Wireless nodes . . . 238
D.2.3 Local memory nodes . . . 240
D.2.4 Compression design . . . 241
D.3 Analysis methods . . . 242
D.4 System performances . . . 243
D.4.1 Reconstruction accuracy . . . 243
D.4.2 Comparison to floating point . . . 246
D.4.3 Peak current consumption . . . 246
D.4.4 Average continuous current draw . . . 248
D.4.5 Relative current consumptions . . . 251
D.5 Discussion . . . 253
List of Figures
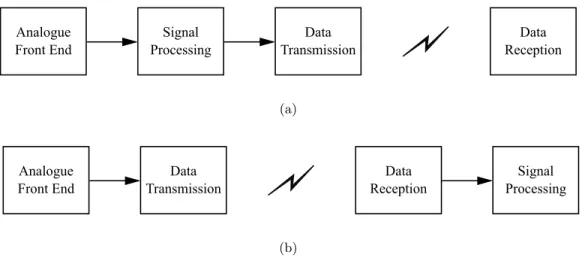
1.1 The two system design approaches for a wireless wearable device: (a) with signal processing at the sensor node; (b) with signal processing at the
receiver end. . . 23
2.1 Types of PSG and their application . . . 30
2.2 Illustration of a patient with sensors attached for PSG . . . 31
2.3 A typical set of PSG analysis waveforms . . . 32
2.4 EEG electrode placement according to 10-20 system . . . 33
2.5 Electrode placement configurations for EOG recording . . . 34
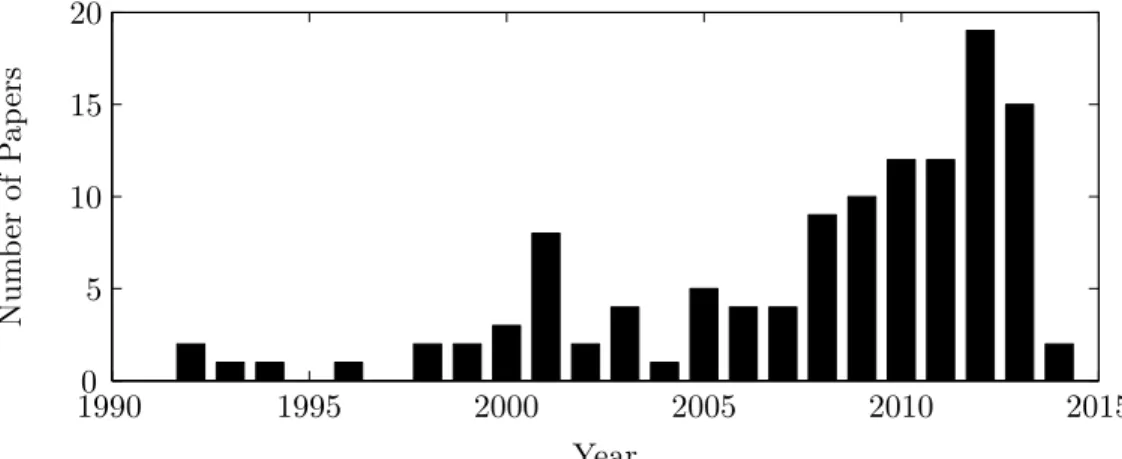
3.1 Number of papers published in IEEEXplore over the last 25 years related to automatic sleep staging algorithms. . . 77
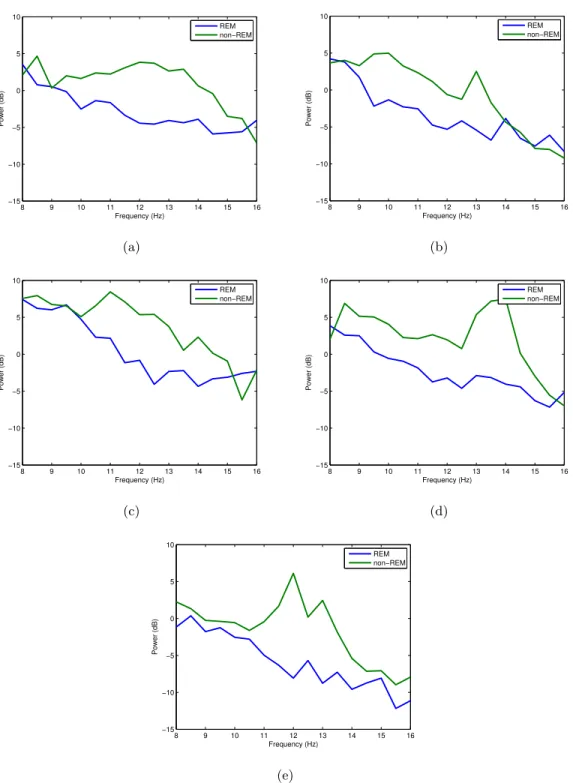
4.1 Frequency spectrum of REM and non-REM epochs in 8-16 Hz range for different training subjects 01-05 on plots (a)-(e). . . 95
4.2 An illustration of Spectral Edge Frequency (SEF) at 50% and 95% of the signal power in the 0-20 Hz frequency range. . . 96
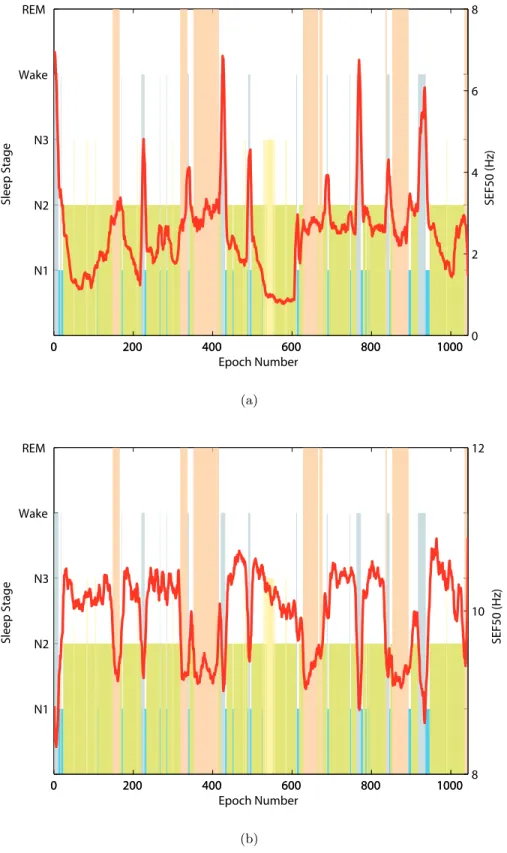
4.3 Hypnogram and SEF50 in the (a) 0.5-50 Hz and (b) 8-16 Hz band of the EEG signal for one training subject. . . 97
4.4 Hypnogram and SEF95 in the (a) 0.5-50 Hz and (b) 8-16 Hz band of the EEG signal for one training subject. . . 99
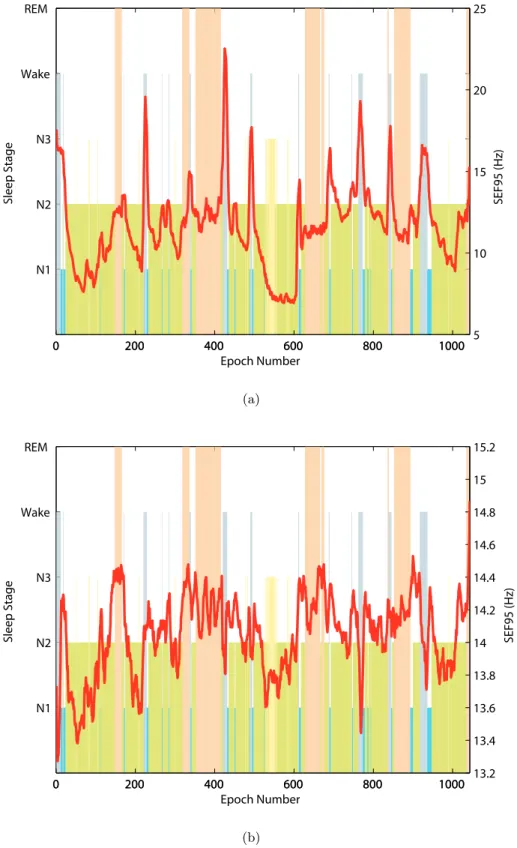
4.5 Hypnogram and SEFd in the (a) 0.5-50 Hz and (b) 8-16 Hz band of the EEG signal for one training subject. . . 100
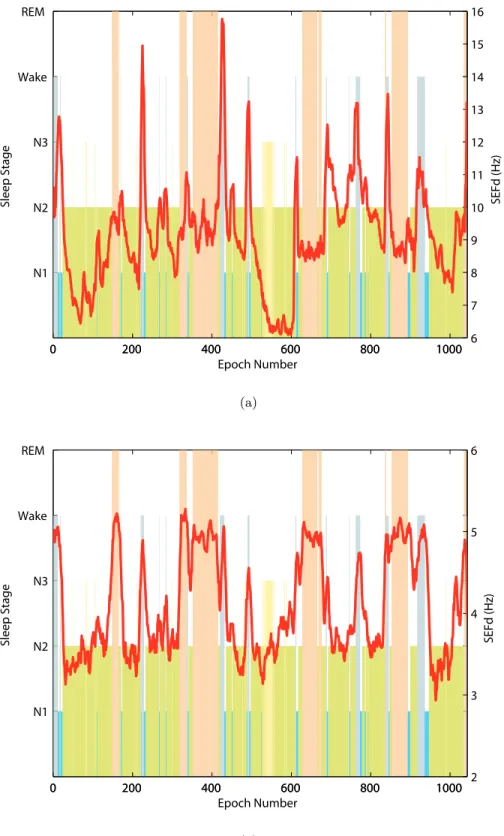
4.6 Hypnogram and SEFd in the 8-16 Hz band of the EEG signal for training subjects 01-05 on plots (a)-(e) respectively. The plots show clear peaks during all the REM phases for every case. . . 102
4.7 An illustration of ideal, example and worst-case ROC curves. . . 104
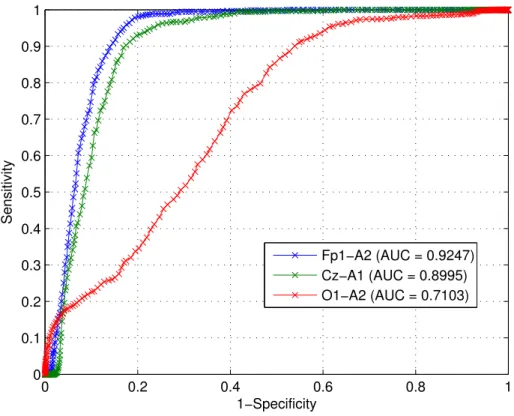
4.8 ROC Curves and AUC for three EEG channels using SEFd feature from the training dataset. . . 105
4.9 Frequency distribution of SEFd values at different sleep stages across all training subjects. . . 107
4.10 Hypnogram and AP in the 8-16 Hz band of the EEG signal forSubject01. AP values can be seen to be lowest during each REM phase. . . 108
4.11 Hypnogram and RP in the 8-16 Hz band of the EEG signal forSubject01.
RP values can be seen to be stable around -8 dB mark. . . 109
4.12 Block diagram of the REM detection algorithm. . . 111
5.1 Core decision tree to discriminate between Wake and other sleep stages. . 140
5.2 Core decision tree to discriminate between N1 and other sleep stages. . . 141
5.3 Core decision tree to discriminate between N2 and other sleep stages. . . 142
5.4 Core decision tree to discriminate between N3 and other sleep stages. . . 143
5.5 Core decision tree to discriminate between REM and other sleep stages. . 144
5.6 Peripheral decision tree to discriminate between Wake and N1 sleep stages. 145 5.7 Peripheral decision tree to discriminate between Wake and N2 sleep stages. 146 5.8 Peripheral decision tree to discriminate between Wake and N3 sleep stages. 146 5.9 Peripheral decision tree to discriminate between Wake and REM sleep stages.147 5.10 Peripheral decision tree to discriminate between N1 and N2 sleep stages. . 147
5.11 Peripheral decision tree to discriminate between N1 and N3 sleep stages. . 148
5.12 Peripheral decision tree to discriminate between N1 and REM sleep stages. 148 5.13 Peripheral decision tree to discriminate between N2 and N3 sleep stages. . 148
5.14 Peripheral decision tree to discriminate between N2 and REM sleep stages. 149 5.15 Peripheral decision tree to discriminate between N3 and REM sleep stages. 149 6.1 Block diagram of the Input Controller. . . 156
6.2 8-point radix-2 Decimation in Time FFT algorithm. . . 158
6.3 RMS error with respect to the number of fractional bits in a fixed-point number. . . 160
6.4 Top level diagram of the FFT block. . . 161
6.5 Block diagram of the Data Input & Bit Reversal module. . . 162
6.6 Block diagram of the FFT Address Generator module. . . 165
6.7 Block diagram of the FFT Fetch Data module. . . 165
6.8 Block diagram of the FFT Twiddle Generator module. . . 168
6.9 A radix-2 butterfly operation with complex inputs A and B with twiddle factor ω. . . 169
6.10 Block diagram of the complex multiplier. . . 170
6.11 Block diagram of the complex adder/subtractor. . . 170
6.12 Block diagram of the FFT Butterfly module. . . 171
6.13 Block diagram of the FFT Save Data module. . . 171
6.14 Block diagram of the FFT Save Magnitudes module. . . 173
6.15 Block diagram of the Power calculation module. . . 175
6.16 Block diagram of the logic to check input data validity and prevent recal-culation of the features for same inputs. . . 176
6.18 Mathematical operation at one node of the decision tree. . . 182
6.19 An example decision tree to illustrate its multi-cycle operation. . . 182
6.20 Top level block diagram of the Classifier. . . 184
6.21 Top level block diagram of the complete sleep staging system. . . 186
6.22 RTL Compiler report summary of the gates used in the netlist. . . 189
6.23 RTL Compiler report summary of the datapath modules used in the netlist.189 6.24 Conformal LEC report summary for formal verification of the synthesised netlist. . . 190
6.25 Final layout of the automatic sleep staging algorithm integrated circuit measuring 2890µm× 2890µm. . . 192
B.1 An example section of hypnogram annotations from the recording SC4001E0207 C.1 A typical sleep spindle (between dashed lines) . . . 213
C.2 Block diagram of sleep spindle detection Algorithm I . . . 223
C.3 (a) EEG input with three spindles marked between vertical lines; (b) 11-16 Hz filtering output; (c) TEO output showing high activity in the spindle areas; (d) detected candidate spindles; (e) SEF50 for each epoch in the candidate spindle zone; (f) correctly detected spindles (removing one false candidate spindle) . . . 225
C.4 (a) EEG signal with two sleep spindles marked between vertical lines; (b) Line length of the EEG signal showing higher values during spindle occurrence . . . 228
C.5 Block diagram of sleep spindle detection Algorithm II . . . 229
D.1 Physical set up of the prototype sensor nodes with the four different back-ends. (a) Nordic transmitter; (b) CC430 transmitter; (c) microSD card; (d) NAND flash memory chip. . . 239
D.2 Reconstruction performance of the fixed point compressive sensing scheme as the compression ratio (CR) is varied. Values for the median, minimum and maximum RMS error values found from analysing 30 minutes of EEG data are shown. Results are arranged for each EEG channel as they are located on the head, and generated using frame size N = 200. . . 244
D.3 Reconstruction performance of the fixed point compressive sensing scheme in channel Cz using four different frame sizes (N). Each vertical line plots the median, minimum and maximum RMS error found from analysing 30 minutes of EEG data. (a) against the compression ratio (CR); (b) against the number of compressed samples (M). . . 245
D.4 Difference in the RMS reconstruction errors between the fixed point MSP430 suitable and fully floating point compressive sensing implementations for different frame sizes (N). (a) in channel Cz; (b) in channel O2. . . 247
D.5 Current measured during a compress, transmit/store, idle cycle of the sensor node for M = 50, N = 100. Only a portion of the compressive sensing period is shown. Actual duration is 31 ms (for 16 channels) and the remainder of the cycle is spent in the idle state. (a) Nordic transmitter; (b) CC430 transmitter; (c) microSD card; (d) NAND flash memory chip. . 249 D.6 Average continuous current draw for the three sensor nodes. Horizontal
lines show the current consumption in the direct sampling cases when no compressive sensing is used and all data is passed to the back-end. (a) Nordic transmitter; (b) CC430 transmitter; (c) microSD card; (d) NAND flash memory chip. . . 250 D.7 Break-down of the current consumptions from Figure D.6 showing the
percentage of the total consumption used in each of the main stages of operation. (a) Nordic transmitter; (b) CC430 transmitter; (c) microSD card; (d) NAND flash memory chip. . . 252
List of Tables
3.1 Conversion from R&K to AASM classification . . . 80
3.2 Case 1: Results using DREAMS Subjects Database . . . 84
3.3 Case 2: Results using PhysioNet Sleep EDF Database . . . 85
3.4 Case 3: Results using PhysioNet Sleep EDF Database with a different training and test set . . . 85
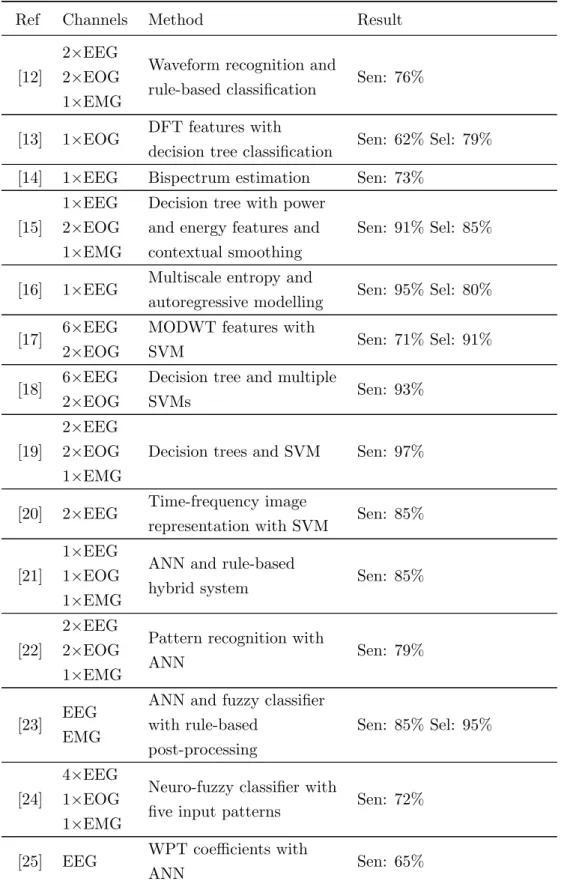
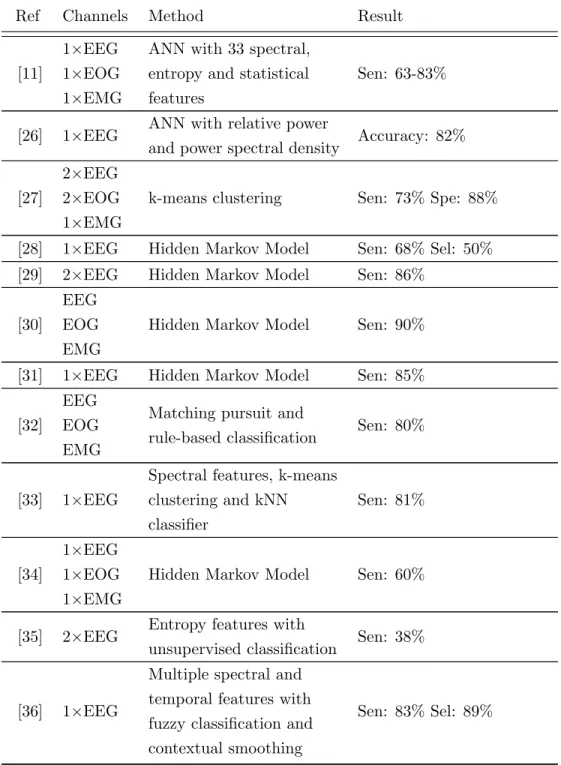
4.1 Literature review summary for automatic REM stage detection as part of sleep staging algorithms. . . 91
4.2 The number of Wake, REM and NREM epochs in training and test datasets. 93 4.3 AUC values for the three features in different frequency ranges. . . 104
4.4 AUC values for all training subjects using the three EEG channels. . . 106
4.5 Best performing thresholds for SEFd, AP and RP. . . 112
4.6 Standard deviation of the three features in different sleep stages. . . 112
4.7 Performance of algorithm on training database. . . 114
4.8 Performance of algorithm on test database. . . 115
4.9 Algorithm performance analysis at output of first and second stages. . . . 115
4.10 Breakdown of all false detections in test database. . . 117
4.11 Level of agreement (Cohen’s kappa values) when using different sleep stages117 4.12 Performance of algorithm on test database using patient-specific thresholds.118 4.13 Comparison of results when using fixed versus patient-specific thresholds. 118 4.14 Breakdown of all false detections in test database using patient-specific thresholds. . . 119
4.15 Mean, median and standard deviation of the patient-specific thresholds. . 120
4.16 Comparison of fixed versus patient-specific SEFd thresholds in Subject14 120 4.17 Number of misclassified N2 epochs using fixed and patient-specific thresh-olds. . . 121
4.18 Number of misclassified Wake epochs using fixed and patient-specific thresh-olds. . . 121
4.19 Performance comparison with other single-channel EEG methods that have been evaluated using PhysioNet Sleep-EDF Database. . . 123
5.1 EEG frequency bands and their range. . . 132 5.2 Initial list of the most relevant features for use in the sleep staging algorithm.133
5.3 Final list of the most relevant features for use in the sleep staging algorithm.150
5.4 Algorithm performance using the training data set . . . 151
5.5 Algorithm performance using the test data set . . . 151
6.1 Bit reversal examples for 512-point FFT. . . 163
6.2 Twiddle factors during each cycle and level of a 16-point FFT. . . 166
6.3 Twiddle factors during each cycle and level of a 16-point FFT revised to have the same denominator. . . 167
6.4 Twiddle factor values for a 16-point FFT. . . 168
6.5 Multiplier and comparator inputs in each clock cycle. . . 183
6.6 Encoding of the output from the classifier block. . . 185
6.7 RTL simulation results of the sleep staging algorithm hardware. . . 188
A.1 Detail of the recordings in PhysioNet Sleep EDF Database. . . 199
A.2 Detail of the recordings in PhysioNet Sleep EDF Expanded Database. . . 200
A.3 Detail of the recordings in DREAMS Subjects Database. . . 202
A.4 Detail of the recordings in DREAMS Patients Database. . . 203
B.1 Conversion from R&K to AASM classification . . . 209
C.1 Literature review summary for automatic sleep spindle detection. . . 216
C.2 Percentage of sleep stages in test data . . . 219
C.3 Sleep spindles in each stage of the test data . . . 220
C.4 Performance of spindle detection using TEO (Algorithm I) . . . 224
C.5 Spindle detection performance of Algorithm I . . . 226
C.6 Sleep Spindles (SS) detected in each sleep stage - Algorithm I . . . 226
C.7 Spindle detection performance of Algorithm II . . . 230
C.8 Sleep Spindles (SS) detected in each sleep stage - Algorithm II . . . 231
C.9 Comparison of this work with other sleep spindle detection algorithms . . 232
D.1 Peak currents and their duration for the MSP430 compressive sensing and for the complete system with four different back-ends. . . 248
List of Publications
The following papers have been published as part of this work. Journal papers
• S. A. Imtiaz and E. Rodriguez-Villegas, “A Low Computational Cost Algorithm for REM Sleep Detection Using Single Channel EEG,” Annals of Biomedical En-gineering, vol. 42, no. 11, pp. 2344–2359, 2014.
• S. A. Imtiaz, A. J. Casson and E. Rodriguez-Villegas, “Compression in Wearable Sensor Nodes: Impacts of Node Topology,” IEEE Transactions on Biomedical En-gineering, vol. 61, no. 4, pp. 1080–1090, 2014.
• S. A. Imtiaz, L. Logesparan and E. Rodriguez-Villegas, “Performance-Power Con-sumption Tradeoff in Wearable Epilepsy Monitoring Systems,” IEEE Journal of Biomedical and Health Informatics, vol. 19, no. 3, pp. 1019–1028, 2014.
• G. Chen, S. A. Imtiaz, E. AguilarPelaez and E. Rodriguez-Villegas, “Algorithm for heart rate extraction in a novel wearable acoustic sensor,” IET Healthcare Technology Letters, vol. 2, no. 1, pp. 28–33, 2015.
Peer reviewed conference papers
• S. A. Imtiaz and E. Rodriguez-Villegas, “Automatic sleep staging using state machine– controlled decision trees,” in proceedings of the 37thinternational conference of the IEEE Engineering in Medicine and Biology Society, Milan, August 2015.
• S. A. Imtiaz and E. Rodriguez-Villegas, “An open–source toolbox for standardized use of PhysioNet Sleep EDF Expanded database,” in proceedings of the 37th in-ternational conference of the IEEE Engineering in Medicine and Biology Society, Milan, August 2015.
• S. A. Imtiaz and E. Rodriguez-Villegas, “Recommendations for performance as-sessment of automatic sleep staging algorithms,” in proceedings of the 36th in-ternational conference of the IEEE Engineering in Medicine and Biology Society, Chicago, August 2014, pp. 5044–5047.
• S. A. Imtiaz and E. Rodriguez-Villegas, “Evaluating the use of line length for auto-matic sleep spindle detection,” in proceedings of the 36th international conference of the IEEE Engineering in Medicine and Biology Society, Chicago, August 2014, pp. 5024–5027.
• S. A. Imtiaz, S. Saremi-Yarahmadi and E. Rodriguez-Villegas, “Automatic detec-tion of sleep spindles using Teager energy and spectral edge frequency,” in proceed-ings of the IEEE Biomedical Circuits and Systems Conference (BioCAS), Rotter-dam, October 2013, pp. 262–265.
• L. Logesparan, A. J. Casson, S. A. Imtiaz and E. Rodriguez-Villegas, “Discrimi-nating between best performing features for seizure detection and data selection,” in proceedings of the 35th international conference of the IEEE Engineering in Medicine and Biology Society, Osaka, July 2013, pp. 1692–1695.
• L. Logesparan, S. A. Imtiaz, A. J. Casson and E. Rodriguez-Villegas, “A 1.8mW 12-channel wireless seizure detector for miniaturized portable EEG systems,” in pro-ceedings of the 9thinternational conference on ubiquitous healthcare (u-Healthcare 2012), GyeongJu, October 2012.
Acknowledgements
I would like to extend my sincerest gratitude to my supervisor, Prof. Esther Rodriguez-Villegas, for giving me the opportunity and motivating me to pursue this research. Esther has not only been an amazing supervisor but also a great mentor and friend. I am thankful to her for encouraging my research, giving me the freedom and space to pursue my ideas and allowing me to grow as a researcher. I also appreciate all her contributions of time, ideas, and funding to make my PhD experience productive and stimulating.
I consider myself lucky to be working with a team of very talented individuals in the lab. I am thankful to everyone including Sorsby, Saam, Zhou, George, Majd, Stuart, Ruchir, Mohammad and Valentin for helping me with everything I ever needed, for the countless hours we have spent together near deadlines and for all the quality entertainment during lunch and coffee breaks. It has been a great pleasure working with all of you guys.
I owe special thanks to Alex Casson for being super helpful during the first two years of my PhD assisting me in almost all aspects of my work. I would also like to acknowledge the support of all the former members of the lab including Lojini, Eduardo, Siavash and James who have helped me throughout the course of my research in multiple ways. I am also very grateful to my two best friends at Imperial, Asif and Saad, for all the great times outside the lab. And, of course, I am very thankful to Wiesia for all the administrative support she has provided.
Above all, I am forever indebted to my parents for everything they have done for me. Words can not express how grateful I am to my father and mother for all of the sacrifices that they have made for me. This PhD would never have started without their encouragement. Their unwavering support and trust means the world to me. A mere mention of thanks can never do justice to the level of support they have provided. I would also like to thank my sister and brother-in-law for their support as well as my dearest nieces for cheering me up. I am also thankful to my grandmother, extended family and in-laws for their encouragement, support and prayers.
A very special thanks to my loving, supportive, encouraging and patient wife, Quratu-lain, who has been by my side throughout this PhD, living every single minute of it and providing unequivocal support.
Finally, and most importantly, I am thankful to God for letting me through all the difficulties and making things happen the way they are today.
Declaration of Originality
I hereby confirm that the work presented here is my own, and that appropriate references have been used to denote the work of others.
Syed Anas Imtiaz December, 2015.
Copyright Declaration
The copyright of this thesis rests with the author and is made available under a Creative Commons Attribution Non-Commercial No Derivatives licence. Researchers are free to copy, distribute or transmit the thesis on the condition that they attribute it, that they do not use it for commercial purposes and that they do not alter, transform or build upon it. For any reuse or distribution, researchers must make clear to others the licence terms of this work.
Terms and Abbreviations
Term Meaning
AASM Americal Academy of Sleep Medicine ADC Analogue to Digital Converter
AFE Analogue Front End
alpha 8-13 Hz frequency band ANN Artifical Neural Network
AP Absolute Power
AR Autoregressive
ASIC Application Specific Integrated Circuit
AUC Area Under the Curve
Automatic sleep
staging algorithm An algorithm for detecting sleep stages from PSG recordings beta 16-30 Hz frequency band
BIS Bispectral Index
BLE Bluetooth Low Energy
CNS Central Nervous System
CR Compression Ratio
CRC Cyclic Redundancy Check
CWD Choi-Williams Distribution CWT Continuous Wavelet Transform
DBN Deep Belief Network
delta 0.5-4 Hz frequency band DFT Discrete Fourier Transform
DIT Decimation In Time
ECG Electrocardiogram / Electrocardiography
EDF European Data Format
EEG Electroencephalogram / Electroencephalography EMD Empirical Mode Decomposition
EMG Electromyogram / Eletromyography EOG Electrooculogram / Electrooculography
Term Meaning
FN False Negatives
FNN Feedforward Neural Network
FP False Positives
FSM Finite State Machine
GMM Gaussian Mixture Model
GP General Physician
HHT Hilbert Huang Transform
HMM Hidden Markov Model
HPSG Home Polysomnography
hypnogram Result of polysomnography showing different stages of sleep
IC Integrated Circuit
K-complex An isolated sharp negative wave followed by a postive component KLR Kernel Logistic Regression
kNN k-Nearest Neighbour
LAN Local Area Network
LDA Linear Discriminant Analysis LOOCV Leave-one-out Cross Validation
MATLAB A numerical software for signal analysis MDD Major Depressive Disorder
MODWT Maximum Overlap Discrete Wavelet Transform mRMR Minimum Redundancy Maximum Relevance
MSE Multi-scale Entropy
MSP430 An ultra-low power microcontroller
MT Movement Time (sleep stage based on R&K rules) N1 NREM 1 stage of sleep according to AASM rules N2 NREM 2 stage of sleep according to AASM rules N3 NREM 3 stage of sleep according to AASM rules non-REM Any sleep stage apart from REM
NREM Non-REM stages of sleep (excluding Wake and Movement) OSA Obstructive Sleep Apnoea
PC Personal Computer
PCA Principle Component Analysis PLMS Periodic Limb Movements in Sleep PNN Probabilistic Neural Network PPV Positive Predictive Value PRD Percentage RMS Difference
Term Meaning
R&K Rechtschaffen and Kales
RAM Random Access Memory
RBD REM Behaviour Disorder
REM / R Rapid Eye Movement (a stage of sleep)
RMS Root Mean Square
RNN Recurrent Neural Network
ROC Receiver Operating Characteristic
ROM Read Only Memory
RP Relative Power
RTL Register-transfer Level RVM Relevance Vector Machine
S1 Stage 1 of sleep according to R&K rules S2 Stage 2 of sleep according to R&K rules S3 Stage 3 of sleep according to R&K rules S4 Stage 4 of sleep according to R&K rules SaaS Software as a Service
SAHS Sleep Apnoea Hypopnoea Syndrome SEF Spectral Edge Frequency
SEF50 Spectral Edge Frequency at 50% SEF95 Spectral Edge Frequency at 95% SEFd Difference between SEF95 and SEF50 SEFxx Spectral Edge Frequency at XX% sigma 11-16 Hz frequency band
sleep spindle A burst of 11-16 Hz wave during S2/N2 stage of sleep STFT Short-time Fourier Transform
SVM Support Vector Machine
SVM-RFE Support Vector Mahine - Recursive Feature Extraction
SWS Slow Wave Sleep
TEO Teager Energy Operator theta 4-8 Hz frequency band
TN True Negatives
TP True Positives
VHDL Hardware description language for digital design
W Wake stage of sleep
Wearable System A small, portable, easy-to-use system with low power consumption WPT Wavelet Packet Transform
1 Introduction
1.1 Overview
Diagnosis and treatment of various medical conditions has traditionally been performed in a controlled clinical setting under strict supervision of physicians. Typically, this requires multiple visits to a clinic as well as possible admissions for prolonged periods in cases where continuous monitoring of the patient is desired. The soaring costs of healthcare together with rising human population is putting a lot of strain on this healthcare model resulting in longer waiting times to be seen by a specialist.
The recent advances in biomedical and healthcare technology have shown great poten-tial in shifting some of the clinical monitoring and diagnosis to the patient’s home. This would not only relieve some burden from the hospital resources but also provide medical care to a larger cohort of the population. Realisation of this idea, however, requires medical equipment and devices that are small in size, lower in cost than their traditional counterparts, safe, easy and comfortable to use as well as provide reliable results. Conse-quently, there has been a great deal of research and commercial focus on miniaturisation of devices to design wearable health systems. An ideal wearable device would not only monitor the patient’s physiological signals but also be intelligent enough to assist the physician in decision-making by looking for common patterns and interpreting the re-sults for speedy diagnosis. It cannot be stressed enough that a wearable medical device is not a substitute for physicians but rather a tool to complement them by saving their, as well as, patients’ time.
Wearable devices have the potential to revolutionise healthcare services at the hospitals as well as homes. For hospital use, the presence of trained clinicians does not require patients to handle medical devices. However, for home usage, the design of devices should cater for the absence of clinicians and make it extremely easy for patients to handle the device with confidence. A typical such device would entail a wireless non-invasive sensor that transmits data to a small hand-held unit. This unit, which would incorporate some sort of processing, can then analyse the data and then store or transmit it to a clinic. Furthermore, such a device should be able to integrate seamlessly in the normal lifestyle of patients without causing any hindrance or requiring any significant change. The ubiquity of smartphones with wireless connectivity and powerful processors provides a useful platform for integration with wearable sensors reducing development costs of wearable medical devices by lending some of their powerful features to these devices.
Analogue Front End Signal Processing Data Transmission Data Reception (a) Analogue Front End Data Transmission Data Reception Signal Processing (b)
Figure 1.1: The two system design approaches for a wireless wearable device: (a) with signal processing at the sensor node; (b) with signal processing at the receiver end.
The inherent nature of truly wearable devices that include tiny sensors, wireless trans-mission and long hours of operation makes them very challenging to design. Their de-velopment involves work in a resource-constrained environment with extreme limitations on available power budget, device size and computational resources depending on their potential target application. On a system level, the various areas of development in-clude sensor design, human factors, data transmission protocol, signal conditioning and processing, data integrity and security.
Figure 1.1 shows two possible architectures of a wireless wearable device at a simplistic level. It includes an analogue front end for data acquisition and signal conditioning, a signal processing block, wireless data transmitter and a receiver. The only difference between the two architectures is the placement of the signal processing block in the data pipeline. Signal processing is a key part of the design that adds intelligence to the sensor or device to aid in decision-making thereby reducing a physician’s time spent per case, consequently reducing costs and making healthcare accessible to more people.
The first approach in Figure 1.1(a) allows for signals to be processed on the sensor prior to transmission. However, with device size being small and having limited power budget, signal processing techniques ought to be of low-complexity without compromising on end results. These restrictions make the sensor design more challenging if this approach is used. However, this architecture has the advantage of reduced data transmission bandwidth. With the second architecture shown in Figure 1.1(b), most or all of signal processing is performed at the receiver end. In this case all the raw data is transmitted to the receiver (e.g. a tablet or smartphone) where complex signal processing techniques can be applied with the availability of more power and computing resources. However, the transmission stage consumes more power with this approach due to a higher data rate.
This thesis focuses on the development of low power signal processing algorithms that identify diagnostically useful patterns observed on electroencephalogram (EEG) signals recorded from the brain during sleep. It primarily focuses on algorithms for the first architecture but also explores the design considerations required for the transmission of raw or compressed EEG signals in the second approach. The design of algorithms, their performances and hardware implementation are discussed in detail.
1.2 Thesis structure
This thesis is organised into five major chapters with four additional appendices. The main contributions of each are summarised below.
Chapter 2 - Sleep: What is it, why is it important and how is it monitored?
In this chapter, the different stages of human sleep are introduced. Several health condi-tions and disorders that can affect sleep are briefly discussed followed by their financial impact on the economy. The current clinical practice in the diagnosis of sleep disorders are discussed and the limitations and drawbacks of this are explained. The current prac-tice involves analysis of a patient’s sleep by monitoring his neural, eye movement and muscle activities. The signals acquired from these activities are visually analysed and classified into one of the different stages of sleep. It is argued that this process is costly and time consuming for both doctors and patients and consequently puts a strain on the healthcare system resulting in fewer patients getting the required treatment. A compre-hensive literature review is presented in this chapter to explain how different researchers have proposed several methods to automate the classification of sleep signals. Further, a review of commercial systems and their performances is also covered. Finally, a wearable system for sleep monitoring is proposed that can overcome the limitations of existing sys-tems. The design and implementation challenges associated with this proposed system are then discussed in detail.
Chapter 3 - Performance assessment of automatic sleep staging algorithms
A number of automatic sleep staging algorithms have been proposed in the last four decades. However, comparison between them is challenging because of varying metrics used to characterise their performances. The use of different databases or sections of data from same databases complicates this further since the performance of certain algorithms are dependent on the source of signals used. The prevalence of two different rules of sleep classification also adds to this problem.
In this chapter, a set of recommendations is proposed for uniform performance assess-ment of sleep staging algorithms. It is argued that public databases should be used to characterise the performance of an algorithm. Several public databases are briefly dis-cussed and a set of guidelines is presented to extract data from these databases so that the same sections of data are used across the board. This is followed by the minimum set of metrics that should be calculated to highlight the detection accuracy of an algorithm during the different stages of sleep. A sleep staging algorithm is then presented as an example to show how these recommendations are to be used. Finally, with this algorithm three different cases are used to illustrate how seemingly similar results using different databases can be totally misleading. These cases confirm the need to use standardised performance metrics for sleep staging algorithms.
Chapter 4 - REM sleep detection using single channel EEG
The push towards low-power and wearable sleep systems requires using the minimum number of recording channels to enhance battery life, keep processing load small and be more comfortable for the user. Since most sleep stages can be identified using EEG traces, enormous power savings could be achieved by using a single channel of EEG. However, detection of Rapid Eye Movement (REM) sleep an important sleep stage -from one channel EEG is challenging due to its electroencephalographic similarities with N1 and Wake stages. This limitation is one of the bottlenecks in the realisation of the system proposed in this thesis.
This chapter investigates a novel feature in sleep EEG that demonstrates high discrim-inatory ability for detecting REM phases. The discrimdiscrim-inatory ability of this feature is quantified and studied in different EEG channels. This feature, which is based on spec-tral edge frequency (SEF) in the 8–16 Hz frequency band, is then used together with the absolute power and the relative power of the signal, to develop a simple REM detection algorithm. The performance of the proposed algorithm is evaluated with overnight single channel EEG recordings from different sources. Finally, the results are compared against the performance of other algorithms that have been evaluated on the same database.
Chapter 5 - Automatic sleep staging using state machine-controlled decision trees
In this chapter a novel sleep staging algorithm is presented to work within the constraints of a wearable system discussed in Chapter 2. This algorithm uses several frequency do-main features extracted from one frontal EEG channel including the features investigated in Chapter 4. These features are then classified using a set of state machine-controlled decision trees.
In a conventional decision tree there is only one entry point in the tree resulting in several redundant nodes of analysis during different sleep stages. This results in a long
path from the entry point to the final classified result. The classifier in this algorithm has been specifically designed to use simpler features and reduce the number of analysis nodes required, making it suitable for use in a resource-constrained wearable sleep staging system. It is essentially a set of contextually aware decision trees that are activated based on the current stage of sleep. The design of each decision tree and the features required for them are discussed in detail. Finally, the performance of this algorithm is demonstrated using two public databases.
Chapter 6 - Integrated circuit design and implementation of an automatic sleep staging algorithm
This chapter presents the first complete hardware implementation of a sleep staging algorithm. The algorithm, proposed in Chapter 5, is implemented as a digital application specific integrated circuit (ASIC) in 0.18µm technology. It has four major blocks: Input controller, Fourier transform, Feature calculation and Classifier. The design of each block is covered in complete detail including its constituent modules. Several design techniques have been used to ensure there is less logic required for arithmetic computations. Further, the choices made to optimise area, meet timing and reduce power consumption of the system are also explained.
Later in this chapter, the algorithm performance after its hardware implementation is compared against the reference algorithm by simulating the hardware. It is then syn-thesised to produce a gate-level netlist which is formally verified against the hardware description to ensure its equivalence and simulated again for functional equivalence. Fi-nally, the netlist of the design is placed and routed to generate the complete layout of the sleep staging system, which is also verified for logic and functional equivalence.
Appendix A - Databases
It is proposed in Chapter 3 that public databases should be used to evaluate the perfor-mance of a sleep staging algorithm. Details about the different freely available databases are presented in this chapter.
Appendix B - An open-source toolbox for standardised use of PhysioNet sleep EDF expanded database
PhysioNet Sleep EDF database has been the most popular source of data used for de-veloping and testing many automatic sleep staging algorithms. However, the recordings from this database have been used in an inconsistent fashion. This includes, for example, arbitrary selection of start and end times from long term recordings, data-hypnogram mis-matches and different performance metrics. All these differences result in different data sections and performance metrics being used by researchers thereby making any direct
comparison between algorithms very difficult. Recently, a superset of this database has been made available on PhysioNet, known as the Sleep EDF Expanded Database which includes 61 recordings. This provides an opportunity to standardise the way in which signals from this database should be used. With this goal in mind, this chapter presents a toolbox for automatically downloading and extracting recordings from the Sleep EDF Expanded database and converting them to a suitable format for use in Matlab. This toolbox contains functions for selecting appropriate data for sleep analysis (based on the recommendations in Chapter 3), hypnogram conversion and computation of performance metrics. Its use makes it simpler to start using the new sleep database and also provides a foundation for much needed standardisation in this research field.
Appendix C - Automatic detection of sleep spindles
A sleep spindle is an important transient observed on the EEG during a certain stage of sleep. It is highly useful for the identification of this particular sleep stage and is also a subject of research to understand its importance. This chapter presents a literature review of various automatic sleep spindle detection algorithms and then proposes two algorithms for automatic identification of spindles from a single channel of EEG. The first algorithm, designed to maximise detection accuracy, uses Teager Energy Operator (TEO) and Spectral Edge Frequency (SEF) in the frequency band of interest. The second algorithm is designed to be of low complexity such that it is suitable for use in wearable devices. For this, line length of the signal is used as the characteristic feature for spindle detection. It is also implemented on a MSP430 microcontroller to demonstrate its low power consumption. Finally, the performances of the two algorithms are compared against the methods reviewed earlier.
Appendix D - Compression in wearable sensor nodes for data transmission and storage
An alternative approach for designing a wearable sleep scoring system involves performing signal analysis at the receiver end and either transmitting raw EEG data from the sensor or storing it on the sensor node itself using flash memory. However, to save transmission bandwidth and lower the power consumption it is essential to compress this data.
This chapter presents a low power MSP430-based compressive sensing implementa-tion for providing such compression, focusing particularly on the impact of the sensor node architecture on the compression performance. Compression power performance is compared for four different sensor nodes incorporating different strategies for wireless transmission/on-sensor-node local storage of data.
2 Sleep: What is it, why is it important
and how is it monitored?
2.1 Introduction
Sleep is a state of unconsciousness from which a person can be aroused [1]. It is considered a necessity of life for humans and animals alike and is essential to their physical and emotional wellbeing. It is a natural state of reduced alertness during which the response of human body to external stimuli decreases. The complexities of sleep are not well known but it is understood to be an active state during which there is an increase in the rate of anabolism. The importance of healthy sleep can be characterised by the fact that its deprivation leads to reduced physical performance, mental awareness and body temperature as well as a decrease in immune system function and an increase in heart rate variability [2]. Sleep accounts for approximately one-third of our lifetime and poor sleep leads to an overall decrease in the quality of life.
Stages of sleep
Human sleep is broadly classified into two distinct oscillatory phases based on the eye movements during sleep. These are known as Rapid Eye Movement (REM) and Non-Rapid Eye Movement (NREM). The NREM phase is further divided into different stages. According to Rechtschaffen and Kales (R&K) rules for classification of sleep stages [3], published in 1968, NREM is further classified into Stages 1, 2, 3 and 4 known as S1, S2, S3 and S4 respectively. In 2007 the American Academy of Sleep Medicine (AASM) published a set of revised guidelines [4] based on which NREM is subdivided into N1, N2 and N3 stages. Both R&K and AASM classifications include Wake (W) and REM (R) stages while the former also includes an additional Movement Time (MT) stage. The complete cycle from the start of N1 to the end of REM stage takes about 90 minutes. The cycle then repeats depending on the duration of sleep, typically 4 to 5 times during a full night’s sleep. The transition from one sleep state to another and the duration of each state gives useful insight when performing sleep analysis to diagnose sleep disorders.
2.1.1 Sleep disorders
Overview
It is estimated that more than 3.5 million people in the United Kingdom [5] and more than 70 million people in United States suffer from some sort of sleep disorder [6], having a huge financial impact on the economy stemming from expensive treatments, reduced productivity, road accidents and many other areas that involve alertness and quick judge-ment. Common sleep disorders include obstructive sleep apnea (OSA) causing disruption of sleep by interruption of breathing; REM Sleep Behaviour Disorder (RBD) involving abnormal behaviour during REM phase of sleep and Circadian Rhythm Disorders related to jet lag, shift work, etc. These may manifest in the form of sleep deprivation, disruptive sleep, excessive sleepiness and other sleep-related abnormalities and can be fatal if left untreated.
Diagnosis
Diagnosis of sleep disorders is an expensive procedure that requires performing a sleep study in a controlled environment, usually at specialised sleep clinics, to monitor mul-tiple parameters and physiological signals during sleep. These may include neural ac-tivity (EEG), eye movements (EOG), muscle acac-tivity (EMG), heart rhythms (ECG) and breathing functions. Together these signals, or a combination of them, are used to perform sleep scoring and identify, or rule out, the presence of multiple sleep disorders.
The sleep studies performed at clinics invariably involve a long waiting time before a patient can be seen. This is because of the limited spaces at such specialised clinics where resources need to be freed up before new patients can be taken in. In the United Kingdom, the waiting period from a GP referral to an actual sleep study can be as long as three years [7]. For this reason, some studies are increasingly being performed at the home of patients with the help of portable devices to do early screening and, in some cases, full testing. The different types of sleep studies are discussed in the next section.
2.1.2 Types of sleep studies
The AASM has classified sleep studies into four types based on where the study is per-formed and which signals are monitored. The different types and the signals recorded for each are shown in Figure 2.1 and further explained below.
Type 1
This is the gold standard of sleep studies that is performed at sleep clinics in the presence of trained personnel at all times. The signals monitored in this type of study include EEG, EOG, EMG, ECG, airflow, oxygen saturation and more if required.
Figure 2.1: Types of PSG and their application [8]
Type 2
This type involves recording of all signals as in Type 1 but is performed out of the clinic at a patient’s home. It does not require the presence of trained personnel but needs the patient to put on all the electrodes and probes appropriately.
Type 3
In this type, a subset of only four physiological signals are recorded. These include two respiratory signals together with the ECG and oxygen saturation using a portable device at home without the need for trained personnel.
Type 4
This is the simplest level of sleep study that is useful for early screening that may lead to a complete sleep study later. In this type, a maximum of two signals are recorded (airflow and/or oxygen saturation) using a portable device at home without the need for the presence of trained personnel.
Discussion
Type 1 sleep study, which involves recording maximum information and is the clinical gold standard is known as Polysomnography (PSG). Recently, several commercial portable devices have been available that make it possible to perform PSG at home (Type 2). This type of study is commonly referred to as Home PSG (HPSG). Of the four types of sleep studies only the first two types (1 and 2) record the EEG, EOG and EMG signals that are needed to determine the different stages and parameters of sleep accurately.
This thesis focuses on scoring of sleep stages for both Type 1 and Type 2 studies. The next section discusses PSG in detail and looks at the characteristics of signals required for sleep scoring.
2.2 Polysomnography
Polysomnography is usually performed at sleep clinics in the presence of trained tech-nicians, typically using four to six EEG electrodes, two EOG electrodes, four EMG electrodes, two ECG electrodes and additional sensors such as pulse oximeter, sound probes, etc. All these sensors monitor various body functions and are connected to a central processing device where the signals are recorded and stored for future analysis. The types and quantities of sensors used may differ depending on the sleep disorder that the physician is attempting to diagnose. Figure 2.2 shows an illustration of a patient with all sensors attached for PSG.
Figure 2.2: Illustration of a patient with sensors attached for PSG [9]
Recordings from all sensors are grouped together and analysed by trained technicians in blocks of30-second epochs. An example of PSG analysis waveforms is shown in Figure 2.3. The technicians use visual analysis of key waveform patterns and signal characteristics such as frequency content information and peak-to-peak voltage to mark the 30-second epochs. The sleep stages are determined by analysing the EEG, EOG and EMG signals. These are briefly discussed in the remainder of this section.
F ig u re 2 .3 : A ty p ic a l se t o f P S G a n a ly si s w a ve fo rm s [1 0 ]
2.2.1 EEG
Electroencephalography is a method of recording the neural activity of the brain. The electrical signal recorded is known as an electroencephalogram or EEG. To record EEG, electrodes are placed on the scalp with a front end system involving differential amplifiers and filters. EEG provides vital information for diagnosis of numerous disorders and the overall health of brain.
Configuration
Electrodes to record EEG signals are placed on the scalp according to the standard International 10-20 system as shown in Figure 2.4. For sleep staging, four to six electrodes are used to acquire signals from different locations on the scalp.
Figure 2.4: EEG electrode placement according to 10-20 system [4]
2.2.2 EOG
An electrooculogram (EOG) is a signal that provides information about the eye move-ment activity. The technique used to produce this signal is called electrooculography. It involves placement of electrodes near the eyes and recording the electrical activity pro-duced due to their movement. Electrode placement configurations to record EOG signals from left and right eye are shown in Figure 2.5. During the REM stage of sleep these signals become very important since they indicate major eye movement activity which is mostly absent during the NREM stages. The eye movements are also observed during Wake stages and tend to slow down with the onset of sleep.
(a) (b)
Figure 2.5: Electrode placement configurations for EOG recording [4]
2.2.3 EMG
An electromyogram (EMG) is a signal that provides information about the muscle move-ment activity. A full PSG study involves recording the leg movemove-ment and chin EMG. The former is useful for diagnosis of periodic limb movement disorder while the latter helps in identifying Wake and REM stages and differentiating them from other sleep stages with similar EEG characteristics.
2.3 Sleep staging rules
The EEG, EOG and EMG signals are segmented into epochs of 30 seconds. These epochs are visually analysed based on a set of rules and consequently assigned a sleep stage. The first set of rules for scoring of sleep were published in 1968 by Rechtschaffen and Kales, and are commonly known as R&K rules [3]. These rules were revised in 2007 and some changes were recommended to address and overcome some of their inherent limitations. The updated set is known as the AASM (American Academy of Sleep Medicine) rules [4]. However, despite the revised rules, R&K rules are still widely used while the AASM rules are gradually being adopted. The two sets of rules of briefly explained below.
2.3.1 R&K rules of sleep staging
Wake
An epoch is classified as Wake (W) if the EEG derivations show the presence of alpha (8-13 Hz) activity together with low voltage and mixed frequency activity.
S1
Stage 1 is characterised by the presence of low voltage and mixed frequency activity on the EEG but without the presence of eye movements on the EOG.
S2
Stage 2 is identified by the presence of sleep transients known as sleep spindles and
k-complexes observed on the EEG signals. Spindles are defined as a burst of 12-14 Hz waves with a duration of at least 0.5 seconds. A K-complex is defined as an isolated sharp negative wave followed by a positive component and duration of more than 0.5 seconds. The presence of either of these two transients and a lack of slow wave activity is used to classify an epoch as Stage 2 of sleep.
S3
An epoch is marked as Stage 3 when its EEG content consists of between 20-50% of high amplitude delta (0.5-2 Hz) waves. The amplitude of these slow waves are more than 75 µV.
S4
Stage 4 is similar to S3 except that the EEG contains delta waves for more than 50% of the epoch duration. Together S3 and S4 stages are are also known as slow wave sleep (SWS).
REM
REM sleep is identified with the presence of low voltage and mixed frequency EEG similar to what is seen during Stage 1. It is differentiated with the presence of eye movements on the EOG.
Movement Time
An epoch is classified as Movement Time (MT) when the EEG and EOG signals are obscured for more than half of the epoch duration.
2.3.2 AASM rules of sleep staging
Wake
An epoch is classified as W when more than 50% of it visibly consists of alpha (8-13 Hz) activity. If there is a large amount of artefact in an epoch (suggesting significant movement of body) it will be marked as W if the alpha rhythms are visible, otherwise it is scored as the stage that follows this epoch.
N1
If an epoch consists of less than 50% of alpha (8-13 Hz) rhythms and more than 50% of theta (4-7 Hz) rhythms, it will marked as stage 1 of NREM sleep, known as N1.
N2
This stage of sleep is identified by the presence of either or both of two distinct features of sleep: sleep spindles and k-complexes. K-complex is defined as “a well delineated negative sharp wave immediately followed by a positive component standing out from the background EEG with total duration ≥ 0.5 seconds” [4]. Sleep spindle is defined as “a train of distinct waves with frequency 11-16 Hz (most commonly 12-14 Hz) with a duration ≥ 0.5 seconds” [4]. N2 stage can be marked with the appearance of sleep spindles and/or K-complexes.
N3
This stage is scored when more than 20% of an epoch consists of waves in the range of 0.5-2 Hz, with peak-to-peak amplitude of 75 µV or more as an optionally additional criterion. It is also known as slow wave sleep (SWS).
REM
An epoch is scored as REM when eye movement activity can be observed on data sourced from EOG electrodes while the EEG activity is similar to that observed during N1 stage. Additionally, chin EMG tone falls during this stage, which can also be used for classifi-cation of REM.
2.3.3 Limitations and drawbacks of PSG
A single night’s sleep study is usually not enough for the purpose of diagnosis. This is because the patients undergoing sleep studies may not be able to have sound sleep in a new environment with many sensors attached to them. Further, more monitoring may be required owing to insufficient information obtained from one night of sleep analysis. Therefore, sleep clinics are increasingly giving patients more time to acclimatise in the alien conditions to get comfortable with the cumbersome load of sensors attached to their body. Since the PSG analysis performed at specialised sleep centres require the patients to come out of their habitat, the consequential altered sleeping environment can also affect the resultant sleeping pattern and hence add bias to the diagnosis. The whole process of a patient having to come out of his home environment, spend hours at a specialised centre, requiring an attendant, recording large amounts of data and the time taken to analyse and mark this huge chunk of sleep recordings is not only exhaustive for the patient but also an economically expensive diagnosis method.
The costs associated with PSG coupled with the necessity of clinical admission and long waiting lists [7] limits its usage despite the high prevalence of sleep disorders [5]. Home Polysomnography (HPSG), classified as a type 2 portable monitoring device by AASM [11], offers full unattended PSG at patients’ homes. It has recently been shown
to be useful to rule in or out Obstructive Sleep Apnea (OSA), results in better sleep quality of patients and reduces overall costs [12]. However, even if the PSG recording is performed at the patient’s home, sleeping with the hardware and electrodes connected is not a very pleasant experience. A typical PSG recording involves the patient being wrapped in a bundle of wires originating from the electrodes on his head, face, chest and legs, and terminating on to the recording/monitoring unit that may be placed in close proximity of the bed. Moreover, this large number of electrodes on the scalp adds physical mass, and therefore causes discomfort during sleep. The mesh of wires and electrodes limits the movement of patients during sleep while any interruption of sleep that requires getting out of bed (e.g. use of toilet) means removal and readjustment of electrodes. Since HPSG requires at least seven channels (including multiple EEG, EOG and EMG channels), the complexity imposed by the requirement of the patient precisely placing these multiple electrodes limits its adoption despite the benefits over clinical PSG.
Following a complete night’s recording, the signals are then analysed in blocks of 30-second epochs. Manual analysis and scoring of sleep from PSG traces (acquired in clinic or at home) is a tedious task that can take 2 to 4 hours for scoring data from an entire night sleep [13]. An eight-hour sleep will, therefore, consist of 960 epochs that need to be looked at and classified into different stages of sleep resulting in ahypnogram. Although not a factor in modern times, but earlier paper tracing of overnight signals could be as long as 400 meters making the whole process of scoring a challenge [14]. The marking of epochs is performed by trained eyes but adds an element of human error and perception that reduces agreement rate among different scorers. The inter-scorer agreement rate among eight different scorers was found to be between 77-82% [15], [16].
The core issues and limitations associated with both clinical and home PSGs can be summarised as follows:
• PSG at sleep clinics is expensive.
• HPSG, while saving cost and allowing patient the comfort of home, still requires the patient to meticulously attach a number of electrodes in different positions. • The sheer number of sensors makes sleep uncomfortable during PSG.
• It is laborious and time consuming to manually score the epochs.
• Manual scoring is error-prone and can lead to disagreement rate of up to 23% between different scorers.
In order to address some of the issues highlighted above, active research is ongoing in the field of sleep analysis primarily to reduce the amount of time (and data) required for analysis; and lessen the human error introduced due to inter-scorer variability. In the various proposed systems and solutions, the idea is to mimic the visual analysis
of epochs using a machine that can identify different features and patterns of signals (EEG/EOG/EMG) and classify them automatically. This idea of automating the mark-ing of epochs is commonly referred to as automatic sleep staging or automatic sleep scoring. An automatic sleep staging method would help alleviate both inter-rater and intra-rater disagreements, reduce analysis time and lower the cost of PSG tests.
Additionally, PSG systems would greatly benefit from reduction in the number of channels, simplification of user experience and incorporation of automated sleep scor-ing methods without affectscor-ing clinical outcomes. Traditionally, three EEG channels are required in PSG systems together with EOG and EMG channels. Ruehland et al. [17] reported no significant differences in sleep scoring reliability when using a single EEG channel, so this number can potentially be reduced to one. It can also be noted from the definition and marking criteria of each stage of sleep that most of the useful information is contained within the EEG subset of the overall PSG test. However, the EOG and EMG channels are still required since identifying REM stage epochs involves observing the chin muscle and eye activity [4]. Several researchers have attempted extraction of features in different domains to see whether sleep classification could be performed using only a single channel of data.
The next section looks at the various algorithms and systems that have been published in the academic literature and others that are commercially available to address the cur-rent limitations and bottlenecks in PSG analysis. The focus will be on signal processing methods for automated scoring of sleep stages and the number of channels required.
2.4 Literature review of automatic sleep staging algorithms
Efforts to automate the scoring of sleep stages started almost 50 years ago soon after the first set of rules for scoring sleep were published by Rechtschaffen and Kales in 1968 [3]. These were broadly based on the level of spectral content present in each sleep epoch being analysed. One of the natural approaches taken by researchers is to mimic the sleep staging rules defined by R&K and, later, AASM. To gauge the performance of an automatic sleep scoring method, the results from the automatic classification are compared against a reference hypnogram that is usually scored by a human expert. The percentage of correctly detected epochs by the algorithm in all the stages of sleep is referred to as the overall accuracy. The percentage of correctly detected epochs in each stage is generally referred to as the sensitivity, true detection rate or the accuracy of detection in that stage. The rest of this section briefly discusses the various automatic sleep staging methods proposed in academic literature over the years.
The simplest and most natural approach to tackle this problem was to design matched filters for the required frequency bands and use logic circuits to make decisions based on the output of these filters. This approach was taken by Smith et al.[18] in 1969. They used matched filters to detect alpha, delta, spindle and k-complex features on small
sec-tions of EEG signals and assigned a sleep score based on logic circuits that were designed to emulate the sleep scoring rules. Their method used data from four EEG channels of a single night recording. This was split into five parts with each part of two hours and resulted in an overall classification accuracy of 86.2%. Another early sleep classi-fication method, proposed by Itil et al. [19] around the same time, used baseline cross, first derivative and amplitude of EEG signals to extract 20 features for the classification of each epoch. Larsen and Walter [20] compared two preliminary sleep staging methods based on multiple regression and discriminant analysis. Their main conclusion was that the spectral power features extracted from the EEG signals were enough for classification of sleep stages except for Stage 1 and REM.
Frost [21] presented a rule-based real-time sleep scoring system using EEG and EOG signals. This was implemented using level detectors to indicate different amplitude thresholds and trigger pulses when these threshold conditions were met. This was also one of the earliest circuit level implementation of a sleep scoring algorithm using discrete components. Shortly afterwards, Smith and Karacan [22] also presented a circuit for real-time sleep scoring. This consisted of spindle, alpha, delta and artefact detectors designed using analogue circuits followed by a block of logic circuits to assign a sleep stage based on the output of preceding detectors. Their system required the use of EEG and EOG channels and achieved an accuracy of about 84%.
While these simple approaches showed promising results, researchers also started to explore other probabilistic techniques for classifying sleep signals to obtain better per-formance. Kumar [23] presented a method using clustering in amplitude subspace and achieved an agreement of 85% in all stages except REM (which was not scored) for two nights of PSG recording. Gath and Bar-On [24] also developed a clustering method for real-time sleep scoring using fuzzy partitioning. Their method was intended for use in sleep laboratories with the help of two EOG, one EEG and one EMG channels, how-ever no results indicating the accuracy of the method were given. Kemp et al. [25] then proposed a method where EEG, EOG and EMG signals were modelled using statistical processes and sleep stages were assigned based on their maximum likelihood resulting in 71% agreement with manual scoring. Stanus et al. [26] presented two online sleep staging algorithms based on a deterministic and a stochastic classifier and compared the performances of the two classifiers. They used EEG, EOG and EMG signals and showed 75% reliability between the two methods when tested on normal subjects and 70% when those with certain pathological conditions were used. Kuwahara et al. [27] proposed a method of identifying characteristic patterns on EEG, EOG and EMG signals using an interval histogram method. The results from this pattern recognition stage was then used with a rule-based classifier resulting in an accuracy of 89% between the proposed method and consensus scoring of three experts. Principe et al. [28] used the theory of evidence to automate sleep staging in real-time with EEG, EOG and EMG signals. The
spectral information extracted from different frequency bands were fuzzified and used as partial belief based on which a further set of rules were devised. They used a finite state machine with each state corresponding to a sleep stage and the machine would change state based on the outcome of the heuristic rules. They achieved an average agreement rate of almost 85% after testing with five different records.
Almost fifteen years after Smithet al.[22] presented the earliest circuit implementation of their algorithm, Principe and Smith [29] presented the first fully digital implementa-tion of a sleep analysis system to perform identificaimplementa-tion of alpha, sigma, theta and delta waveforms, sleep spindles as well as eye movement activities. They used digital filters and zero crossing detectors with thresholding - all of which were implemented on a mi-croprocessor (which was a novelty at that time). Jansen and Dawant [30] then presented a feasibility study of using an object-oriented knowledge-based approach for the identi-fication of sleep spindles and k-complexes which could later be extended for use in sleep stage classification.
The early 90s saw the availability of computing facilities in different research labs. This was the start of the digital revolution which meant more complex techniques could be used for signal analysis with the help of computers. The algorithms published from this time onwards saw a rise in the number of features being used. Further features other than those extracted from time and spectral domains saw mainstream adoption while sophisticated rule-based classifiers, decision trees, support vector machines, artificial neural networks, unsupervised clustering and many other classification tech