Information Quality Management
Through 20 years experience working with customersto address their information challenges, Trillium
Software has honed a proven methodology that positions organizations to assure high quality information in their business. The Information Quality Management (IQM) methodology is woven into the Trillium Software System, Trillium Consulting services, and our Data Governance practice; and provides a roadmap toward data certainty and information value.
Harte-Hanks Trillium Software
www.trilliumsoftware.com
Corporate Headquarters
+1 (978) 436-8900
[email protected]
EMEA
+44(0)118 940 7600
Central Europe
+49(0)7031 714756
DEVELOP DEPLOY DISCOVER MANAGE DATA GOVERNANCE
DA
TA STEWARD
IT S
TEWAR
D
Through 20 years experience working with customers to address their information challenges, Trillium Software has honed a proven methodology that positions organizations to assure high quality information in their business. The Information Quality Management (IQM) methodology is woven into the Trillium Software System, Trillium Consulting services, and our Data Governance practice; and provides a roadmap toward data certainty and information value.
IQM aligns people, process, technology, and data governance to promote the adherence of data to business policies. Trillium Software customers across all industries apply this approach to assure the
quality of their data for party views, product views, risk assessment, operational efficiency, and strategic analysis. We take a business first attitude, because our customers require it.
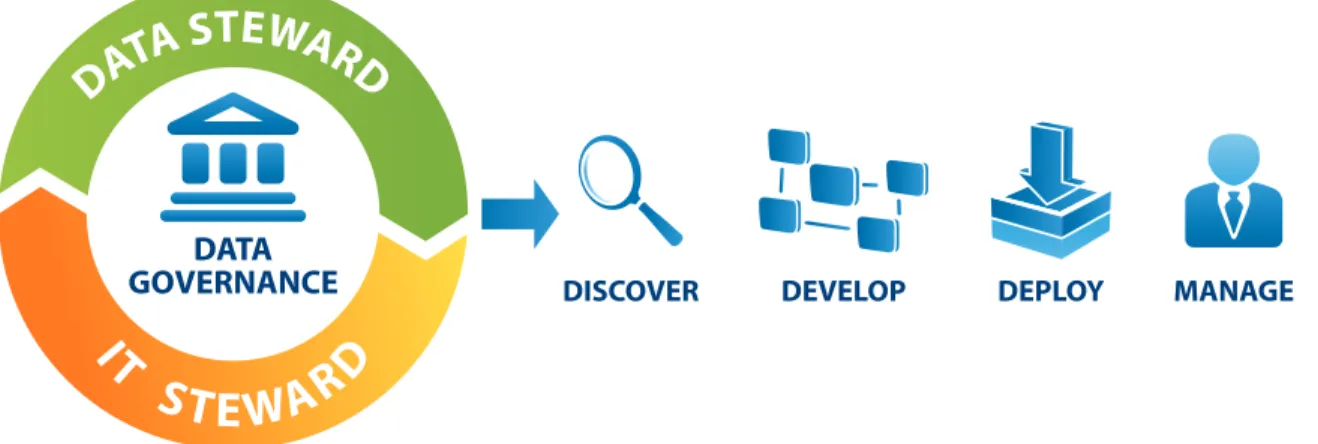
The IQM methodology is based upon the leading industry principle to design, develop, deploy, and manage technology services to remediate and manage data. Trillium Software extends that principle
to ensure services are driven by data governance defining the criticality and use for the data, and
establishing roles and responsibilities within the business and IT to achieve business goals and objectives. This extension allows projects to transition easily into an ongoing practice creating a collaborative environment between the business and IT, and outlining steps for the future alignment of data to the business. The result: As the business changes, the data continues to align and remain accurate and relevant.
Covering the Basics
Information quality starts with a foundation of data quality dimensions. Data quality dimensions consisting of context, accuracy, completeness, timeliness, and consistency are integral to assessing information
in accordance with your business objectives. It is important to recognize what factors influence these
information quality dimensions. In addition, how these quality dimensions are assessed will evolve as the business changes.
Data Quality Dimensions
Let’s first take a look and understand what each dimension represents and what factors can influence each. As a starting point, you can flag these factors in any process, application, or business policy
because they frequently lead to reliability and certainty issues.
Context – the ability to derive value from the data based on its use or ability to define an entity, process, or status.
Influence factors:
The data is not categorized according to business standards
•
The data is not delivered with other relevant information to make it useful for business
•
processes and decisions
Accuracy – data that is correct and representative
Influence factors:
The wrong data is collected
•
Accurate data is overwritten by inaccurate data
•
Wrong assumptions are made about the data
•
Inconsistencies between what is considered accurate based on business need and/or
•
between business units
Completeness – data that contains all expected or critical elements
Influence factors:
Data is not requested or collected in a process
•
Data is available elsewhere in the company
•
Data is in the system but not presented due to technology structure
•
Consistency – reliable and constant data across multiple uses
Influence factors:
Reports and applications show different information to answer the same question or drive a similar process
•
Data definitions (whether customers, product, or transaction data) differ across applications,
•
processes and business units
Transactional data, such as dates and quantities, varies between applications and reports
•
Understanding your data quality dimensions is a common ground for all information quality projects
and practices. It gets everyone on the same page to create a common definition for information quality,
and it provides an understanding of what needs to be considered when addressing information quality
challenges. However, this is only the first step to taking action and can make a project or initiative feel
overwhelming or unachievable. Let’s take a look at how to get a program off the ground.
Where to Start
Adequate preparation for your information quality initiatives is critical to success. Consider what it is you
want to accomplish since what you define up front will clarify the value your initiative will provide your
company.
Start with Your Data Flow
Where and what to focus on is dependent on your data flow. Recognizing points of entry for data, transition points across systems and processes, and how data can be added, modified, or removed across the flow helps
visualize where poor data quality can be introduced and manifest itself.
Base your business data flow model on an understanding of:
Who is involved in the creation, collection, and consumption of data
•
What the collection points are (data entry, applications, data feeds, spreadsheet uploads, etc)
•
What controls or “firewalls” exist (or are absent) to manage what comes into the system
•
(applications, processes, services, technology, etc.)
Where data gets distributed after collection (applications, data warehouse, external systems, etc.)
•
What the data supports (billing, claims, marketing, fulfillment, etc.)
•
How data is consumed (applications, reports, spreadsheets, etc.)
•
As you map out your data flow, don’t forget to put a high level picture together to clearly communicate
the project or initiative in terms that the business users will understand. You should also highlight how the changes made will improve processes and insight. You’ll need this to gain buy-in and set expectations with key stakeholders and lines of business.
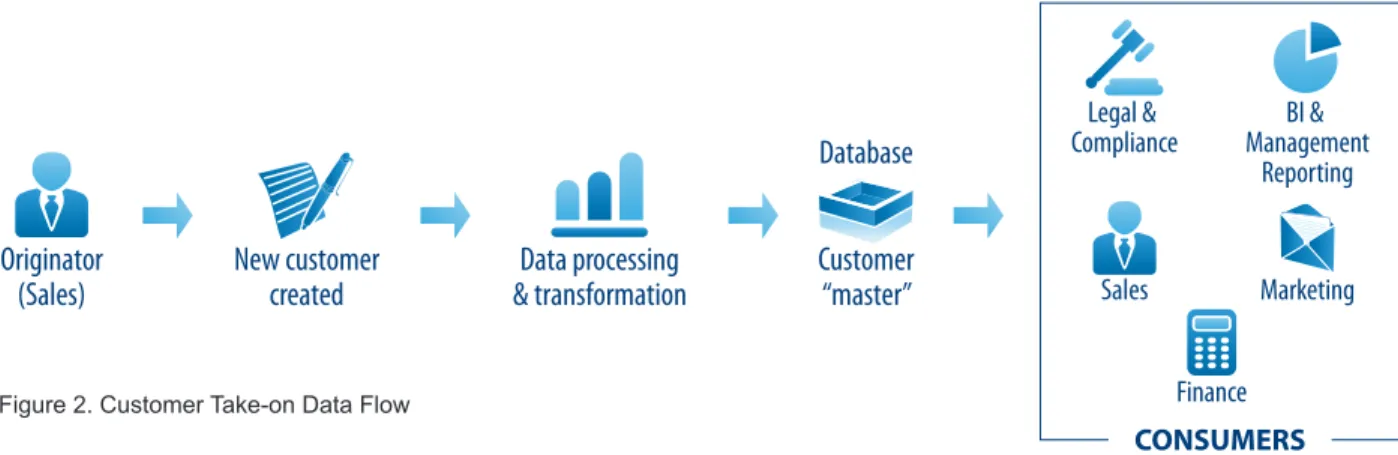
BI & Management Reporting Marketing Legal & Compliance Sales Finance CONSUMERS Originator
(Sales) New customercreated & transformationData processing
Database Customer “master”
Avoid the Chasm
A common pitfall for many companies is going too broad and tackling the entire universe of data. This typically happens with initiatives such as MDM, business intelligence, or corporate consolidation. With
these types of projects, goals are usually defined at too high a level as organizations seek to gain significant cost savings, head off regulatory pressures, or drive business growth. Because the goal is to
secure the necessary project funding, proposals are typically designed to link anticipated ROI to corporate objectives and goals. Yet, trying to tackle an enterprise project with a high-level business objective is far
removed from the influences and quality dimensions that achieve these goals. In the absence of specific
thresholds relating to information quality dimensions, a door is opened to introduce scope creep, impede decision making, and increase time and project costs. In the end, expectations are unmet and frustration ensues. Figure 2. Customer Take-on Data Flow
Start Small, Iterate, and then Expand
In order to avoid the chasm, a common approach taken by Trillium Software customers is to scale phases of a project toward manageable implementations. The scope and number of phases will depend on your
business pressures, but should ultimately take into account a tangible, visible benefit to the business. We recommend a five step approach that helps organizations easily digest information quality projects
and that provide a visible, repeatable impact once completed.
Step 1: Define the business requirements and policies your data will support.
Step 2: Describe what the business requirements are intended to accomplish. Step 3: Align the business requirements to business success factors.
Step 4: Group and prioritize business requirements to achieve tangible and measurable business value.
Step 5: Build development phases for quick tangible wins that can be communicated to the organization.
Step 1: Define the business requirements and policies your data will support
Description of Request Purpose Overall Success Factor Prioritize Into Phases Measurable Impact of Phase
Step 2: Describe what the business requirements are intended to accomplish.
Step 3: Align the business requirements to business success factors.
Step 4: Group and prioritize business requirements to achieve tangible and measurable business value.
Step 5: Build development phases for quick tangible wins that can be communicated to the organization.
The tangible value achieved in the first project should act as a springboard to future phases. This is not
just to help maintain buy-in for ongoing investment. The phase should also be repeatable in terms of
process and practices. What you accomplish once, should promote further efficiency and effectiveness
Utilizing the IQM Methodology
With the establishment of the initiative’s objectives and scope of data that will support achieving business goals, you are now ready to embark on the IQM methodology of Discover, Develop, Deploy, and Manage within a Data Governance and stewardship framework.
Discover
The challenge organizations face is that although they perceive the outcome of poor quality information and may have some insight into what is wrong with the data, they lack real visibility into the underlying issues -- what they don’t know poses the bigger obstacle. The Discover phase is a starting point to quantifying data conditions across your data landscape.
Trillium Software customer Tom Dillman, Senior Data Analyst at Farm Bureau, relates five tenets
that he and his team rely on to get started and manage information quality for their contact management system. They developed these tenets to account for their evolving business needs due to new data challenges that arise, new data that comes into the system, or changes in the business. At the core, Farm Bureau approaches development as a practice and acknowledges the
need to maintain a fluid and flexible system.
By taking this approach, their information quality projects integrate into a strategic practice, because their organization accounts for the iterative nature of managing information assets.
Farm Bureau’s Best Practices
Impact Analysis: Think through the implications of changes made to business rules and
•
implement mechanisms to discover and test results before making the change.
Service Consistency: Propagate changes in one data quality service through all data quality
•
services to maintain consistency across the enterprise.
Data Flow: Ensure quality services are coordinated with the way data is captured and
•
rendered in systems and applications.
Pervasive Quality: Build and change rules that are re-usable and automate remediation to
•
reduce manual intervention and processing delays.
Predictable Results: Outcomes from business rules and data quality services should yield
•
Comprehensive discovery incorporates two facets:
profiling for basic data conditions and structure, and
•
addressing data quality issues that pertain to business use and context.
•
Profiling
Data quality dimensions (context, accuracy, completeness, and consistency) are used when reviewing data sources. As discussed earlier, there are multiple factors that impair your data. Finding and scoping
these impacts affords you the ability to take action. The data flow you created will help guide your
assessment of the data quality dimensions.
Many organizations begin with a profiling and data mapping exercise, often undertaken by the business.
This is because it is the business that best understands what systems are utilized, how they are utilized, and the data that is being collected and consumed. The challenge is that most business data owners access source systems directly and utilize rudimentary techniques and spreadsheets to manage this aspect of the project. This can be a tedious and time consuming process, in some cases taking up the majority of the project time.
Utilizing a solution that can both investigate known issues as well as diagnose hidden problems improves the success of information quality initiatives and business impact. The Trillium Software System applies
out-of-the-box diagnostics to fulfill standard profiling tasks, saving significantly on the time to uncover
and assess basic data quality issues. In addition, users can establish business rules that check against
the organizations’s defined business policies and standards for segments, dependencies between record
Approach to Profiling
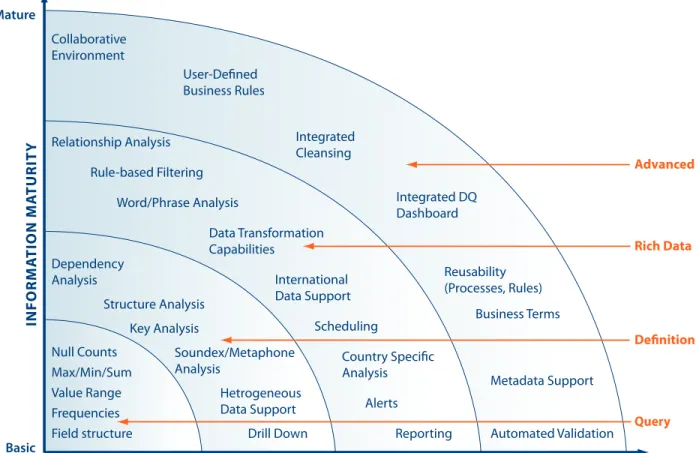
There are several profiling phases that organizations can employ to obtain a complete perspective of their data conditions. These phases, illustrated in Figure 4 include: Query, Definition, Rich Data, and Advanced. As
information management matures within the enterprise, the analysis of data conditions links more directly to the business impact.
When applying the Query and Definition approaches, the focus is on getting the data in the right form so that it adheres to the standards required to fit within a system or application. Basic information is collected
to understand what exists, the structure of the data, and whether it conforms to database and application requirements for collection and presentation.
The Rich Data and Advanced profiling
approaches emphasize how data is consumed and syndicated for business decisions and processes. Elements of records are compared and analyzed according to how information will be consumed and presented. Based on the context of the data, subject matter experts can intervene in the improvement, update, and maintenance of information, not just within an
information quality practice, but also within business operations and
workflow.
The quote from Wales & West demonstrates how regulators mandate that businesses base compliance initiatives on accurate and provably correct information. In order to comply with OFGEM1 they utilized Trillium Software’s TS Discovery to both quantify conditions, and report on their assets.
“We have 11 million records covering many
thousands of assets such as gas pipes, pumps,
valves and meters. We must maintain these assets
efficiently and safely in accordance with statutory
requirements.
To satisfy the requirements of our industry regulator,
OFGEM1, we must periodically report on these
asset management activities, our gas distribution
income, and costs. We must also show that our
operational and financial governance meets defined
performance criteria. It’s vital that the information
upon which we operate our business, and which we
report to the regulator, is proven to be accurate.”
— Martin Malin
Business Applications Manager
Wales & West
Infrastructure Profiling
Data Structure Business AlignmentContext Profiling
IN FO R M A TI O N M A TU R IT Y Dependency Analysis Structure Analysis Key Analysis Drill Down Soundex/Metaphone Analysis Hetrogeneous Data Support Relationship Analysis Rule-based Filtering Word/Phrase Analysis Scheduling Data Transformation Capabilities International Data Support Country Specific Analysis Alerts Reporting Collaborative Environment User-Defined Business Rules Integrated Cleansing Business Terms Integrated DQ Dashboard Reusability (Processes, Rules) Metadata Support Automated Validation Null Counts Max/Min/Sum Value Range Frequencies Field structure Definition Rich Data Advanced Query Basic Mature
An important concept in the Discovery phase is the application of business rules. When profiling data, you
are essentially testing data against business requirements. In this context, business rules provide a
quan-tification of conditions, but there is a lot of power behind the development of business rules. As conditions
are presented, business rules can be extended for utilization beyond Discovery.
Develop
The translation of business
requirements to executable services can be one of the most challenging elements of information quality processes. This is
due to the fact that data is fluid, flexible,
and often highly unstructured.
One must account for these variations in processing which can feel
insurmountable. Many companies have developed processes that support the 80:20 rule to attempt to account for the anomalies and remediation that are most frequent. This is where most companies stand today and the 20% of data left untouched tends to be the information that the business cares about most, relying on it to make decisions, improve business processes, or manage risk.
Why is the translation of business requirements to executable services a challenge? There are two aspects. First, IT has historically been tasked with the development of these services without having a real context of how transformations impact the business. Taking a collaborative approach between IT and the business and utilizing our recommendations for scoping a project to attainable business impact
can alleviate much of the difficulties once you get to development. Second, IT needs to look beyond the
data warehouse and integration infrastructure at the other application systems and portals that will rely on
and provide data input. These infrastructure dependencies and intersection with business workflow and
processes will determine the process frequency, record volumes processed, and consumption needs of the business. While it may seem basic, it is often overlooked – even by the business.
How to Recognize the Disconnect Between Business Requirements and the Development of Data Quality Services
Business requirements are assessed in a
•
discrete form without looking at their impact on the business or dependencies across requirements
Business requirements are established at too
•
high a level, tied more to a business outcome than solving the issues within data quality dimensions
Business rules are not created and submitted
•
by the business, but rather created by IT’s interpretation of what the business needs Business requirements are scoped and
•
prioritized to primarily address implementing a data quality process within the IT
infrastructure to meet deadline pressures of the business
Establishment of Business Rules
The establishment of business rules should be thought of beyond simply “fixing” or standardizing data. Business rules are the framework for your overall information quality process and should be defined and
developed to facilitate each of these stages, not just the Discover phase.
Rather than simply defining what a business rule is, let’s discuss what a business rule does. Business
rules perform many tasks that typically fall within one of these categories: Data Transformation
•
Data Categorization•
Processing Instructions•
Data Quantification•
DATA TRAnSFORMATIOnThe most typical use of a business rule is to develop instructions that standardize, change, link, or combine data and records, essentially to automate data remediation.
The challenge with data transformation business rules is that they occur at multiple points within a
data flow. Applications and web forms have data entry controls. ETL (extraction, transformation, and
load) tools can execute business rules to improve or standardize data. Add to this multiple data quality solutions, either purchased or home grown, and you increase complexity in your enterprise infrastructure.
Be sure to identify these multiple transformation activities when mapping out your data flow and
consider consolidating the management of these rules. This will greatly improve your results and ease maintenance in the long run.
DATA CATEGORIzATIOn
While data categorization could be considered a data transformation, because it is technically a
standardiza-tion of data, we like to call this out separately as it is specific to recoding data into business terminology or
elements that may be used in application or business reporting environments.
Data categorization is the business metadata that places information into context. Within the information
quality process, the business rules not only serve to apply pre-defined categories, but can also serve to identify metadata in any unstructured data being processed. This process provides the flexibility to align
PROCESSInG InSTRUCTIOnS
To consistently and centrally manage business rules, organizations need a way to facilitate the develop-ment of information quality processes. This means organizations will leverage business rules as a
mecha-nism to route data based on identified conditions, essentially making them process instructions. Processing instructions can either be a set of filtered records or a set of pass/fail parameters. These
instructions are conditions that can be a foundational element to ensure data is processed consistently through information quality services.
DATA QUAnTIFICATIOn
Business rules can act as a powerful mechanism to help quantify changes made to data being pro-cessed. Similar to processing instruction rules, these rules are meant to allow data stewards and IT ways
to measure impact. Business rules flag records based on set conditions and analysis of these records.
This provides feedback on data changes that align to business impact, may indicate additional automated remediation to develop, of as markers for processing errors.
The four business rule types discussed above provide the framework for successful quality processes and service delivery and continuous improvement of your information.
Building Quality Processes
Quality processes result from the logical flow of business rules and transformations to make data fit for purpose. A quality process is similar to a business flow diagram, because it contains inputs, decisions,
actions, and outcomes. Your process will result in a hybrid of business rules and transformations, creating a foundation for downstream remediation and the way data is consumed by your business.
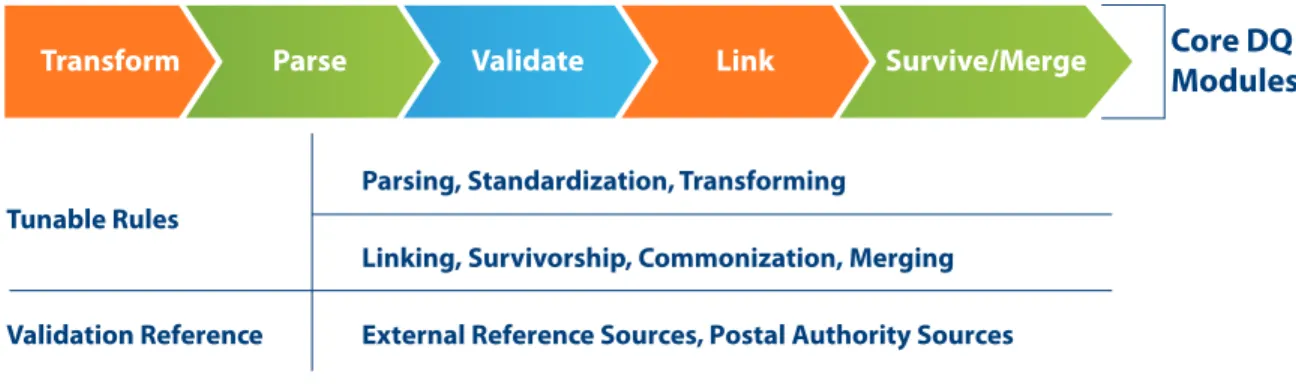
In simple terms, the order in which business rules are executed begins with initial transformations, most likely created by your data stewards during the discovery phase. As data is examined and parsed to accommodate complex transformations and comparisons to reference data, standards, and conditions,
validation establishes the standards that improve the data. Similar records are then identified and linked
External Reference Sources, Postal Authority Sources
Core DQ Modules
Transform Parse Validate Link Survive/Merge
Tunable Rules
Parsing, Standardization, Transforming
Linking, Survivorship, Commonization, Merging
Validation Reference
A robust information quality solution allows you to scale the size and complexity of your processes to meet any downstream decision or exception process. You will want to build in processes for data trans-formations, or additional analysis or intervention, depending on the results of various business rules and transformations applied.
As you architect the flow of data through your quality process, consider the following.
Data Stewardship – Data Analysts should be able to manually review records that are out of compliance with business rules and policies. Development should clearly identify and incorporate intervention points that allow for a dashboard assessment of conditions. This allows the business to provide guidance on the
nature and scope of the issue and port into a workflow to remediate as necessary. These same practices
in process design facilitate stewardship from an IT management perspective allowing for the support, tuning, and extension of processes over time.
Reference Sources – Standardization, enrichment, and cleansing will incorporate your reference sources. Reference sources typically include all of your metadata: your categories, relationships, hierarchies, and codes. Although it may seem logical to standardize data at the beginning or at the end of a quality process, there may be dependencies with transformations that rely on your reference sources, a common occurrence with derived reference sources. Within your quality processes, a data extract may need to
be parsed and analyzed, and a source file created, that provides information to standardize data. For
instance, notes from call center entries into claims categories. It’s important to note that downstream in your process, these standardizations or categories may determine the need for additional quality processing or routing.
Unification and Survivorship – Matching and unifying records to create a surviving “golden record”
often requires that data has been routed through standardization and cleansing processes. Many times, matching processes are developed in levels depending on the completeness of the record or on how reference sources and supporting data are brought in to help validate records.
Depending on complexity, reference sourcing, and the need for stewardship intervention, our customers
treat unification as separate quality processes or projects.
CREATInG THE DEvELOPMEnT LIBRARY
The key to consistent quality process development is maintaining a library of business rules, transforma-tions, and eventually other quality processes and projects. Think of these items as knowledge containers that create consistency to ensure predictable outcomes, faster time to implement, and business value of your quality services. During the Discover phase, subject matter experts develop business rules that stem from business polices and practices to incorporate into quality processes. More complex transforma-tions can be created leveraging what was already provided by the business and then extended further
to address standardization, enrichment, and unification. This is where data begins to take the shape of
enterprise information needs in an operational environment.
The importance of retaining knowledge and content for the development stage is a significant factor that
contributed to the design of the Trillium Software System (TSS). TSS users can build their libraries using a variety of options. TSS comes standard with pre-built rules and templates. To augment the business rule
library, users can build, store and maintain rules that are specific to their business. Users can also access
TrilliumApps, an online repository of content aligned to various types of projects, operational and vertical applications, and global data transformation needs, and then import that content into TSS project libraries.
Testing is Not Nice to Have, It is a Must Have
Ensuring that data is fit for purpose and that
quality information has been delivered to the business requires the buy-in and sign-off from business users that they have achieved predictable results. Testing provides critical benchmarks to ensure objectives are met after deployment. Many technology implementations fail, because although they achieve technology project goals, they don’t meet the expectations of the business. A sure sign that your project will fail is if testing time has been shortened or scope diminished just to meet a calendar deadline. If the business or non-technical user has not adequately tested the data to develop
confidence in the results, regardless of the fact
that the data might better, the business will
continue to have a lack of trust in the information they will use for decisions.
Another factor to consider is that there is the ability to test not just at the end of a development cycle, but also to test new data extracts and feeds that will be introduced into your environment. Because mergers and acquisitions, application integration, system consolidation, and partnerships introduce new data sources and feeds into your environment, it’s crucial to review the quality of that information and its downstream impact on the enterprise. One Trillium Software customer, upon reviewing the data of a targeted acquisition, was able to negotiate a lower acquisition cost after improved information provided a more accurate representation of that business.
The development phase can be more effective with adequate support provided in the preparation and Discover phases of your initiative. Quality processes can be developed within the context of business impact and a holistic use of technology by the business. Containers of business rules, processes, and projects are created to be reused to ensure consistency in later projects. And, inclusion of the business in the testing
process will ensure that what you built satisfies their requirements and prepares you for deployment.
Must-Have Testing Capabilities
One version of the Truth: Single
•
environment for the business and IT to test and validate quality processes and results
Easy to Read Results: visual reports
•
and dashboards to readily identify pass/fail conditions
Scalable: Ability to enter individual
•
records or load test files
Test All Processes: Testing can
•
accommodate cleansing and matching processes
Deploy
Getting high quality information to the business where and when it’s needed is always the goal. How you do that depends on a combination of business process and decisions that rely on that information, and what dependencies in processing need to occur for the business to be certain of the information they receive. Let’s review an example of updates to postal directories for shipping addresses. A food product manufacturer conducts refreshes to existing postal directories that are obtained on a monthly basis. Due to the number of corresponding address records in the logistics system, it could take up to 15 hours to process all the corresponding updates. Requirements from the business to ensure proper delivery of perishable items with shipments at 8 hour shifts are impacted by incomplete or incorrect location information. Because a 15 hour batch update will likely not meet established service levels from IT, the solution entails partitioning and prioritizing shipment records based on delivery timeframes and performing rolling updates throughout the logistics system.
Another example involves a retailer that wants to collect and verify identity and credit information for customers to open a credit account with their store. Here, the point-of-sale system captures and sends information for credit check and account approval. In this scenario, quality processing needs to happen within a store’s existing transaction process to establish credit to be used during the sale. If the ability to establish credit at point-of-sale does not occur, the customer may reconsider the purchase resulting in a lost or reduced sale.
Both these examples illustrate the need to revisit the business process and data flow. Deployment is
where you connect the dots between high quality data and business need and value. To create pervasive information quality, the ability to use and reuse data quality processes and projects means that sometimes processes will run in large batches, and at other times they will run in real-time. There also may be instances where a quality process is deployed in part during a business process and then enters into a batch quality process to be incorporated into a larger, enterprise-wide effort for information consistency. Many Trillium Software customers develop their data quality processes for deployment in batch services running nightly, weekly, or even monthly. Achieving best practice for pervasive and consistent data at the enterprise level, they then want to take existing processes and deploy them in real-time within a
business workflow. Yet, simply flicking a switch on a quality service in a new use case may not be the best
approach. Attention is needed as to what the business policies and consumption requirements are, as well as how your applications and systems will accept and execute the real-time quality services.
Considerations to Move from Batch to Real-Time:
Distinguish the critical information from the nice-to-have information to service the business’ needs Determine the frequency and timeliness to present information
•
Consider the limitations of systems and applications that present information
•
Identify how to reuse or partition existing processes to meet business requirements
•
Account for the user experience to avoid bottlenecks or delayed adoption by the business
•
Define a service level agreement with the business for uptime and availability
•
Utilize a solution that easily configures batch processes to real-time
•
How you deploy data quality processes is another factor in the ability of the business to improve and
consume information that is fit-for-purpose. If processes can’t be effectively aligned to business needs,
information quality is not achieved.
However, once in production, quality processes don’t stop. The business is dynamic and the deployment of current quality processes won’t account for the changes in data as the business changes and evolves. In addition, quality services and consumption needs can change as business processes that were once a manual or weekly activity are then transformed into automated, real-time activities. To keep up with these changes, you need a mechanism in place to manage your data over time.
Manage
Realizing the business benefits of improved information quality requires that management capabilities be
put in place to monitor, sort, and prioritize activities and programs. This is usually the weak link for many organizations since information quality efforts are treated on a project-by-project basis, addressing an im-mediate pain without taking into account the longer term view of the broader impact of information quality. Management is the element that transforms your information quality projects to practice.
Reports, dashboards, and scorecards should leverage points identified in the business impact and data profiling assessment, and business rules developed to remediate non-compliant data. They should be or -ganized around the critical quality dimensions of accuracy, consistency, completeness, context, and time-liness. As with any performance management effort, a framework of measures, metrics, and KPIs should be established for tracking data conditions over time. From there, you will want to create a framework that provides varying levels of detail based on what you want to monitor and what depth of investigation you want to take based on your views.
Tactical Operational Line of Business
DATA QUALITY REPOSITORY
Metrics, Scores, Benchmarks, Trends
We recommend monitoring data conditions to support tactical, operational, and line-of-business
requirements. Each of these levels supports the various stakeholders that rely or are required to steward and ensure the quality of information. Line-of-business monitoring helps business managers maintain
confidence in the data supporting processes, compliance, or decision support. Operational monitoring
keeps an eye on how conditions continue to satisfy day-to-day activities and calls out areas that are
improving or impacting the business. Tactical dashboards allow for ongoing profiling and analysis, and
allow for hands-on remediation or investigation of new conditions. Below, we will go into more detail of what each view should support.
Line-of-Business Dashboards
As a line-of-business manager or executive, you rely on information to make decisions. However, you may doubt that the information you have provides a realistic view of your business. Or, you do trust your information and are unaware of the underlying conditions in your applications and reporting systems that introduce risk. Increasingly, the quality of data that supports reports for regulatory purposes is a critical
element to maintaining compliance and passing certifications. Maintaining a dashboard that links key
quality elements to strategic and regulatory information is no longer an option but a requirement.
If you need to assess credit risk within your customer base, consider factors in your data that impact your models and reports: corporate hierarchies and relationships in your vendor accounts, household and
individual profiles of end customers, and the standardization of product and transactional information.
In fact, as you introduce new products to market, realign your business to changing market conditions,
and acquire other companies, there can be significant impact to the validity of your insight. You need to stay on top of data conditions and proactively and quickly implement improvements. Overall, confidence
scores associated with reports and models with drill-down capabilities into contributing factors will provide that support needed to either address issues or provide proof of certainty for regulatory compliance. Operational Dashboards
Effective data governance requires the ability to track and monitor data conditions continually over time, and provide prioritization of activities and the management of resources to improve and maintain peak
condition data. These dashboards are the first line of insight to seek out attention and investment when information challenges are significant enough to the business. Trending of key performance indicators
and information quality dimensions help Data Governance managers and teams easily manage the data. Tactical Dashboards
Data Stewards not only need to manage and improve data every day, but also continually monitor and remediate suspect records that fall outside compliance standards. They may need to tune business rules
or take manual action on records and files to ensure proper processing, remove potential bottlenecks in business processes caused by poor quality data, or support confidence in business dashboards. Data
Stewards need easy access to dashboards, process charts, and data extracts that provide measures of data conditions associated to business rules and metrics of all quality dimensions.
We’ve shown you a logical progression to establish and deploy data quality services and then have the ability to manage changing conditions over time. The Manage phase gives a solid foundation for turning your projects into practice by establishing an ongoing feedback look across key stakeholders, operations, and data and IT analysts. The practice is Data Governance.
Data Governance
There is a lot written on the subject of Data Governance, and we won’t go into depth in this discussion. However, Data Governance is the lynch pin to successful execution of the Discover, Develop, Deploy, and Manage methodology we recommend. It closes the loop on whether your organization will be successful in the long term for managing information quality, simply because its purpose is to ensure alignment of data to the business need.
Data Governance is both widely used and talked about, but rarely executed successfully. It tends to get
stuck in committee for a variety of reasons: lack of buy-in, conflicting agendas, lack of resources, unclear
expectations and goals, etc.
Let’s de-mystify Data Governance. If you look at the steps to prepare for the data initiative and leverage the data methodology of Discover, Develop, Deploy, and Manage, each is a facet of executing on business policies and objectives as it pertains to supporting data. Data Governance is the practice of taking business policies and objectives and aligning and managing data to meet those needs and expectations.
Whether you are executing your information quality projects in our prescribed manner or not, you are most likely doing some of what Data Governance involves. What is important to consider as you embark on Data Governance is that whether it drives your data quality initiatives or is eventually a product of the initiative, it almost doesn’t matter. The practice is a cycle rather than a start point to end point. Data Governance feeds the information quality methodology and the methodology supports ongoing Data Governance.
Conclusion
By employing the strategies outlined in this paper, businesses can not only align their data more
effectively to business use, but also extend the lifetime value of information by ensuring an enduring level of information quality. We encourage you to utilize the techniques that formalize an information quality management strategy:
Build context around information quality requirements
•
Implement a roadmap to overlay information quality elements to existing business
•
processes and create new ones where applicable
Associate unique business cases with these requirements
•
Apply the IQM methodology to ensure data is fit for purpose now and in the future
•
Remember, the goal of IQM is to ensure that data is accurate, consistent and that it aligns to business need as the business changes and adapts to market drivers and competitive landscapes. Guarantee
that information is in peak condition to alleviate risk, improve operational efficiency, and support strategic
decision making for market advantage. To further ensure success, you can rely on Trillium Software solutions and services to help you be certain about your data.