MALAYSIAN JOURNAL OF MATHEMATICAL SCIENCES Journal homepage: http://einspem.upm.edu.my/journal
Robust Detection of Outliers in Both Response
and Explanatory Variables of the Simple
Circular Regression Model
Sohel Rana
1, Ehab A. Mahmood
2, Habshah Midi
2,3, and Abdul
Ghapor Hussin
41
Department of Applied Statistics, Faculty of Sciences and
Engineering, East West University, Bangladesh
2
Department of Mathematics, Faculty of Science, Universiti Putra
Malaysia, Malaysia
3
Institute for Mathematical Research, Universiti Putra Malaysia,
Malaysia
4
Faculty of Defence Science and Technology, National Defence
University of Malaysia, Malaysia
E-mail: [email protected]
∗
Corresponding author
ABSTRACT
It is very important to make sure that a statistical data is free from out-liers before making any kind of statistical analysis. This is due to the fact that outliers have an unduly affect on the parameter estimates. Circular data which can be used in many scientific fields are not guaranteed to be free from outliers. Often, the relationship between two circular variables is represented by the simple circular regression model. In this respect, outliers might occur in the both response and explanatory variables of the circular model. In circular literature, some researchers show interest to identify outliers only in the response variable. However, to the best of our knowledge, no one has proposed a method which can detect
out-method which can detect outliers in both variables of the simple circular linear model. The proposed method depends on the robust circular dis-tance between the response and the explanatory variables in the model. Results from the simulations and real data example show the merit of our proposed method in detecting outliers in simple circular model.
Keywords: Circular data, circular regression, outlier, masking and swamp-ing
1.
Introduction
Circular data can be applied to various branches of scientific fields. It can be represented on the circumference of the circle and they are measured either by degree [0o-360o) or radians [0-2π). However, the statistical analysis and any measures which are used in linear data cannot be used with the circular data due to the circular geometry theory.
The existence of outliers may cause interpretative problems of the statis-tical analysis as the presence of outliers misleads the statisstatis-tical results and the conclusions. Hence, researchers try to improve the ways to detect them. There are mainly three causes to occur outliers in the statistical data, which are miss-recording, unwitting sampling from another population and vagaries of sampling resulting in the occasional isolated value Fisher (1993). Outliers have large effect on the research results, especially if their percentage of oc-currence is high. There are generally three types of outliers in a regression model. First, X- space outliers or referred to as high leverage point (one or more observations that lie far away from the group of observations at the X axis ). Second, Y-space outliers (one or more observations that lie far away from the group of observations at the Y axis). Finally, X-Y-space outliers (one or more observations that lie far away from the group of observations at the X axis and the Y axis) (see,Barnett and Lewis (1994)). Several work have been done to identify outliers in the response variable (Y- space direction) in the simple circular regression model. However, less attention is made in detecting outliers in both Y and X axis.
To predict the mean direction µ of the response variable y of the circu-lar regression model from a set of linear covariates x=x1, x2, ..., xn ,where y
follows von Mises distribution, Gould (1969) explained that it is important to use different statistical techniques for circular data from the classical tech-niques for linear data because the circumference is a bounded closed space. He was the first researcher who introduces the circular linear model as µ
= µ0 + Σβixi, by assuming that there is a set of circular independent and
identically observations ϑ1, ϑ2, ..., ϑn that follow von Mises distribution with
mean direction µ1, µ2, ..., µn and unknown concentration parameter k.
Mar-dia (1972) extended Gould’s model and his model is given by µi=µ0+βti,
for some known numbers t1, t2, ..., tn and unknown parameters µ0, β.
Jam-malamadaka and Sarma (1993), proposed a regression model when both of response and explanatory variables are circular. Their model is given by E(eiy|x) =ρ(x)eiµ(x)=g
1(x) +ig2(x), whereµ(x) is the Conditional mean
di-rection of y given (x),ρ(x) is Conditional concentration,0≤ρ(x)≤1. Hussin et al. (2004), extended Gould’s and Mardia’s models and suggested a simple circular regression model when both of the response variable y and explanatory variable x are circular. The model is given as :
yi =α+βxi+εi(mod2π) (1)
whereα, βare model parameters,εis a circular random error follow von Mises distribution with circular mean 0 and concentration parameter κ [vM(µ, κ)]. Now, it is obvious that the angles ϑ and ϑ+ 2π give the same point on the circle. All arithmetic should therefore be modulo 2π, which is represented as mod 2πMardia and Jupp (2000).
It is noted that the previous models proposed by the several authors bypass the effect of outliers on their models even though it has huge effect on the models. Later, Abuzaid et al. (2011) suggested COVRATIO statistic to de-tect outliers in the response variable y of the simple circular regression model. Nonetheless, they did not try to identify outliers for the both response and explanatory variables. Hussin et al. (2013) proposed the complex linear regres-sion model to detect outliers based on the complex residuals. Abuzaid et al. (2013), proposed the Mean Circular Error (MCE) statistic to identify outliers in the response variable of the simple circular regression model by using a row deletion approach.
In the same year, Abuzaid (2013) compared the COVRATIO statistic be-tween simple circular regression model with the complex linear regression model to investigate the outliers in Y direction. He concluded that the performance of COVRATIO statistic for the simple circular model is better than for the com-plex linear circular model. Nonetheless, none of them studied the detection of outliers in both response and explanatory variables of the simple circular regres-sion model. Therefore, we aim to propose a statistical test to identify outliers in both response and explanatory variables of the simple circular regression model. To date, with the best of our knowledge, no work has been published to detect outliers in the both response and explanatory variables. Thus, we cannot com-pare the results of our proposed statistic with any other statistics. However,
we evaluate our suggestion by considering three robust measurements such as the proportion of detection outliers, masking and swamping rates. It can be noted that the masking is an inability of the statistic test to detect outliers and swamping represent detection of clean observations as outliers Rousseeuw and Leroy (1987).
This paper is arranged into the following sections.Section 2 explains the proposed robust circular distance statistic and also find the cut-off points for the proposed statistic. In Section 3, the performance of the proposed statistic is evaluated by using simulation study. A real data example of the use of the proposed statistic in a real-life situation is given in Section 4. Finally, in Section 5, on the basis of all the numerical results we draw a conclusion in favour of using the proposed statistic to detect outliers in the both response and explanatory variables in the simple circular regression model.
2.
Proposed Robust Circular Distance
RCD
xyThe proposed robust circular distance RCDxy statistic to detect outliers
in both of the response variable yi and the explanatory variable xj of the
simple circular regression model Hussin et al. (2004). According to the circle geometry theory, the circular data are bounded and the outliers in the circular regression model may not be extreme values. Therefore, we propose to cal-culate the circular distance [dist]xy between the observations of the response variable and the explanatory variable, then calculate robust circular distance
RCDxybetween[dist]xyand its mean direction as a statistic to detect outliers.
The circular distance between any two data points is not as the linear dis-tance. Jammalamadaka and SenGupta (2001) suggested the following formula (ϕij=π− |π− |ϕi−ϕj||) to calculate the circular distance betweenϕi andϕj.
In this section, we consider the following steps: first, we propose a new formula to calculate the circular distance between y and x, as following :
If{(yi≥xi)} : [disti]xy= yi−xi if yi−xi≤π 2∗π−yi+xi if yi−xi> π If(yi< xi): [disti]xy= xi−yi if xi−yi≤π 2∗π−xi+yi if xi−yi> π
where : 0≤[disti]xy≤π
Second, we calculate the trimmed mean direction from the calculated circu-lar distance,[disti]xy, to avoid the effect of contaminated and extreme circular
distances. Because of the circular distance is [0, π], we trim the largest and smallest circular distance. The trimmed mean is one of the robust meth-ods to estimate the location parameter by eliminating a proportion of the largest and smallest values, where the proportion of trimming is δ ∈ [0,0.5)
[0, 0.5) Maronna et al. (2006). Then, we calculate the circular distance be-tween[disti]xy and trimmed mean direction as following :
disti=|[disti]xy−meant| (2)
where :
meant: trimmed mean direction of[dist]xy.
The observation ith is identified as an outlier ifdisti is greater than the cut-off
point. Where, the cut-off point can be calculated by
RCDxy=max(dist) (3)
We depend on three measures to evaluate our procedure: the proportion of detection of outliers and rate of masking and swamping.
2.1
Calculate Cut off Points of The
RCD
xyA series of a simulation studies of the simple circular regression model (1) were carried out to determine the cut-off points of theRCDxystatistic. It is
de-signed to determine the cut-off points (percentage points) of the null hypothesis for the distribution of no outliers in both the response and explanatory vari-ables.This procedure is similar to the procedure that has been used by (Pearson and Hartley 1966) and (Collett 1980). Random circular errors were generated fromV M[0, κ]distribution and Samples of von Mises distributionV M(π/4,10)
with corresponding size n are generated to represent the values of X variable. The parameters are fixed atα= 0andβ= 1. Observed values of the response variable Y are calculated based on model (1). In each experiment, we consider twenty-one different sizes of samples (n = 10(10)200 and 250), nine values of concentration parameterκ= 2, 3, 5, 6, 8, 10, 12, 15, 20 are used. In this step, we consider the mean direction of[dist]xy instead of trimmed mean direction
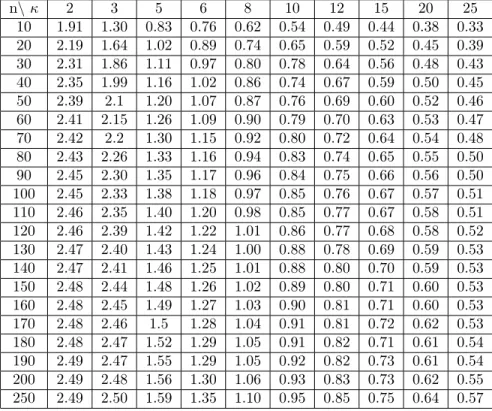
because the data are clean (without any contamination). By replicating these processes 5000 times for each combination of sample size n and concentration parameterκ, we calculate theRCDxystatistic. Finally, the10%and5%upper
percentile values are tabulated in Tables 1 and 2 respectively. We can notice that the cut off points is increasing function of sample sizes and decreasing function of the concentration parameterκ.
Table 1: The10%points of the null distribution ofRCDxy n\ κ 2 3 5 6 8 10 12 15 20 25 10 1.91 1.30 0.83 0.76 0.62 0.54 0.49 0.44 0.38 0.33 20 2.19 1.64 1.02 0.89 0.74 0.65 0.59 0.52 0.45 0.39 30 2.31 1.86 1.11 0.97 0.80 0.78 0.64 0.56 0.48 0.43 40 2.35 1.99 1.16 1.02 0.86 0.74 0.67 0.59 0.50 0.45 50 2.39 2.1 1.20 1.07 0.87 0.76 0.69 0.60 0.52 0.46 60 2.41 2.15 1.26 1.09 0.90 0.79 0.70 0.63 0.53 0.47 70 2.42 2.2 1.30 1.15 0.92 0.80 0.72 0.64 0.54 0.48 80 2.43 2.26 1.33 1.16 0.94 0.83 0.74 0.65 0.55 0.50 90 2.45 2.30 1.35 1.17 0.96 0.84 0.75 0.66 0.56 0.50 100 2.45 2.33 1.38 1.18 0.97 0.85 0.76 0.67 0.57 0.51 110 2.46 2.35 1.40 1.20 0.98 0.85 0.77 0.67 0.58 0.51 120 2.46 2.39 1.42 1.22 1.01 0.86 0.77 0.68 0.58 0.52 130 2.47 2.40 1.43 1.24 1.00 0.88 0.78 0.69 0.59 0.53 140 2.47 2.41 1.46 1.25 1.01 0.88 0.80 0.70 0.59 0.53 150 2.48 2.44 1.48 1.26 1.02 0.89 0.80 0.71 0.60 0.53 160 2.48 2.45 1.49 1.27 1.03 0.90 0.81 0.71 0.60 0.53 170 2.48 2.46 1.5 1.28 1.04 0.91 0.81 0.72 0.62 0.53 180 2.48 2.47 1.52 1.29 1.05 0.91 0.82 0.71 0.61 0.54 190 2.49 2.47 1.55 1.29 1.05 0.92 0.82 0.73 0.61 0.54 200 2.49 2.48 1.56 1.30 1.06 0.93 0.83 0.73 0.62 0.55 250 2.49 2.50 1.59 1.35 1.10 0.95 0.85 0.75 0.64 0.57
2.2
Performance of
RCD
xyStatistic by Simulation Study
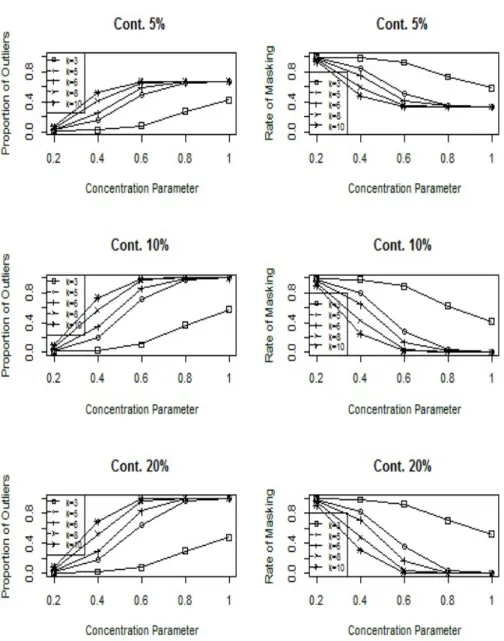
In this simulation study, model (1) is used where we select 5 concentration parameters namely κ = 3, 5, 6, 8 and 10 for three sample sizes n=60, 100 and 160. We study three ratios of contamination (α=5%, 10% and 20%). y outliers were created such that in the firstα/2clean observations are replaced with contaminated data. While outliers in x were created by replacing the last α/2 of clean observations with contaminated data. We contaminated y and x according to the following formula :
ycont=yclean+λπ(mod(2π))
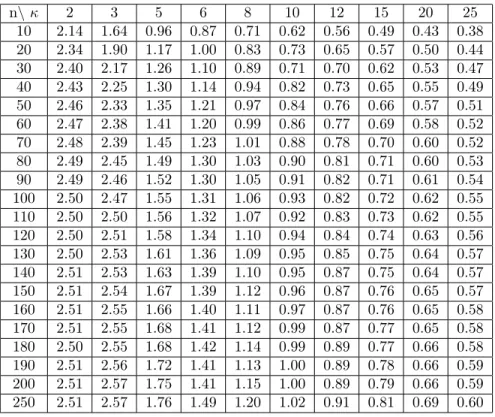
Table 2: the5%points of the null distribution ofRCDxy n\κ 2 3 5 6 8 10 12 15 20 25 10 2.14 1.64 0.96 0.87 0.71 0.62 0.56 0.49 0.43 0.38 20 2.34 1.90 1.17 1.00 0.83 0.73 0.65 0.57 0.50 0.44 30 2.40 2.17 1.26 1.10 0.89 0.71 0.70 0.62 0.53 0.47 40 2.43 2.25 1.30 1.14 0.94 0.82 0.73 0.65 0.55 0.49 50 2.46 2.33 1.35 1.21 0.97 0.84 0.76 0.66 0.57 0.51 60 2.47 2.38 1.41 1.20 0.99 0.86 0.77 0.69 0.58 0.52 70 2.48 2.39 1.45 1.23 1.01 0.88 0.78 0.70 0.60 0.52 80 2.49 2.45 1.49 1.30 1.03 0.90 0.81 0.71 0.60 0.53 90 2.49 2.46 1.52 1.30 1.05 0.91 0.82 0.71 0.61 0.54 100 2.50 2.47 1.55 1.31 1.06 0.93 0.82 0.72 0.62 0.55 110 2.50 2.50 1.56 1.32 1.07 0.92 0.83 0.73 0.62 0.55 120 2.50 2.51 1.58 1.34 1.10 0.94 0.84 0.74 0.63 0.56 130 2.50 2.53 1.61 1.36 1.09 0.95 0.85 0.75 0.64 0.57 140 2.51 2.53 1.63 1.39 1.10 0.95 0.87 0.75 0.64 0.57 150 2.51 2.54 1.67 1.39 1.12 0.96 0.87 0.76 0.65 0.57 160 2.51 2.55 1.66 1.40 1.11 0.97 0.87 0.76 0.65 0.58 170 2.51 2.55 1.68 1.41 1.12 0.99 0.87 0.77 0.65 0.58 180 2.50 2.55 1.68 1.42 1.14 0.99 0.89 0.77 0.66 0.58 190 2.51 2.56 1.72 1.41 1.13 1.00 0.89 0.78 0.66 0.59 200 2.51 2.57 1.75 1.41 1.15 1.00 0.89 0.79 0.66 0.59 250 2.51 2.57 1.76 1.49 1.20 1.02 0.91 0.81 0.69 0.60
whereλ: Degree of the contamination, such that (0≤λ≤1).
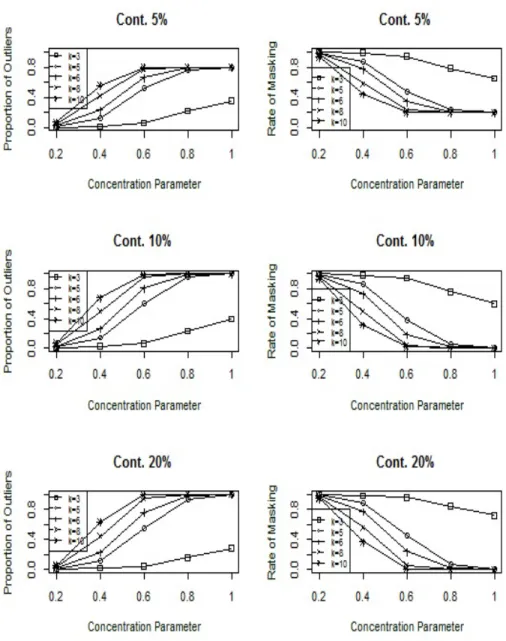
If λ= 0 , there is no contamination while if λ = 1, the circular observation is located at the anti-mode of its initial location. We replicate these processes 5000 times for all combination of the sample sizes and concentration parameter to calculatedisti. Figures 1-3 show the proportion of detected outliers and rate
of masking at different degrees of contamination,λ, for the different percentage of outliers. The upper percentile value of10%is used as a cut-off point of the
RCDxy statistic for sample sizes 60, 100 and 160 respectively in these Figures
1-3. The results are consistent with the other sample sizes which are not shown. The interested readers can request whole results from the corresponding author.
Figure 1: Performance ofRCDxystatistic for n = 60
We notice from the Figures 1-3, as expected, the proportions of detected outliers are high for all combination of κ and n except κ = 3. Besides, our
proposed method has high proportions of detected outliers for all ratios of con-taminations except when n=60 with5%of contamination. This is because of the observations are more spread around the mean direction whenκis small, in this case; it is very difficult to identify outliers. Collett (1980) As a second measure of performance for the proposed method, the rate of masking is con-sidered. As seen from the Figures 1-3, the rate of masking is low and decreasing function of the concentration parameter up to reach0% with λ > 0.5 and κ = 10. This is the second measure to esteem the proposed test. As a third measure of performance for the proposed method, the rates of the swamping are considered. However, the results are not shown here due to they are equal to zero for all combinations. At all, the performance of the proposed method is an increasing function of sample size. Our proposalRCDxy statistic succeeds
to identify outliers with concentration parameter greater than 5 andλ >0.5for different sample sizes with low and the high ratio of contamination for the both response and explanatory variables of the simple circular regression model.
3.
Practical Example
We detect outliers of the wind directions data which have been considered by Abuzaid et al. (2013). In this data, a sample of 129 represent the measurements by radians were recorded along the Holderness coastline (the Humberside coast of North Sea, United Kingdom) by using (HF radar) system (x) and anchored wave buoy (y). The observations 38 and 111 are found to be outliers of the original data set Abuzaid et al. (2013). In order to see the effect of more than 2 outliers as is done in the simulation study, we deliberately contaminate the data with 5%, 10% and 20% in x and y variables with λ = 0.6. Figures 4 (a-d) show the circle plots of[disti]xyof the original wind directions data, with
contamination5%,10% and20%, respectively.
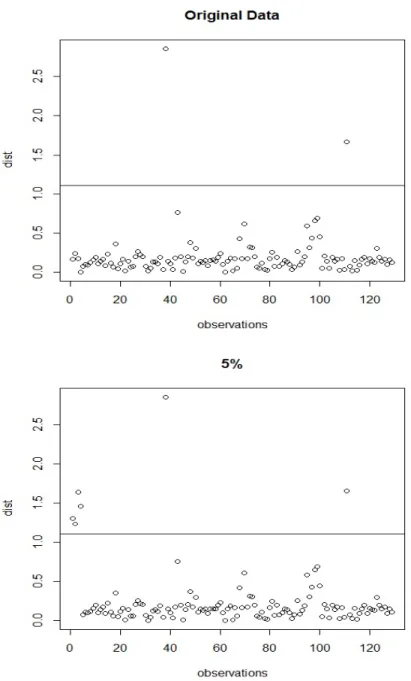
The estimated concentration parameter is κ=7.34. Therefore, the cut off point is equal to 1.1, according to the results in Table 1 with upper percentile
10%. TheRCDxy statistic is calculated and the results are plotted in Figure
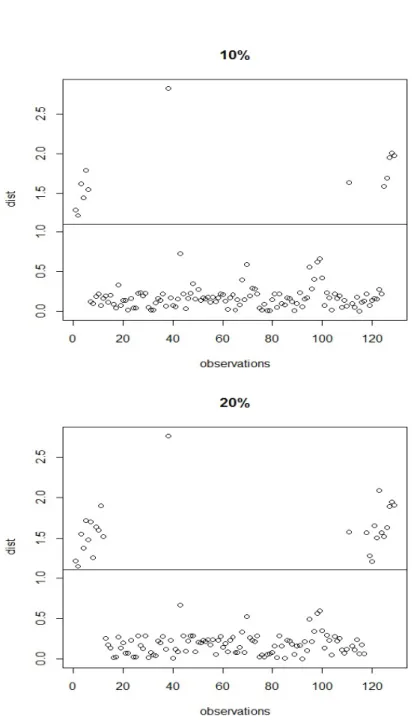
5 for original wind directions data and with 5% of contamination. Figure 6 shows theRCDxy statistic for10%and20%of contamination. Figure 5
(Orig-inal Data) shows thatdist38 and dist111 exceed the cut-off point, so they are
classified as outliers. These detections correspond with those given by Abuzaid et al. (2013). In other Figures , our statistic can identify5%,10% and20%of the contaminated data as outliers, respectively. As a result, RCDxy statistic
can be used to detect outliers for the low and high ratios of contamination for the both response and explanatory variables in the simple circular regression model.
4.
Conclusion
This research focuses on the identification method of outliers in both the re-sponse and explanatory variables in the simple circular regression model. New robust method for diagnostic outliers is proposed. The statistical measures, proportion of detected outliers and rate of masking and swamping are consid-ered to evaluate our proposed statistic. We investigate the performance of our proposed statistic with a real and simulated data. Results obtained from both numerical examples indicate thatRCDxy statistic was very successful in
iden-tifying outliers with different ratios of contamination. Monte Carlo simulation also supports the merit of our proposed method under a variety of situations with rate of swamping equal to zero.
References
Abuzaid, A., Mohamed, I., Hussin, A., and Rambli, A. (2011). Covratio statis-tic for simple circular regression model. Chiang Mai J. Sci, 38(3):321–330. Abuzaid, A. H. (2013). On the influential points in the functional circular
relationship modelsl. Pak. J. Stat. Oper. Resi, IX(3):333–342.
Abuzaid, A. H., Hussin, A. G., and Mohamed, I. B. (2013). Detection of outliers in simple circular regression models using the mean circular error statistic.
Journal of Statistical Computation and Simulation, 38(2):269–277.
Barnett, V. and Lewis, T. (1994). Outliers in Statistical Data. Wiley, New York and London.
Fisher, N. (1993). Statistical Analysis of Circular Data. Cambridge University Press, GB.
Gould, A. (1969). A regression technique for angular varieties. Biometrics, 25(4):683–700.
Hussin, A. G., Abuzaid, A. H., Ibrahim, A. I. N., and Rambli, A. (2013). De-tection of outliers in the complex linear regression model.Sains Malaysianal, 42(6):869–874.
Hussin, A. G., Fieller, N. R. J., and C., S. E. (2004). Linear regression for circular variables with application to directional data. J. Appl. Sci. Technol, 8(1-2):1–6.
Jammalamadaka, S. and SenGupta, A. (2001). Topics in Circular Statistics. World Scientific Publishing, Singapore.
Jammalamadaka, S. R. and Sarma, Y. R. (1993). Circular regression, in sta-tistical science and data analysis. K. Matsusita, VSP:109–128.
Mardia, K. V. (1972). Statistics of Directional Data. Academic Press, London. Mardia, K. V. and Jupp, P. (2000). Directional Statistics. Wiley, London. Maronna, R., Martin, R., and Yohai, V. (2006). Robust statistics, theory and
methods. Wiley, England.
Rousseeuw, P. and Leroy, A. (1987). Robust Regression and Outlier Detection. Wiley, New York.

![Figure 4: circle plots of [dist i ] xy](https://thumb-us.123doks.com/thumbv2/123dok_us/9848862.2477919/12.756.130.637.116.869/figure-circle-plots-dist-i-xy.webp)