NETWORK INTRUSION DETECTION
A Thesis
Submitted to the Faculty of
Purdue University by
Lena Ara
In Partial Fulfillment of the Requirements for the Degree
of
Master of Science in Electrical and Computer Engineering
December 2018 Purdue University Indianapolis, Indiana
THE PURDUE UNIVERSITY GRADUATE SCHOOL
STATEMENT OF COMMITTEE APPROVAL
Dr. Brian King, Co-Chair
Electrical and Computer Engineering Dr. Xiao Luo, Co-Chair
Computer Information Technology Dr. Mohamed El-Sharkawy
Electrical and Computer Engineering
Approved by:
Dr. Brian King
ACKNOWLEDGMENTS
This research work is dedicated to my father Dr. D. M. Afzal Khan, mother Mrs. Tabassum Ara for their unbeatable love and support throughout my Masters in the USA. I am thankful to my sisters for their affection and motivation. Heartfelt thanks to my advisor Dr. Xiao Luo for motivating to learn and explore in Intru-sion Detection System using Machine Learning. Her guidance has played a crucial role throughout my journey at IUPUI. I would like to thank my committee members Dr. Brian King and Dr. Mohamed El Sharkawy for their valuable feedback. I am thankful to Sherrie Tucker for her timely help during deadlines and with thesis docu-mentation. I thank all my friends for being patient and helpful during the final stage of submission. A special thanks to my Pinnacle Solutions team for their support and understanding.
TABLE OF CONTENTS
Page
LIST OF TABLES . . . vii
LIST OF FIGURES . . . ix SYMBOLS . . . xi ABBREVIATIONS . . . xii ABSTRACT . . . xiii 1 INTRODUCTION . . . 1 2 BACKGROUND . . . 3
2.1 Intrusion Detection System . . . 3
2.1.1 Host Based vs Network Based . . . 4
2.2 Machine Learning for Network Traffic Analysis . . . 5
2.2.1 Supervised Learning . . . 5
2.2.2 Unsupervised Learning . . . 6
2.3 Model Based and Instance Based . . . 6
3 SYSTEM FRAMEWORK . . . 8 3.1 Overview. . . 8 3.2 System Framework . . . 8 4 DATA SOURCES . . . 13 5 HOST CLUSTERING . . . 18 5.1 Literature Review . . . 18 5.2 Algorithms. . . 19
5.2.1 Data Fusion Algorithm . . . 19
5.2.2 Maximal Cliques Algorithm . . . 22
5.3 Merging the Clusters into One . . . 23
Page
5.5 Experimental Results . . . 25
5.5.1 Dataset I . . . 25
5.5.2 Dataset II . . . 29
5.5.3 Dataset III . . . 30
6 NETWORK INTRUSION DETECTION . . . 31
6.1 Traditional Methods for Intrusion Detection . . . 31
6.2 Literature Review of Model Merging . . . 33
6.2.1 Model Merging Based on Data Mining Approaches . . . 33
6.2.2 Ensemble Learning . . . 34
6.3 Proposed Approach for Model Merging . . . 35
6.3.1 Feature Selection . . . 35
6.3.2 Decision Region Analysis . . . 37
6.4 Merged Model with Instance Based Approach . . . 38
6.5 Results . . . 40
6.5.1 Dataset I . . . 40
6.5.2 Dataset II . . . 46
6.5.3 Dataset III . . . 50
6.5.4 Results Analysis . . . 53
7 CONCLUSION AND FUTURE WORK . . . 59
7.1 Conclusion . . . 59
7.2 Future Work . . . 60
7.2.1 More Robust Method . . . 60
7.2.2 Integrating the Models of Hosts in Cluster . . . 60
7.2.3 Dynamic Approach Towards Intrusion Detection . . . 61
REFERENCES . . . 62
LIST OF TABLES
Table Page
4.1 Description of Botnets . . . 14
4.2 Selected Network Flow Features of CTU-13 Data . . . 15
5.1 Dataset I Cross-testing F1-measure of Decision Tree . . . 25
5.2 Dataset I Cross-testing F1-measure of k-Nearest Neighbors . . . 26
5.3 Dataset I Cross-testing F1-measure of Support Vector Machines . . . 27
6.1 Random Forest Model of Dataset I Tested on Itself . . . 32
6.2 Random Forest Model of Dataset I Tested on each Host of Dataset II . . . 32
6.3 Random Forest Model of Dataset I Tested on each Host of Dataset III . . 33
6.4 Detection Rate when Maximal Clusters Tested on each Other . . . 40
6.5 False Positive Rate Maximal Clusters Tested on each Other . . . 40
6.6 Model of Dataset I Tested on Itself . . . 42
6.7 Model of Dataset I Tested on Dataset II . . . 42
6.8 Model of Dataset I Tested on Dataset III . . . 43
6.9 Dataset II - DR when Maximal Clusters Tested on each Other . . . 46
6.10 Dataset II - FPR when Maximal Clusters Tested on each Other . . . 46
6.11 Model of Dataset II Tested on Itself . . . 47
6.12 Model of Dataset II Tested on Dataset I . . . 48
6.13 Model of Dataset II Tested on Dataset III . . . 49
6.14 Dataset III - DR when Maximal Clusters Tested on each Other . . . 50
6.15 Dataset III - FPR when Maximal Clusters Tested on each Other . . . 50
6.16 Model of Dataset III Tested on Itself . . . 50
6.17 Model of Dataset III Tested on Dataset I . . . 51
6.18 Model of Dataset III Tested on Dataset II . . . 52
Table Page
A.1 Instances Count for Dataset I . . . 67
A.2 Instances Count for Dataset II. . . 67
A.3 Instances Count for Dataset III . . . 67
A.4 Dataset II Cross-testing F1-Measure of Decision Tree . . . 68
A.5 Dataset II Cross-testing F1-Measure of KNN . . . 69
A.6 Dataset II Cross-testing F1-Measure of SVM . . . 70
A.7 Dataset III Cross-testing F1-Measure of Decision Trees . . . 71
A.8 Dataset III Cross-testing F1-Measure of KNN . . . 72
A.9 Dataset III Cross-testing F1-Measure of SVM . . . 73
A.10 Random Forest Model of Dataset II Tested on Itself . . . 73
A.11 Random Forest Model of Dataset II Tested on Dataset I . . . 74
A.12 Random Forest Model of Dataset II Tested on Dataset III . . . 74
A.13 Random Forest Model of Dataset III Tested on Itself . . . 74
A.14 Random Forest Model of Dataset III Tested on Dataset I . . . 74
LIST OF FIGURES
Figure Page
2.1 Machine Learning for Host Based Intrusion Detection . . . 5
3.1 Overview of Our Model . . . 12
3.2 Overview of a Traditional Model . . . 12
4.1 Characteristics of Botnet Scenarios . . . 13
4.2 Data Distribution of Dataset I . . . 16
4.3 Data Distribution of Dataset II . . . 16
4.4 Data Distribution of Dataset III with and without Host A . . . 17
4.5 Histogram Plots of One of the Hosts of Dataset I . . . 17
5.1 Merged Cluster Illustration . . . 23
5.2 Model-Instance Based Approach . . . 24
5.3 Host Clustering for Dataset I . . . 28
5.4 Host Clustering for Dataset II . . . 29
5.5 Host Clustering for Dataset III . . . 30
6.1 Merging of Decision Boxes Starting from Upper Left [52] . . . 34
6.2 Merged Cluster for Dataset I . . . 41
6.3 Macro Average Comparison for Dataset I with NB . . . 44
6.4 Macro Average Comparison for Dataset I with LR . . . 44
6.5 Macro Average Comparison for Dataset I with RF . . . 45
6.6 Merged Cluster for Dataset II . . . 47
6.7 Macro Average Comparison for Dataset II with RF . . . 49
6.8 Merged Cluster for Dataset III. . . 51
6.9 Macro Average Comparison for Dataset III with RF. . . 52
6.10 Various Inter-Dataset Models Tested on Host B of Dataset I . . . 53
Figure Page
6.12 Various Inter-Dataset Models Tested on Host N of Dataset II. . . 55
6.13 Various Inter-Dataset Models Tested on Host A of Dataset III . . . 56
6.14 Scatter Plot of Host N Dataset II . . . 57
6.15 Scatter Plot of Host A Dataset III . . . 58
6.16 Detection Rate for Host C and D of Dataset III . . . 58
A.1 Macro Average Comparison for Dataset II with NB . . . 68
A.2 Macro Average Comparison for Dataset II with LR . . . 69
A.3 Macro Average Comparison for Dataset III with NB . . . 70
SYMBOLS χ Chi ζ Regularization factor P Probability E Expectation ||.|| Vector norm α Threshold
ABBREVIATIONS IDS Intrusion Detection System
SVM Support Vector Machines KNN K Nearest Neighbors DR Detection Rate FPR False Positive Rate TPR True Positive Rate RF Random Forests NB Naive Bayes
ABSTRACT
Ara, Lena. M.S.E.C.E, Purdue University, December 2018. Integrate Model and In-stance Based Machine Learning for Network Intrusion Detection. Major Professors: Xiao Luo and Brian King.
In computer networks, the convenient internet access facilitates internet services, but at the same time also augments the spread of malicious software which could represent an attack or unauthorized access. Thereby, making the intrusion detection an important area to explore for detecting these unwanted activities. This thesis con-centrates on combining the Model and Instance Based Machine Learning for detecting intrusions through a series of algorithms starting from clustering the similar hosts. Similar hosts have been found based on the supervised machine learning techniques like Support Vector Machines, Decision Trees and K Nearest Neighbors using our pro-posed Data Fusion algorithm. Maximal cliques of Graph Theory has been explored to find the clusters. A recursive way is proposed to merge the decision areas of best fea-tures. The idea is to implement a combination of model and instance based machine learning and analyze how it performs as compared to a conventional machine learning algorithm like Random Forest for intrusion detection. The system has been evalu-ated on three datasets by CTU-13 [1]. The results show that our proposed method gives better detection rate as compared to traditional methods which might overfit the data. The research work done in model merging, instance based learning, random forests, data mining and ensemble learning with regards to intrusion detection have been studied and taken as reference.
1. INTRODUCTION
The convenient and rapid Internet access has been facilitating many Internet services, but also continues to accelerate the spreading of malicious software. This makes the detection of malicious activities difficult. Computer networks have been playing important roles in modern society, however, their security is always at risk. We need efficient ways to protect the system. Intrusion detection [2] is a technology to protect the network from malicious activities.
The detection on network traffic is critical in preventing intrusions. Since intrusion detection is for network data with large traffic size, machine learning algorithms seem to be a good approach for handling this problem.
Utilizing our proposed data fusion along with clustering algorithms, this research work explores an approach to identify intrusions on network following the identifica-tion of maximal clusters of hosts. We have found clusters of hosts that we believe has given us a more robust model without retraining. The already learned model of hosts that are in a cluster are merged based on the decision regions obtained from their decision making trees, thus reducing the retraining cost. The decision regions of the trees of the hosts in the cluster have been merged to obtain a model. Then according to our proposed algorithm intrusion detection is done using either the model or the instance based knn approach.
Machine learning algorithms [3] [4] have been investigated for intrusion detection in the past years. Many researches are being attempted to apply machine learning techniques to this area of cybersecurity [5]. Research work by [5] implemented IDS using ML at application layer where they explain that it is challenging to stay fixed with the features. They analyzed the payload and the type of code it contains like Javascript and SQL. At host level, one or more machine learning algorithms can be deployed on the hosts of a network for identifying intrusions. Generating robust
learning models from the training data pose to be a critical component for using supervised machine learning algorithms for intrusion detection. The training needs to be efficient that relies on the huge amount of network traffic.
Definitely, there are a lot of challenges involved here. These challenges include the generation of robust learning models, systematic training methods on large size data and the periodic refreshing of detecting models for showing up the latest net-work traffic behavior and attack patterns. This research net-work focuses on intrusion detection for similar and non similar hosts on a network and new incoming data. For new incoming traffic, if the network flows are similar with regards to the intrusion detection, it might imply that these are under the attack by a hacker who is using the same hacking mechanism to attack different machines in a network. We have proposed a technique which includes model and instance based approach.
Furthermore, if the network flows are similar enough, these host then can be clustered into the same group. Finding out the similarity among network flows by comparing the flows of each host one by one to those of another host is not a vi-able solution. Hence, we proposed to employ machine learning for summarizing the network behaviors from the generated learning models. The hypothesis is that if the generated learning model based on the network flows of one host can be used to detect the intrusion flows of the other host, these two hosts should be in the same cluster. Going deeper with the research, these clusters can be merged into a bigger cluster based on the detection rate of the attack traffic. The ways to merge the decision tree models of hosts in such clusters have been studied. Merging the decision tree regions of similar hosts has been found to be the best approach for our work. We have then compared the results obtained using the proposed method with the traditional way of using machine learning methods. By the traditional machine learning methods we mean having a model achieved by training on the training set and testing on the testing set. Our proposed method is different from the traditional way where we have tried to eliminate the retraining process for the new incoming traffic and thus be more robust.
2. BACKGROUND
2.1 Intrusion Detection System
An intrusion detection system (IDS) is a system that issues alerts when malicious or abnormal activities are detected on a network that is being monitored. Intrusion detection primarily detects and reports malicious activity or anomalous traffic, there are IDS that are capable of taking actions like blocking traffic sent from suspicious IP addresses against malicious behavior.
Significant amount of work has been done in past with respect to intrusion de-tection. As mentioned in paper [6] two general approaches are popular for intrusion detection: Misuse detection, which involves patterns of known attacks to identify intrusions; and anomaly detection which aims to find the outliers from the normal patterns. Anomaly based IDS monitors network traffic and compares it against an es-tablished baseline. This baseline identifies normal and attack traffic. Intuitively, this baseline identifies the sort of bandwidth, protocols and ports and devices connected to are normal for that network and alert the administrator or user when traffic is de-tected which is aberrant, or significantly different than the baseline. In the research work described in [7] misuse detection and anomaly detection have been combined to detect unknown intrusion and achieve better detection and false positive rates. They extracted class association rules from training database and then classified the data as normal, known intrusion or unknown intrusion through the analyses of matching degree of data with the rules.
Machine learning techniques have been explored for detecting intrusions. Accord-ing to paper [8] signature based approach has high detection rate but is not efficient for novel attacks. Anomaly based methods can detect but give high false positive rate. Using machine learning, a detection model is developed at the training phase.
In this research, a comparative study of SVM, Naive Bayes, J.48 and decision table for anomaly detection on KDD99 dataset [9] has been presented. They found different results for each class when tested with different algorithms and out of the five algo-rithms no single algorithm gave high TPR for the classes. But they concluded that decision tree based technique J.48 has high overall accuracy with low false positive rate. Decision tree yielded a good result with redundant features. Their future work mentions the use of feature selection with the J.48 for better results. The research work mentioned in the paper [10] has classified attack types for intrusion detection using machine learning. The performance has been analyzed using Random Forest algorithm on Kyoti 2006+ dataset [11]. Going beyond the supervised techniques for intrusion detection, outlier detection using unsupervised method in cloud comput-ing environment has been explored by [12] [13]. Unsupervised techniques appear to be good approach because they do not require any training data set or any kind of previous knowledge for detecting the possible novel attacks.
2.1.1 Host Based vs Network Based
Based on the location in a network, IDS can be categorized into two groups: Host Based and Network Based.
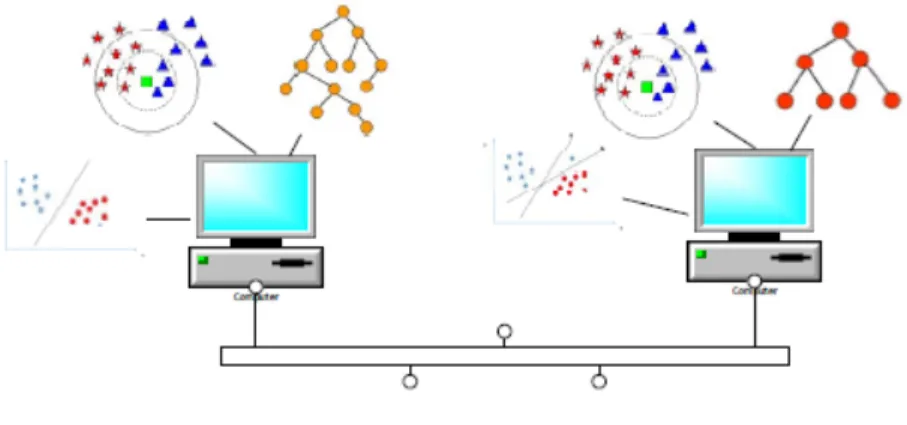
Host based IDS are at the host level as the name suggests. The traffic originating and coming to a particular host are monitored. Apart from monitoring incoming and outgoing traffic, a host based IDS can also analyze the file system of a host, users login activities, running processes, data integrity etc. As described in Figure 2.1, at host level intrusion detection, the hosts on a network can deploy one or more machine learning algorithms for intrusion detection.
Network based IDS are the types of IDS which are strategically positioned in a network for detecting any attack on the hosts of that network. IDS is placed at the entry and exit point of data from the network to the outside world, for capturing all the data passing through the network. IDS can also be strategically positioned,
Fig. 2.1. Machine Learning for Host Based Intrusion Detection
depending on the level of security needed in our network. The speed of traffic anal-ysis is important, since the network based IDS need to monitor all the data passing through the network with dropping as much little traffic as possible.
2.2 Machine Learning for Network Traffic Analysis
Machine Learning algorithms are efficient way of tackling problems with huge data. The work done by [14] have used various ML algorithms to compare and find the algorithm which gives the best accuracy. Their work shows that decision tree C4.5 classifier gives the best accuracy among Support Vector Machines, Decision tree C4.5, Bayesian networks and Naive Bayes. Feature scaling before implementing any algorithm has also been done to select the best features that give most accurate classification.
2.2.1 Supervised Learning
In supervised learning an algorithm is employed to learn a mapping function from the input variables (X) to the output variable (Y). The training dataset can be thought of as a teacher supervising the learning process, so it is called supervised
learning. The learning continues and stops when the algorithm achieves an acceptable level of performance after the algorithm iteratively makes predictions on the training data. Supervised learning includes regression and classification. Supervised machine learning algorithms like Linear Regression for regression problems, Random Forest for classification and regression problems, Support Vector Machines for classification problems are well known algorithms.
2.2.2 Unsupervised Learning
Ensuring the security of large and complex networks appears to be a challenging task. Unsupervised ML techniques have also been explored in past to study anomaly detection. Research work by [15] focuses on unsupervised learning algorithms for approaching the problem of anomalies in complex systems. They implemented Self organizing maps that overcome the dimensionality problem of network based systems.
2.3 Model Based and Instance Based
Model based approach have been extensively used for solving machine learning problems. As the name suggests there is a model to predict the output either for regression or classification. Instance based learning also called memory based learn-ing is described as the family of learnlearn-ing algorithms that compares new problem instances with instances seen in training that are stored in the memory. So, instead of performing explicit generalization, it uses memory based techniques.
As described in this research [16], the central idea of model-based is to create a custom model tailored specifically to each application. The model can even be associ-ated together with an inference algorithm. ”Typically, model-based machine learning will be implemented using a model specification language in which the model can be defined using compact code, from which the software implementing that model can be generated automatically”. The key goals of model based approach have been mentioned. These goals include the specific nature of models corresponding to the
application. The application might include a combination of clustering and classifica-tion. Describing the model based approach, in this study they focused on a framework based on Bayesian inference in probabilistic graphical models.
Model based approaches are studied in a vast area of applications including med-ical research areas. For instance model based techniques are explored in this pa-per [17]. In this research they have explored both model-based like logistic regression and model-free or non-parametric techniques like random forests, support vector ma-chines for investigating falls in patients with Parkinson’s disease. They used general-ized linear models with linear regression when the outcomes are measured on binary scale and follow Bernoulli distribution. Comparing the two techniques their research depicts scalability for different problem statements. Algorithms like Random Forest, AdaBoost, Support Vector Machines, Neural Network benefit from constant learning or retraining as optimized results are not guaranteed.
On the other hand, instance based approaches have also been used in various applications. The idea behind instance-based learning is that similar examples have similar label. KNN is instance based algorithm where selecting the optimum number of neighbors is important. Depending on the data, usually value of k is selected neither too large nor too small.
3. SYSTEM FRAMEWORK
3.1 Overview
In this research, we have experimented with three different supervised learning al-gorithms - Decision Tree, k-Nearest Neighbors and Support Vector Machines. A data fusion algorithm and host clustering algorithm are developed to group the hosts into clusters based on their known network flows. The host clustering algorithm is based on the Bron-Kerbosch algorithm [18] which is used to identify the maximal complete subgraphs (Cliques) in an undirected graph. Finally, attack traffic is identified by merged model which is a model and instance based technique. Three subsets of the publicly available botnet intrusion detection data set CTU-13 [1] are used in our work where first step is to identify the clusters of the hosts with regards to intrusion de-tection and then integrate the final model. Each of the three datasets belong to a different bot category from thirteen of the CTU-datasets.
3.2 System Framework
In this work, we have found a generalized model for our problem, so that retraining efforts are reduced for the hosts. The generalized merged model is found by first finding similar hosts. The assumption is that the network traffic flows (normal vs. attack) can be summarized and inferred by the machine learning model that is derived by the learning algorithm and the training data. If the models based on the same learning algorithm and training data of two hosts are the same or one is a subset of the other, these two hosts can be clustered into one cluster. Otherwise, they are not in the same cluster. However, different learning algorithms make use of different
optimization functions and processes to generate models. In this work, we proposed the host clustering algorithm that can make use of m different learning algorithms.
Indeed, some pre-processing steps including feature reconstruction are employed before the network flows are fed into the learning algorithms. The non-numerical values for some features, such as protocol and direction have been replaced by iden-tifiable numbers using one-hot encoding [19]. For example, TCP protocol is replaced by value 12. After pre-processing, all network flows are used to train the supervised learning algorithms to generate the learning models respectively. It is worth noting that the testing process is different from the general training and testing process. The training process is to generate the model based on all network flows of a host, the testing process is to test the correctness of the generated model on classifying the network flows of the other host. We call this testing process as cross-testing. Once the cross-testing matrices are obtained, they are further used in the Data Fusion algorithm described in the chapter Host Clustering.
In this research, we applied three widely used supervised learning algorithms: k-Nearest Neighbors, Decision Tree and Support Vector Machines. These three learning algorithms are briefly described in the following sections.
Decision Tree
Decision tree learning techniques have been used for network intrusion detection in the literature and archived competitive performances [20] [21]. There are differ-ent decision tree algorithms, such as ID3, C4.5, C5.0 and CART (Classification and Regression Trees). Decision tree algorithm such as J.48 [22] have been used for de-tecting intrusions as well. The trained model of the decision tree can be decoded and visualized as a tree structured form. Whereas, other trained models are difficult to interpret. That is one of the important differences between decision tree algorithms and other supervised learning algorithms. In this work, optimized CART which was implemented in python Scikit-Learn package, was employed. CART is very similar
to C4.5. The difference is that it supports numerical target variables (regression) and does not compute rule sets. Decision trees algorithm is considered a simple yet effective supervised ML algorithm. The trees often mimic the human level thinking which makes them simple to understand the data and provide good interpretations.
K-Nearest Neighbors
k-Nearest Neighbors (k-NN) learning technique has been used in pattern recog-nition and classification since the beginning of 1970s as a non-parametric technique. It has been studied extensively for data mining and network flow analysis [23] [24]. k-NN uses a majority vote of its neighbors to classify a data instance. k is a positive integer. If k = 1, then the data instance is simply assigned to the category of its nearest neighbor. Typically, we experiment with a different k to find the optimal k value to classify a given data set. The neighborhood distance function varies from different implementation of k-NN. The typical one is Euclidean distance which was used in this work. The k value was 2 in this work.
Support Vector Machines
Support Vector Machines (SVMs) was one of the classification algorithms evalu-ated. SVMs is a large margin classifier, and has been widely used in many different data analytic tasks and network intrusion detections [25] [26]. The SVMs classifier aims to separate the input data using hyperplanes. In order to generate a less complex hyperplane function for classification, the maximum margin between the hyperplane and the support vectors which is defined by a fraction of the input data instances is required. Support Vector Machines use a function called kernel function for non-linearly transforming the training features from a two dimensional space to a higher dimensional feature space.
That means the kernel function defines the distance measurement between the data points in the high-dimensional space. For example, if the function is radial basis function (RBF) [27].
k(x, y) = exp(−γ||x−y||2) (3.1) where x and y represent two data vectors, γ is training parameter. For making the decision boundary smoother, the parameter γ is used. Another regularization parameter ζ controls the trade-off between low training error and large margin.
The ability to learn from large feature spaces and the dimensionality independence make the support vector machines a universal learner for data classification. In our experiments libsvm [28] has been used for calculating data fusion matrices.
Describing the framework
The intuition behind this research is to identify the known attacks in a faster way without involving a retraining process like in a traditional machine learning approach. Our proposed model uses the data fusion algorithm described in below sections for calculating cross-testing matrices. By cross-testing matrix we mean the matrix obtained by training on one set of hosts and testing on each other. The similar hosts are represented on an undirected graph where an edge between two nodes represent the similarity between them. Going further, the bron kerbosh algorithm implies the output as maximal cliques which are the clusters found. The maximal cliques with largest number of nodes or hosts are combined into a bigger cluster based on their ability to detect attacks. The decision regions of this cluster has been merged according to our proposed decision region merging algorithm after the feature selection. The hosts that are outside the cluster have an instance learning based approach for detecting attacks. The basic overview is described the diagram in Figure 3.1.
The final model shown in this figure is the combination of Merged and Instance Based methods. The approach used in our research work is different than the tradi-tional model which has all data combined and trained for predictions as described in Figure 3.2.
Fig. 3.1. Overview of Our Model
4. DATA SOURCES
We evaluated the proposed system based on the aforementioned supervised learning algorithms using CTU-13 data sets. These were captured at CTU and made publicly available [1].
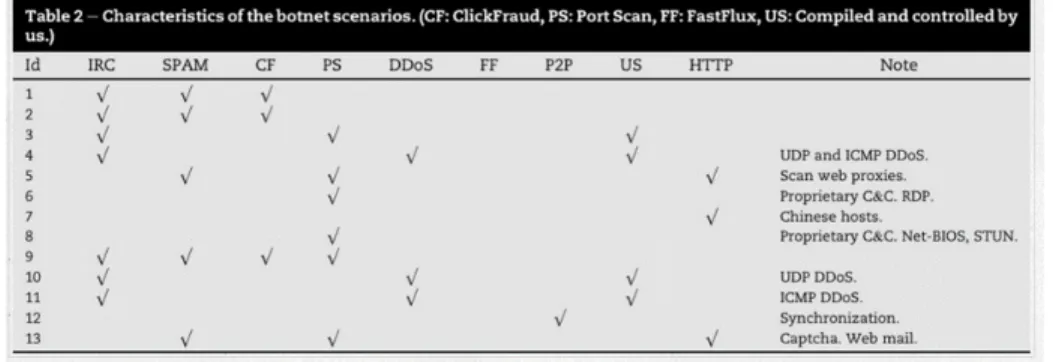
CTU-13 has 13 different datasets, each one is specified for a botnet, and totally 7 botnet viruses are analyzed [29]. CTU labelled the traffic as: Background, Bot-net, C&C Channels and Normal. In our experiments, we used the three subsets of the CTU-13 data sets which contain 6 different characteristics of the botnet attack scenarios, such as ClickFraud, Port Scan, DDoS and so on.
Fig. 4.1. Characteristics of Botnet Scenarios
There are 13 different sub sets covering different botnet malwares with traffic labels: Background, Botnet, and Normal. The CTU-13 dataset consists of thirteen captures (called scenarios) of different botnet samples. On each scenario a specific malware was executed. Figure 4.1 shows the characteristics of the botnet scenarios as provided in the CTU website. Table 4.1 describes the general types of botnet that are a network security threat.
Table 4.1. Description of Botnets
Botnet Description
IRC Bot Scripts that connect to Internet Relay Chat as a client [30] SPAM Emails about counterfeit goods and security issues
DDOS Distributed Denial of Service attack targets a system denying services to P2P Decentralized botnet without C and C servers
We used 10, 2 and 13 (I, II and III) subsets for our experiments. Since the original data sets have all the network flows of the whole network in one file, the flows are grouped according to the destination IP addresses. Each unique IP address is treated as a host. After grouping the network flows, we found that some of the hosts only contain normal and background network flows. Hence, those hosts are excluded. Only the hosts that contain both normal and botnet attack flows are kept for further analysis.
Following the process described above, in the end, there are total of 16 hosts that are selected for identifying the host clustering in Dataset I, 21 hosts for Dataset II and 18 hosts for Dataset III. 10 network flow features out of 13 are used for the proposed host clustering algorithms. The network flow features are listed in following Table 4.2. For Datasets I and III, experiments are done considering all of the data of each host. For Dataset II, 75 percent of host data has been considered and for testing all of the host data has been considered. There are few hosts in Dataset II with either one normal or botnet instance, those hosts are eliminated in the similar hosts calculation step, but are included as unseen data for testing.
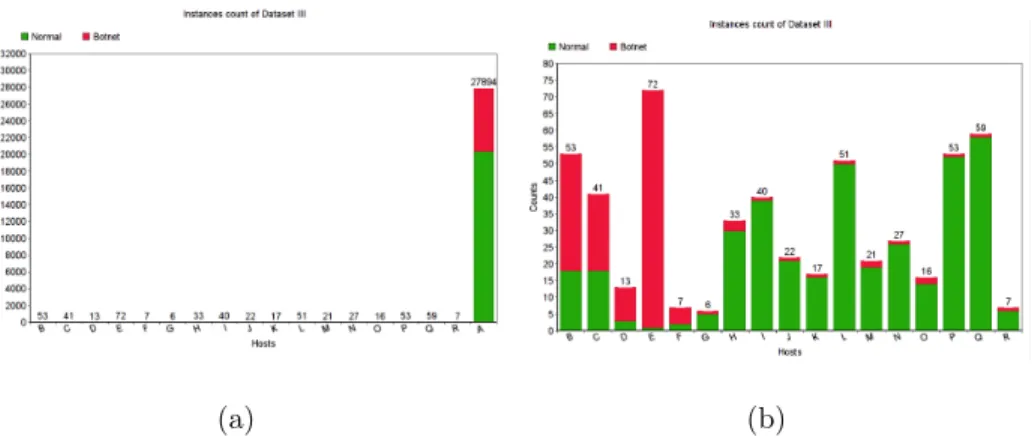
Before beginning further analysis, it is always good to have a look at the data. In Figures 4.2 and 4.3, counts of normal and botnet instances are shown for the Datasets I and II respectively. Dataset II has 21 hosts, since for this dataset, results are calculated 75 percent cross validation, so the hosts with either 1 normal or 1 botnet are not considered here, they are included for testing only. The counts of instances
for each host of datasets are shown in Tables A.1 to A.3 in the Appendix. Data distribution for Dataset III is shown in Figure 4.4. The purpose of showing data distribution with and without Host A is to give a clear picture of the distribution because the number of instances of this host is very large as compared to others.
Table 4.2. Selected Network Flow Features of CTU-13 Data
Features Description
Duration Duration of the connection in seconds Protocol Type of the protocol (TCP, UDP, ICMP)
DPort The port of the connection destination SPort The port of the connection source
dTos Type of Service from destination to source sTos Type of Service from source to destination SrcBytes Total bytes from source to destination TotBytes Total bytes of the flow
TotPkts Total packets of the flow Dir Direction of the flow
Viewing the histogram plots are a quick way for getting an idea of the distribu-tion of each attribute. A count of the number of observadistribu-tions in each bin can be calculated by grouping data into bins using histograms. The histogram plot of host C of Dataset I is shown below in Figure 4.5, where we can clearly see that label 3 (botnets) represented by histogram 11 are very less as compared to label 2 (normals). We can also see that the source ports represented by histogram 2 with less values are also very few from its histogram plot.
Fig. 4.2. Data Distribution of Dataset I
(a) (b)
Fig. 4.4. Data Distribution of Dataset III with and without Host A
5. HOST CLUSTERING
5.1 Literature Review
Before implementing our ideas, it is good to study the work that has been done in past. Previous research has been done to cluster or classify hosts based on the traffic behavior or host roles. Wei and colleagues studied host clustering based on traffic behavior profiling [31].
Another research work [32] in host clustering has been done by Xu and colleagues. It includes analyzing behavior of the end hosts in the same network prefixes by consid-ering both host and network level information. A network aware behavior clustconsid-ering was implemented in the research, where bipartite graphs were implemented to model network traffic. Bipartite graph implementation is obtained based on the communi-cation between source and destination. The bipartite graph was then divided into sub-graphs which represent each source or destination host in the network. The spec-tral clustering algorithm were used to cluster the end hosts in the same network prefixes.
Some research has used the supervised learning algorithms to classify hosts based on their roles in the network [33]. Some host roles are clients, whereas some are email servers, etc. Because of the huge volume of network traffic and overlap among host roles, modeling host roles based on network flow data is challenging. Derived features based on the network flows, such as number of unique host system ports, standard deviation of ports, number of most often used port, number of unique protocols have been used to identify the roles. However, since host behaviors and roles can change over time, the learning models need to be updated over time.
On the other end, unsupervised and supervised learning algorithms, using flow or packet based data have been investigated for intrusion detection system (IDS) and
anomaly detection systems (ADS) since long. Usually the performance metrics of the algorithms are detection rate and false alarm (positive) rate. Many researches [3] [4] [34–38] proposed and explored different machine learning mechanisms for improving the detection rate and reducing the false positive rate and detecting different types of attack behaviors. However, the common challenge is how often to update the generated learning models and whether a generated learning model can be directly applied to a new host without training process. To the best of our knowledge, our research is the first to cluster the hosts based on the cross-testing using the generated models. The following section explains the algorithms that are implemented for host clustering.
5.2 Algorithms
5.2.1 Data Fusion Algorithm
If the model generated by the flows of host A can correctly classify all the network flows of host B and vice versa, that means the network flows patterns of host A and B are very similar to each other. Hence, host A and B can be clustered into the same group. F1-measure (given in Formula 5.1) is used to evaluate the correctness of the cross-testing. Given N hosts within a network, the cross-testing F1-measure values will be stored in a matrix as Formula 5.2.
F1 = (2∗T rueP ositive)+2∗F alseN egativeT rueP ositive +F alseP ositive (5.1)
L= 1 F11,2 ... F11,N F12,1 1 ... F12,N . . . . F1N,1 F1N,2 . 1 (5.2)
In L, F1i;j is the F1-measure of testing the network flows of host j using the machine learning model that is generated on host i based on its network flows. F1i;i represents F1-measure of testing the network flows of host i using the machine learning model that is generated on host i. Essentially, all the values of F1i;i is 1. In this research, a data fusion algorithm is designed to integrate the cross-testing F1-measure matrices (L) of different learning algorithms, then generate host clusters. Given N hosts in the network and m machine learning algorithms, the data fusion algorithm is given in Algorithm 1. Algorithm 1 calls Algorithm 2 to identify the maximal host cluster in a network. Any host in the maximal host cluster are similar to all other hosts within the cluster. In this work, the hosts within the network are treated as nodes in an undirected graph, whereas, the edges between the hosts are the similarities between the hosts. The similarity is reflected by the cross-testing F1-measure. An edge (i;j) exists only when F1(i;j) and F1(j;i) are 1 for all cross-testing F1-measure matrices corresponding to the machine learning algorithms. When considering 75-100 cross-validation threshold may be selected a value less than 1, for example 0.6.
Algorithm 1 Data-Fusion-Algorithm
Input: Cross-testing F1-measure matrices (L1, L2, . . . , Lm),α Output: Cluster L=L1 +L2 +· · ·+Lm V ertices=∅ Edges=∅ for i in (1, . . . , N) do for j in (1, . . . , N) do
if (Li,j =Lj,i)&&(Lj,i≥α)&&(i6=j) then V ertices=V ertices∪ {i} ∪ {j} Edges= (i, j) end if end for end for X =∅ R=∅ P =V ertices
Algorithm 2 Maximal-Cliques Input: R, P, X, Edges Output: Cliques if (P =∅)&&(X =∅)then Cliques=R end if
for each vertexv in P do
N(v) = Neighbor Set of v based on Edges
R =M aximal−Cliques(R∪ {v}, P ∩N(v), X ∩N(v), Edges) P =P \v
X =X∪v end for
5.2.2 Maximal Cliques Algorithm
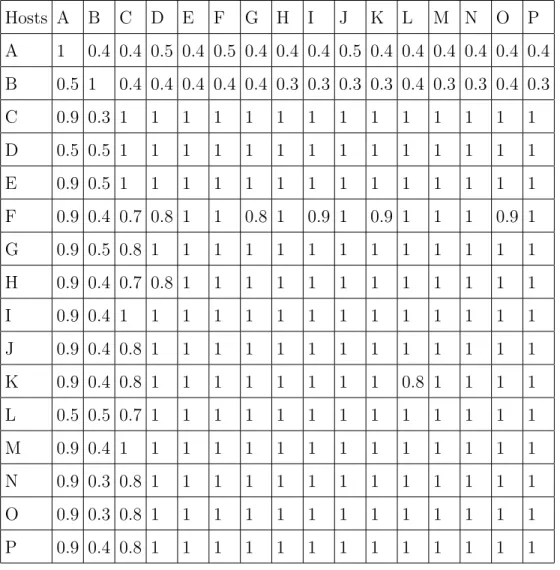
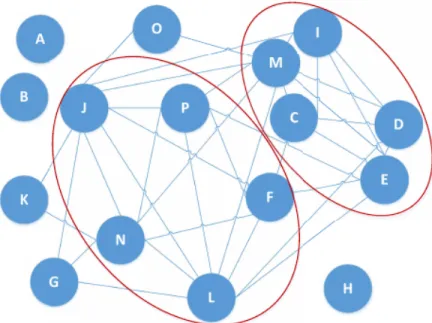
The Algorithm 2 works as Bron-Kerbosch algorithm [18] which is used to find the maximal cliques in an undirected graph. Based on the training and cross-testing processes described in section 5.2.1, three cross-testing F1-measure matrices are gen-erated through applying the three supervised machine learning algorithms. Tables 5.1 to 5.3 present the cross-testing F1-measure matrices of the three learning algorithms. The rows of each matrix represent the hosts of which the network flows are used to generate the learning models. The columns represent the hosts of which the network flows are used to cross-test the learning model to gain the F1-measure values. An undirected graph based on integrating the three F1-measure matrices is presented as Figure 5.1. Through applying the data fusion and maximal cliques identifying algo-rithms, hosts C, D, E, I and M are identified in the same cluster and hosts P, J, F, L, N in another cluster. These two are the largest clusters within the selected 16 hosts. Host A, B and H have no similarity with any of the other hosts and are outside the clusters.
5.3 Merging the Clusters into One
The maximal clusters obtained are merged into one cluster using the detection rate and false positive rate for the attack traffic. That means the tree structures of the hosts in the two clusters are merged so that each of the cluster has its own decision making model. The data of each cluster is tested on each others cluster model. Since the merged model of each cluster detected the hosts of other clusters with detection rate of 1 and very less false positive rate, they are merged into one bigger cluster. Figure 5.1 shows the merged cluster. The goal of this chapter is to provide an overview of the implementation, the exact results are tabulated in the Results chapter.
5.4 Merged Model and Instance Based Approach
The merged model explained in the above section works well for most of the hosts. But it is possible that some of the hosts have very different traffic pattern that the merged model is unable to detect the attack traffic. Such hosts have an instance based KNN model to predict the oncoming traffic. This is explained by the flowchart in the Figure 5.2.
5.5 Experimental Results 5.5.1 Dataset I
Tables 5.1 to 5.3 present the cross-testing F1-measure matrices of the three learn-ing algorithms. Based on the data fusion algorithm explained above, the followlearn-ing maximal clusters are obtained (shown in Figure 5.3). Figure 5.3 shows the edges that correspond to the similarity between hosts, the maximal clusters with maximum number of hosts are CDEIM, FJLNP and JLMNP. However, for the ease of viewing two of the three clusters are highlighted in this figure.
Table 5.1. Dataset I Cross-testing F1-measure of Decision Tree
Hosts A B C D E F G H I J K L M N O P A 1 0.06 1 1 1 1 1 1 1 1 1 1 1 1 1 1 B 0.5 1 0.4 0.4 0.4 0.4 0.4 0.4 0.4 0.4 0.5 0.5 0.4 0.5 0.4 0.5 C 0.9 0.2 1 1 1 1 1 1 1 1 1 1 1 1 1 1 D 0.9 0.2 1 1 1 1 1 1 1 1 1 1 1 1 1 1 E 0.9 0.2 1 1 1 1 1 1 1 1 1 1 1 1 1 1 F 0.9 0.2 1 1 1 1 1 1 1 1 1 1 1 1 1 1 G 0.1 0.4 0.6 0.6 0.6 1 1 1 0.6 1 0.9 1 0.9 1 0.9 0.9 H 0.4 0.5 0.6 0.8 0.8 0.6 0.7 1 0.7 0.6 0.8 0.6 0.8 0.8 0.7 0.8 I 0.9 0.2 1 1 1 1 1 1 1 1 1 1 1 1 1 1 J 0.9 0.2 1 1 1 1 1 1 1 1 1 1 1 1 1 1 K 0.1 0.4 0.6 0.6 0.5 1 1 1 0.6 1 1 1 0.9 1 0.9 0.8 L 0.9 0.2 1 1 1 1 1 1 1 1 1 1 1 1 1 1 M 0.9 0.2 1 1 1 1 1 1 1 1 1 1 1 1 1 1 N 0.9 0.2 1 1 1 1 1 1 1 1 1 1 1 1 1 1 O 0.1 0.4 0.6 0.6 0.5 1 0.6 1 0.7 1 0.7 1 1 0.8 1 0.7 P 0.9 0.2 1 1 1 1 1 1 1 1 1 1 1 1 1 1
Table 5.2. Dataset I Cross-testing F1-measure of k-Nearest Neighbors Hosts A B C D E F G H I J K L M N O P A 1 0.2 1 1 1 1 1 1 1 1 1 1 1 1 1 1 B 0.0 1 0.0 0.0 0.0 0.0 0.0 0.1 0.1 0.0 0.1 0.0 0.1 0.0 0.0 0.0 C 0.9 0.1 1 1 1 1 1 1 1 1 1 1 1 1 1 1 D 0.9 0.1 1 1 1 1 1 1 1 1 1 1 1 1 1 1 E 0.9 0.1 1 1 1 1 1 1 1 1 1 1 1 1 1 1 F 0.9 0.1 1 1 1 1 1 1 1 1 1 1 1 1 1 1 G 0.9 0.1 1 1 1 1 1 1 1 1 1 1 1 1 1 1 H 0.9 0.3 1 1 1 1 1 1 1 1 1 1 1 1 1 1 I 0.9 0.2 1 1 1 1 1 1 1 1 1 1 1 1 1 1 J 0.9 0.2 1 1 1 1 1 1 1 1 1 1 1 1 1 1 K 0.9 0.3 1 1 1 1 1 1 1 1 1 1 1 1 1 1 L 0.9 0.1 1 1 1 1 1 1 1 1 1 1 1 1 1 1 M 0.9 0.2 1 1 1 1 1 1 1 1 1 1 1 1 1 1 N 0.9 0.2 1 1 1 1 1 1 1 1 1 1 1 1 1 1 O 0.9 0.2 1 1 1 1 1 1 1 1 1 1 1 1 1 1 P 0.9 0.2 1 1 1 1 1 1 1 1 1 1 1 1 1 1
Table 5.3. Dataset I Cross-testing F1-measure of Support Vector Machines Hosts A B C D E F G H I J K L M N O P A 1 0.4 0.4 0.5 0.4 0.5 0.4 0.4 0.4 0.5 0.4 0.4 0.4 0.4 0.4 0.4 B 0.5 1 0.4 0.4 0.4 0.4 0.4 0.3 0.3 0.3 0.3 0.4 0.3 0.3 0.4 0.3 C 0.9 0.3 1 1 1 1 1 1 1 1 1 1 1 1 1 1 D 0.5 0.5 1 1 1 1 1 1 1 1 1 1 1 1 1 1 E 0.9 0.5 1 1 1 1 1 1 1 1 1 1 1 1 1 1 F 0.9 0.4 0.7 0.8 1 1 0.8 1 0.9 1 0.9 1 1 1 0.9 1 G 0.9 0.5 0.8 1 1 1 1 1 1 1 1 1 1 1 1 1 H 0.9 0.4 0.7 0.8 1 1 1 1 1 1 1 1 1 1 1 1 I 0.9 0.4 1 1 1 1 1 1 1 1 1 1 1 1 1 1 J 0.9 0.4 0.8 1 1 1 1 1 1 1 1 1 1 1 1 1 K 0.9 0.4 0.8 1 1 1 1 1 1 1 1 0.8 1 1 1 1 L 0.5 0.5 0.7 1 1 1 1 1 1 1 1 1 1 1 1 1 M 0.9 0.4 1 1 1 1 1 1 1 1 1 1 1 1 1 1 N 0.9 0.3 0.8 1 1 1 1 1 1 1 1 1 1 1 1 1 O 0.9 0.3 0.8 1 1 1 1 1 1 1 1 1 1 1 1 1 P 0.9 0.4 0.8 1 1 1 1 1 1 1 1 1 1 1 1 1
5.5.2 Dataset II
The cross-testing matrices obtained by using Dataset II and Dataset III are shown in the Appendix Tables A.4 to A.6 and A.7 to A.9 respectively. For Dataset II cross testing matrices are obtained by training on 75 percent and testing on all of the data which also includes the subset (remaining 25 percent). Since there are few hosts that have only one instance of botnet, they are not considered while finding the similar hosts from cross-testing matrices. Leaving such hosts, 11 hosts are selected from 21 of them. Since the cross testing matrices show good F1 scores, the threshold has been taken as 1 for Dataset II as well.
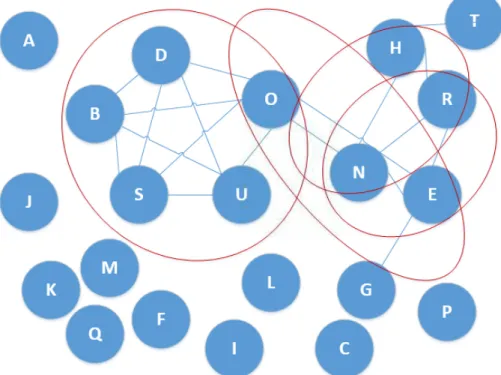
The Figure 5.4 shows the maximal clusters using maximal cluster algorithm. There are 4 maximal clusters with maximum hosts BDOSU, ENO, ENR and HNR.
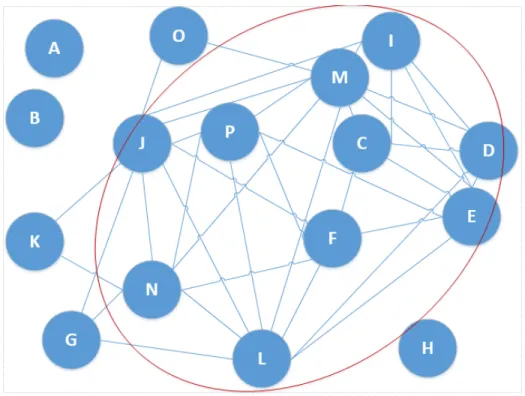
5.5.3 Dataset III
18 hosts have been found. The cross testing matrices using decision tree, KNN and SVM machine learning algorithms for this dataset are in the Appendix (Tables A.7 to A.9). Figure 5.5 shows the host clustering.
6. NETWORK INTRUSION DETECTION
6.1 Traditional Methods for Intrusion Detection
Considering intrusion detection as a crucial way of protecting network from mali-cious activities, researchers have been trying to minimize the threat by various innova-tive ways. These work include combining anomaly detection and misuse detection [6] using genetic network programming which is a data mining technique. Research work by [39] have enhanced K-Means [40] clustering algorithm to a more robust method underlying the fact that if the clusters are empty in initial iterations over-splitting may be avoided by merging the overlapping clusters, they called it as Y-Means al-gorithm for intrusion detection. ML alal-gorithms like Multilayer Perceptron, SVM, Multinomial Logistic Regression, Naive Bayes, J.48, Bayesian network have proved to give good detection results [5]. Probability based algorithm like Naive Bayes have been implemented for intrusion detection [41–43]. The Naive Bayes Classifier tech-nique is based on the Bayesian theorem [44] [45] and is believed to be good approach for high dimension data. Known for its simplicity, Naive Bayes can often outperform more sophisticated classification methods. Linear machine learning techniques like logistic regression has also been used for detecting intrusions [46] [47]. Logistic re-gression is an efficient way for binary classification and uses predictive analysis for assigning observations to a discrete set of classes. Unlike linear regression which gives continuous number values, logistic regression transforms its output using the sigmoid function to return a probability value. This probability value can then be mapped to two or more discrete classes [48] [49].
An extension of the bagged decision trees is Random Forests which aims to reduce overfitting problem. Trees are constructed in a way intended to reduce the correlation between various individual classifiers. These classifiers are constructed using the
samples of the training data with replacement. Intuitively, instead of greedily choosing the best split point in the construction of each tree, for each split only a random subset of features are considered. Random Forest has been used in past for obtaining optimal model for intrusion detection [50]. Significant amount of work demonstrates that Random Forest has been used for analyzing network traffic data.
Random forest has been used for feature selection and SVM has been trained on the selected features for intrusion detection on the KDD dataset [9] [51].
Considering the significant amount of work in Intrusion detection using machine learning techniques like Random Forest, we compared the results obtained from our proposed model with the random forests. We have compared the results from our model vs the results obtained by a retrained model using the random forest with 100 trees and split points chosen from a random selection of 3 features. Tables 6.1 to 6.3 show the results using this algorithm trained on Dataset I and tested on each host of itself and Dataset II and III respectively.
Table 6.1. Random Forest Model of Dataset I Tested on Itself Hosts A B C D E F G H I J K L M N O P Avg DR 1 0.78 1 1 1 1 1 1 1 1 1 1 1 1 1 1 0.98 FPR 0 0 0.02 0 0 0 0 0 0 0 0 0 0 0 0 0 0.0012
Table 6.2. Random Forest Model of Dataset I Tested on each Host of Dataset II
Hosts A B C D E F G H I J K L M N O P Q R S T U Avg
DR 1 0.83 1 1 1 0.94 1 0.83 1 0.34 0.95 1 1 0.33 0.52 0.34 1 1 0.83 0.86 0.890.84
FPR 0 0 0 0 0 0 0 0 0 0 0 0 0 0 0 0 0 0 0 0 0 0
Similarly, the results using retrained random forest models for Datasets II and III are shown in the Appendix section. Tables A.10 to A.12 show the results using Dataset II and Tables A.13 to A.15 using Dataset III.
Table 6.3. Random Forest Model of Dataset I Tested on each Host of Dataset III
Hosts A B C D E F G H I J K L M N O P Q R Avg
DR 0.81 0.68 0.65 0 0.23 1 0 0.34 0 1 0 1 0 1 0 0 0 0 0.37 FPR 0.04 0 0 0 0 0.5 0 0 0 0 0 0 0 0 0 0 0 0 0.03
6.2 Literature Review of Model Merging
Some work done in the past has been studied and implemented for merging the decision trees. In this research work [52], split point selection approach has been used instead of tree-growing approaches. They exploited the geometry of the attribute space by representing each tree as a set of decision regions or iso-parallel boxes. The merging of k decision trees calls for creating a box set for each of the k trees. As mentioned in their work, computing the label for the two boxes after merging is easy when both have the same labels, it is also assigned the same label. Figure 6.1 describes the merging of decision boxes of two decision trees. One of the strategies used by them to label the intersecting area is averaging the two class probability distributions and selecting the class with the highest probability as the associated label.
Another work by [53] is a survey where they analyzed merging decision trees by data mining approaches. Motivation behind the merging is to generalize the knowledge contained in the models. A larger data set can be split into smaller parts either naturally or artificially. Local models are created using local data sets which provide training examples.
6.2.1 Model Merging Based on Data Mining Approaches
As referred in [52] learning and combining rules on disjoint subsets have been implemented. An algorithm is used to generate the rules on each subset of the training data which are used to construct the merged model. A combination of rules that is
Fig. 6.1. Merging of Decision Boxes Starting from Upper Left [52]
best for the dataset is used. The approach combines the rules into new rules and convert the decision trees from two models into decision rules [52].
6.2.2 Ensemble Learning
Ensemble methods utilize multiple learning algorithms to achieve better predic-tive performance. An ensemble can be described as a supervised learning algorithm, because it can be trained and then used for making predictions. This method tend to yield better results when the models are significantly diverse. This method consists in combining the predictions of various models into one prediction. The ensembler imple-ments techniques to combine the predictions such as bootstrap aggregating whereas model merging combines the models.
6.3 Proposed Approach for Model Merging 6.3.1 Feature Selection
Feature selection is a process that selects those features from the dataset that contribute most to the prediction [54]. Possessing irrelevant features may decrease accuracy of models. The advantages of performing feature selection before modeling include reduced overfitting, better accuracy and reduced training time. Generally feature selection is used to select the features that will give expected good results after training, but we used feature selection not for retraining the model but to see which of the features have the best relation with the labels. Feature selection can be used for selecting best features or for dimensionality reduction, either to improve estimators accuracy scores or to boost their performance on datasets. Main approaches are described below:
1. Univariate Selection: This selection utilizes statistical tests to select those features that have the strongest relationship with the output variable. In our exper-iments, we have used the chi-squared (chi2) statistical test for non-negative features
to select four of the best features. Chi2 feature selection [55] is an efficient way of
selecting best features in statistics, it is applied for testing the independence of two events, where according to probability concepts, two events A and B are defined to be independent if: P(AB) =P(A)P(B) (6.1) or, P(A|B) = P(A)P (6.2) and P(B|A) = P(B) (6.3)
For usingχ2for feature selection, a valueχ2is calculated between each feature and
the target, and the desired number of features with the best χ2 scores are selected. The idea behind this is that if a feature is independent to the target, it is uniformative for classifying observations [56].
χ2 = n X i=1 (Oi−Ei)2 Ei (6.4) where,Ei is the expected observations in class i if there was no relationship between the feature and target. Oi represents the number of observations in class i.
2. Recursive Feature Elimination: This technique as the name suggests recursively removes attributes and builds a model on those attributes that remain. Model accu-racy is the metrics used to identify which attributes and combination of attributes contribute the most to predicting the target attribute.
3. Principal Component Analysis: Principal Component Analysis (PCA) uses linear algebra for transforming the dataset into a compressed form. This technique is termed as data reduction technique. One of the properties of PCA is that the number of dimensions or principal components can be chosen in the transformed result. This is a good technique if the dataset is highly dimensional.
In our research work, while experimenting with the dataset, we observed that the attack traffic shows lower source port number and lesser duration than the normal traffic. A recursive algorithm has been proposed that does the classification after univariate selection of features. However, the generic algorithm can be applied to any number of features to be merged based on their merging criterion which is explained by The Algorithm 3.
Algorithm 3 Algorithm-for-Decision-Area Input: Features
Output: Decision Regions
Feature Ranking(Features) ←U nivariate(chi2) i←1
F ←F eatureRanking(F eatures) while (F! =∅)&&i≤count(F)do
Des Reg = Create Decision Regions for feature Fi of all datasets F =F \Fi
i=i+ 1
Algorithm-for-Decision-Area(F) return Des Reg
end while
6.3.2 Decision Region Analysis
Maximal cluster algorithm gave us the hosts that are clustered in a group. We have analyzed the tree regions of these hosts. Decision tree region analysis is important for the merging of model into one. The decision tree structures of the hosts that are found in a cluster are converted into decision regions. The best feature that is selected based on information gain is at the root of the tree. For example, for Dataset I four tree structures corresponding to hosts C, D, E and I have source port number as root node. The tree structure of Host M has duration as root node. Although the root node of Host M is different than the others, the cross-testing matrices demonstrate that it can also be used to detect the botnets from the normal for all five hosts. That means the botnets traffic that hit to these five hosts share the same characteristics: lower source port numbers and short duration.
After observing that botnet traffic demonstrates a lower source port number and shorter duration, algorithm 3 has been implemented for merging. The primary idea behind this to obtain the lower bound for the source port and duration in our case.
6.4 Merged Model with Instance Based Approach
The maximal clusters obtained from Bron Kerbosch algorithm are merged into one final cluster on the basis of the high detection rate and low false positive rate for attack traffic which is given by the formula of merged model of bigger maximal clusters, tested on each other.
DR = N umberof DetectedAttacks
T otalN umberof AttackConnections (6.5)
F P R= N ormalDetectedasAttacks
T otalN umberof N ormalConnections (6.6) This technique merges the merged models of these clusters into one model. Maxi-mal cluster identification can help identify the anoMaxi-maly behaviors and obtain a generic model which can detect anomalies without retraining. After the tree structure anal-ysis of the hosts identified in the cluster, their trees have been converted to decision regions and merged using the Algorithm 3 Recursive-Algorithm defined in Section 6.3.1. The merged model detects the attack and normal traffic from the similar hosts well and most of the other hosts as well. The hosts whose traffic goes undetected by this merged model use the instance based learning approach to have their attack traffic detected. This eliminates the need of refreshing and retraining all of the data. Instance based learning is also called as memory based learning where instead of ex-plicit generalization, new problem instances are compared with the instances seen in training. Hypotheses is constructed directly from the training instances themselves. So, it has the ability to adapt its model to previously unseen data. They may use a new instance and not the old instance. K-nearest neighbor algorithm is one of the instance based learning algorithm. The subset of or the training set is stored.
When predicting the class of the new instance, decision is made based on the com-puted distance or similarities between this instance and the training instance. The Algorithm 4 proposed combines both the merged model and instance based for de-tecting the attack. The hosts outside the cluster have a KNN. However, there are few hosts which are not in the cluster but their attack traffic is detected by the model. Since, they are outside the cluster, they should be tested with the KNN of the hosts outside the cluster. For testing with other datasets which is new a new set of data for the model, either the model or instance based detects an attack, that instance is considered attack. This is described in the Algorithm 4 below:
Algorithm 4 Attack Traffic Detecting Algorithm
Input: Merged Model of Cluster, Instance Based method of outside Cluster hosts, Test Dataset
Output: Optimum DR and FPR for each hosth in Datasetdo
DR = DR using Merged Model F P R = FPR using Merged Model end for
for each hosth in Datasetdo
DR = DR using Instance Based Approach F P R = FPR using Instance Based Approach end for
6.5 Results 6.5.1 Dataset I
We tested the algorithm on three datasets where all experiments are done on the hosts for obtaining the model and host data is used for testing. Using the algorithm and experiments described in above sections, Dataset I which has 16 hosts, it is found that there are 11 clusters with 3 maximal cliques with maximum number of hosts. These clusters have their models obtained by merging the models of their hosts. That means if hosts C, D, E, I and M are in a cluster, the clusters model will be obtained by merging the model of its hosts. These clusters models are tested on every other cluster based on the detection rate and false positive rate for attack traffic as criterion. The hosts of clusters that give high detection rate and low false positive rate are merged again to obtain a final cluster. Tables 6.4 and 6.5 show the detection rate and false positive rate of merged model of clusters when tested on other maximal clusters.
Table 6.4. Detection Rate when Maximal Clusters Tested on each Other Clusters CDEIM FJLNP JLMNP
CDEIM 1 1 1
FJLNP 1 1 1
JLMNP 1 1 1
Table 6.5. False Positive Rate Maximal Clusters Tested on each Other Clusters CDEIM FJLNP JLMNP
CDEIM 0.1 0.03 0.04 FJLNP 0.1 0.004 0.005 JLMNP 0.1 0.004 0.005
Fig. 6.2. Merged Cluster for Dataset I
Based on high detection rate and low false positive rate for attack traffic, it can be inferred that their performance is good with respect to detecting attack traffic. As seen from these tables, the hosts C, D, E, I, M, F, L, P, J, N can be put into one cluster which is shown in Figure 6.2. The most effective way to integrate the decision tree models of these hosts have been found to be converting the decision trees of each host to decision region and merging recursively. According to Algorithm 4, the hosts outside the cluster will utilize the instance based learning, in our case we used KNN. The average detection rate and false positive rate of all hosts obtained using the model are shown in the column Average which is the macro average. They are calculated using the Formula 6.7 and 6.8. Results are tabulated in Table 6.6. Here n is the number of hosts of the respective dataset. As expected the method performs well on itself.
AvgDR= Pnn=1DRn
n (6.7)
AvgF P R = Pnn=1F P Rn
n (6.8)
Table 6.6. Model of Dataset I Tested on Itself Model Based Approach
Hosts C D E I M F J L N P DR 1 1 1 1 1 1 1 1 1 1 FPR 0 0 0 0 0 0 0 0 0 0
Instance Based Approach A B O K G H 1 1 1 1 1 1 0 0 0 0 0 0 Average All 1 0
Inter-Dataset Testing using Model of Dataset I
In this section, the proposed method for Dataset I has been tested on the other datasets considered. They are Datasets II and III which belong to Neris and Virut bot category respectively. For Dataset II all the hosts were detected by the merged cluster model of Dataset I which shows that our method performed well with the unseen data. For Dataset III, few hosts were not detected by merged model of Dataset I, so according to our Algorithm 4, they are should ideally be detected by the KNN model of Dataset I. The results are shown in Table 6.8.
Table 6.7. Model of Dataset I Tested on Dataset II Merged Model Based
Hosts A B C D E F G H I J K L M N O P Q R S T U Avg DR 1 1 1 1 1 1 1 1 1 1 1 1 1 1 1 1 1 1 1 1 1 1 FPR 0 0 0 0 0 0 0 0 0 0 0 0 0 0 0 0 0 0 0 0 0 0
Table 6.8. Model of Dataset I Tested on Dataset III Model Based Approach
Hosts A B D G H I J L M N P Q R DR 1 0.85 0.6 1 1 1 1 1 1 1 1 1 1 FPR 0.04 0 0 0 0 0 0 0 0 0 0 0 0
Instance Based Approach
C E F K O 1 0.79 1 1 1 0 0 0.5 0 0 Average All 0.95 0.03
Comparison with Traditional Methods
Comparing the results achieved on unseen data using the proposed method with respect to the traditional methods including Naive Bayes, Logistic Regression and Random Forest demonstrate that our method is more robust. Working with our subsets, a Gaussian distribution [57] is assumed because the probabilities for input variables using the Gaussian Probability Density Function can be estimated easily. NB and LR performance is low as compared to Random Forest. Our approach has results that are comparable to RF. Figures 6.3 and 6.4 show the comparison of our model with NB and LR respectively.
Figure 6.5 shows the comparison with RF. Although the FPR is lower in both the cases, the detection rate using our technique is much better than using the random forest. The random forest model of Dataset III (Figure 6.9, Section 6.5.3) on itself shows good results but it appears to be overfitting the data, that’s why the retrained model of Dataset I didn’t give acceptable detection rate here. Thus, our method solves the overfitting problem in addition to reducing the retraining efforts.
Fig. 6.3. Macro Average Comparison for Dataset I with NB
6.5.2 Dataset II
Similar approach has been tested on Dataset II. From the previous results section for Dataset II, there are four maximal clusters with maximum hosts, BDOSU, ENO, HNR and RNE. Each of these clusters have a merged model that is tested on each other for detection rate and false positive rate. The Tables 6.9 and 6.10 demonstrate these results.
Table 6.9. Dataset II - DR when Maximal Clusters Tested on each Other Clusters BDOSU ENO HNR ENR
BDOSU 1 1 1 1
ENO 1 1 1 1
HNR 1 1 1 1
ENT 1 1 1 1
Table 6.10. Dataset II - FPR when Maximal Clusters Tested on each Other Clusters BDOSU ENO HNR ENR
BDOSU 0 0.9 0.9 0.9
ENO 0 0 0 0
HNR 0 0 0 0
ENR 0 0 0 0
Based on the results tabulated these tables, the big cluster obtained is by merging ENO, HNR and ENR. The final cluster E, N, O, H, R is highlighted in Figure 6.6.
As described by our method, the hosts E, N, O, H, R have an integrated model. However, the hosts outside have instance based learning methods. The results are tabulated in Table 6.11. The point to be noted down here is that although the integrated model of cluster could detect all the traffic for its own hosts (even outside
Fig. 6.6. Merged Cluster for Dataset II
the cluster) but according to our proposed algorithm, the hosts outside the cluster should have an KNN towards detecting the attack.
Table 6.11. Model of Dataset II Tested on Itself Merged Model Based
Hosts E N O H R DR 1 1 1 1 1 FPR 0 0 0 0 0
Instance Based Approach A B C D F G I J K L M P Q S T U 1 1 1 1 1 1 1 1 1 1 1 1 1 1 1 1 0 0 0 0 0 0 0 0 0 0 0 0 0 0 0 0 Average All 1 0
Inter-Dataset Testing using Model of Dataset II
The merged model of Dataset II is tested on each host of other datasets. This is demonstrated in Table 6.12 when tested on Dataset I.
Table 6.12. Model of Dataset II Tested on Dataset I Merged Model Based Approach
Hosts A C D E F G H I J K L M N O P DR 1 1 1 1 1 1 1 1 1 1 1 1 1 1 1 FPR 0 0 0 0 0 0 0 0 0 0 0 0 0 0 0
Instance Based Approach B 0.7 0.9 Average All 0.97 0.05
The merged model of Dataset II couldn’t detect the attack traffic in one of the hosts of Dataset I. This host when tested with the instance based of Dataset I gave a little higher DR of 0.7 but unfortunately the false positive rate is still high. During analysis of this host, it is shown that this host data has a different pattern for its features. It might be possible that Host B of Dataset I is under an attack that belongs to a different category than the hosts whose attack traffic are detected. It is inferred that, if a more robust merging criterion is applied, our method may become more efficient and detect attacks from such eccentric data. Interesting point to note down here is as shown in the Appendix Table A.11 even the retrained random forest model of Dataset II couldn’t detect the attack traffic of Dataset I Host B.
Similarly, the merged model of Dataset II is tested on the Dataset III. Table 6.13 shows the result using the model based and instance based approach.
Comparison with Traditional Methods
Results comparisons between our proposed model and three aforementioned ap-proaches for Dataset II are done. Since the results are pretty much comparable to RF technique, comparison with other two are shown in Figures A.1 and A.2 in the
Table 6.13. Model of Dataset II Tested on Dataset III Merged Model Based Approach
Hosts A B G H I J L M N P Q R DR 1 0.89 1 1 1 1 1 1 1 1 1 1 FPR 0.004 0 0 0 0 0 0 0 0 0 0 0
Instance Based Approach
C D E F K O 0.74 1 0.92 1 0 0.5 0.1 0 0 0.5 0 0 Average All 0.89 0.03
Appendix. Our model performed better on the unseen Dataset III giving DR of 0.89 as compared to 0.81 using traditional method of random forest.
6.5.3 Dataset III
Biggest maximal clusters are merged to obtain models for them. They are tested for detection rate and false positive rate as described in above section.
Table 6.14. Dataset III - DR when Maximal Clusters Tested on each Other Clusters GHIMPQ GIMOP
GHIMPQ 1 1
GIMOP 1 1
Table 6.15. Dataset III - FPR when Maximal Clusters Tested on each Other Clusters GHIMPQ GIMOP
GHIMPQ 0 0
GIMOP 0 0
The Tables 6.14 and 6.15 show the detection rate and false positive rates respec-tively with two clusters, GHIMPQ and GIMOP. Based on the results, the merged cluster is using hosts G, H, I, M, P, O, Q which is circled in Figure 6.8. The merged model is tested on each of the host of Dataset III shown in Table 6.16.
Table 6.16. Model of Dataset III Tested on Itself Model Based Approach
Hosts G H I M O P Q DR 1 1 1 1 1 1 1 FPR 0 0 0 0 0 0 0
Instance Based Approach A B C D E F J K L N R 1 1 1 1 1 1 1 1 1 1 1 0 0 0 0 0 0 0 0 0 0 0 Average All 1 0
Fig. 6.8. Merged Cluster for Dataset III
Inter-Dataset Testing using Model of Dataset III
Table 6.17 shows the model of Dataset III tested on each host of Dataset I using the aforementioned techniques. The explanations given in subsection Inter-Dataset Testing using model of Dataset II is applicable here contributing to the high false positive rate for Host B of Dataset I.
Table 6.17. Model of Dataset III Tested on Dataset I Merged Model Approach
Hosts A C D E F G H I J K L M N O P DR 1 1 1 1 1 1 1 1 1 1 1 1 1 1 1 FPR 0 0 0 0 0 0 0 0 0 0 0 0 0 0 0
Instance Based Approach B 0.6 0.9 Average All 0.97 0.05
Table 6.18 shows the results when the merged model of Dataset III is tested on the hosts of Dataset II.
Table 6.18. Model of Dataset III Tested on Dataset II Merged Model Based Approach
Hosts A B C D E F G H I J K L M N O P Q R S T U DR 1 1 1 1 1 1 1 1 1 1 1 1 1 1 1 1 1 1 1 1 1 FPR 0 0 0 0 0 0 0 0 0 0 0 0 0 0 0 0 0 0 0 0 0 Average All 1 0
Comparison with Traditional Methods
The results achieved for both the techniques i.e our method and random forests are pretty much comparable, shown in Figure 6.9. Results comparison with Naive Bayes and Logistic Regression are shown in Figures A.3 and A.4 in the Appendix.


![Fig. 6.1. Merging of Decision Boxes Starting from Upper Left [52]](https://thumb-us.123doks.com/thumbv2/123dok_us/9907147.2483932/47.918.306.683.111.479/fig-merging-decision-boxes-starting-upper-left.webp)
