The views expressed in this report are those of the authors and do not necessarily
reflect the views of the officers and trustees of Educational Testing Service.
Additional copies of this report can be order for $19.95 (prepaid) from:
The Center for Global Assessment
Mail Stop 02-R
Educational Testing Service
Rosedale Road
Princeton, NJ 08541-0001
(609) 734-1798
To obtain a PDF copy of this report, please visit
www.ets.org/etsliteracy
Adult Education in America:
A First Look at Results
from the Adult Education
Program and Learner Surveys
Claudia Tamassia, Marylou Lennon,
Kentaro Yamamoto and Irwin Kirsch
Copyright © 2007 by Educational Testing Service. All rights reserved. No reproduction in whole or in part is permitted in any format or medium without
Adult Education Program
Study
Acknowledgements
We would like to extend our deep appreciation to the many individuals who contributed to this project and helped create this first report on the results of the Adult Education Program Survey (AEPS). In particular, we are indebted to those individuals at the 1,200 participating adult education programs who took the time to complete the extensive program questionnaire as well as the over 6,000 adult learners who gave their time to respond to the learner survey. We also wish to thank the staff at the adult education programs who participated in this study. Without their cooperation, expertise, and willingness to serve as administrators of the assessments, this study would not have been possible.
The AEPS was a cooperative effort, planned by the Office of Vocational and Adult Education of the U.S. Department of Education. We particularly wish to thank Ron Pugsley who, as director of OVAE, saw the need for this study and supported its development and funding through his tenure at OVAE. Ricardo Hernandez deserves special thanks for his participation on the expert advisory panel as well as for his thoughtful input and guidance through each phase of the work. Additional staff at OVAE who deserve recognition include Mike Dean, Braden Goetz, Michael Jones, Cheryl Keenan, Susan Liu, Daniel Miller, and Rebecca Moak.
Staff at the National Center for Education Statistics helped to coordinate efforts during the development, implementation, and reporting of the data. Here special thanks are owed to Mariann Lemke, Eugene Owen, Valena Plisko, and Elois Scott. Our deep appreciation is extended to our colleagues at Westat, Inc. for their dedicated efforts and diligent work in managing the complex sampling, data collection, and processing of the survey data. In particular, we wish to acknowledge Martha Berlin, Carole Bower, Lillian Diaz-Hoffman, Jacquie Hogan, Leyla Mohadjer and Pat Montalvan.
At Educational Testing Service, we wish to thank Julie Eastland for her invaluable work in coordinating project meetings, publication of program questionnaires and assessment booklets, and managing the scoring operations and other aspects of the project, ensuring that the work proceeded smoothly. We also thank Kelly Bruce for her assistance with the report. Minhwei Wang deserves special recognition for conducting the data analyses as does Kimberly Fryer for her editorial review of the manuscript.
Danielle Baum designed and prepared the report, including the numerous tables and figures it contains. We wish to acknowledge her careful attention and thoughtful design which were critical to presenting this data clearly for readers.
Adult Education in America: A First Look at Results from the Adult Education Program and Learner Surveys
4
Pawloski, Konrad Raup, Heide Spruck Wrigley, John Strucker, Andrew Sum, Ellen Thompson, Peter Waite, Mary Weaver, JoAnn Weinberger, Randy Whitfield, Letricia Williams, and Cynthia Zengler.
We also wish to thank those individuals who provided insightful comments on early drafts of this report. Included are: Roberta Pawloski, Ron Pugsley, and Johan E. Uvin.
Of course the views expressed in this report are those of the authors and do not necessarily reflect those of OVAE, NCES or those of the officers or trustees of the Educational Testing Service. It is our hope that the information contained in this report will contribute to the needed discussion about the important role adult education plays in our society today.
Adult Education Program Study
Table of Contents
Acknowledgements 3General Introduction
9
Overview of the Study 10
Organization of the Report 12
Overview of Key Findings 13
Note to Readers 15
PART I:
The Program Survey
17
A Description of the Program Survey 17
Program Survey Highlights 18
CHAPTER 1
Characterizing Adult Education Programs
in the United States
19
Introduction and Highlights 19
Key Findings 20
Program Profiles 22
Types of Providers 22
Program Size 24
Budgets and per Pupil Spending 26
Funding Sources 27
Types of Expenditures 29
Collaborations with Public and Private
Community Organizations 30
Instructional and Support Services 31
Types of Instructional Services 31
Intensity of Instructional Programs and Educational Gains 33
Instructional Settings 34
Providing Services to Populations with
Special Needs 35
Providing Services to Adults with English
Adult Education in America: A First Look at Results from the Adult Education Program and Learner Surveys
6
Program Staff Profile and Characteristics 38
Distribution of Staff within Types of Providers 39
Roles, Experience, and Credentials of Adult Education Staff 40
Role and Uses of Assessment 42
Uses of Technology 44
Geographic Distribution of Adult Education Programs 46
A Profile of Adult Education Providers 47
Local Education Agencies (LEA) 47
Community-Based Organizations (CBO) 48
Community Colleges 49
Correctional Institutions 50
Final Remarks 50
PART II:
The Learner Survey
53
A Description of the Learner Survey 53
Defining and Measuring Literacy and Numeracy 53
Reporting Results 55
Conducting the Survey 57
Organization of Part II 58
Learner Survey Highlights 58
Chapter 2
Profiling Literacy and Numeracy Skills among Adult Learners
61
Introduction and Highlights 61
Key Findings 62
Literacy and Numeracy Skills of Adult Learners 64
A Profile of Skills 64
The Distribution of Skills across Instructional Programs 68
Background Characteristics of Adult Learners 70
Gender and Skills 71
Age and Skills 72
Skills and the Role of Race, Ethnicity, Immigration
Status, and Language 76
Educational Attainment, Place of Birth and Skills 80
Complex Characteristics Related to the Adult Learner
Population and Skill Levels 84
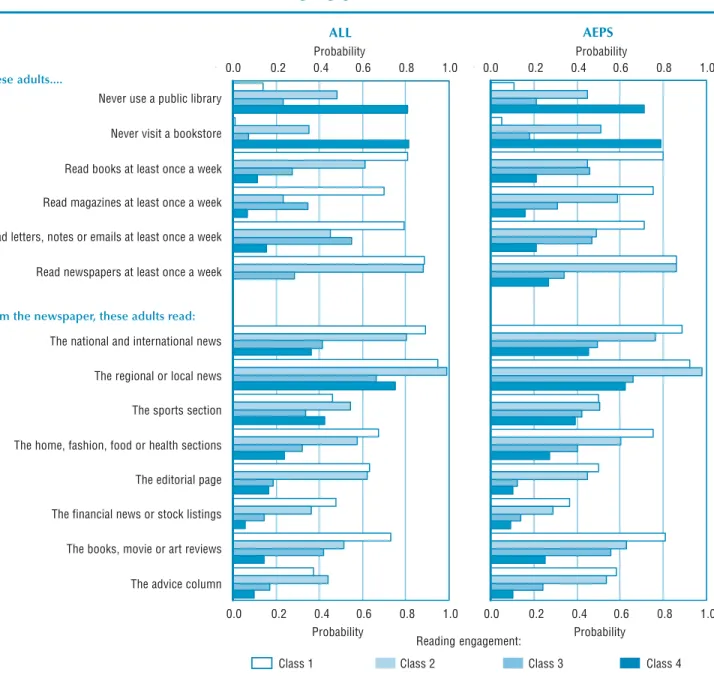
Literacy and Reading Engagement 84
Literacy and Wealth 89
Literacy and Health 91
Table of Contents
Geographic Distribution of Adult Program Participants 94
Final Remarks 95
Chapter 3
Comparing the Adult Learner and
General Household Populations
97
Introduction and Highlights 97
Key Findings 98
General Comparison of the Adult Learner and Household Populations 99
Comparing Literacy and Numeracy Distributions 100
Comparing Background Characteristics 104
Gender and Skills 104
Age and Skills 107
Skills and the Role of Race, Ethnicity, Place of Birth,
and Language 109
Educational Attainment and Skills 114
Comparing Complex Characteristics of Adults 116
Literacy and Reading Engagement 116
Literacy and Wealth 120
Literacy and Health 122
Final Remarks 125
Chapter 4
Comparing Literacy Skills of English- and
Spanish-Speaking Hispanic Adult Learners
127
Introduction and Highlights 127
Key Findings 129
An Overview of Hispanic Learners in the United States 129
Profile of Literacy 129
Relevant Characteristics within the Hispanic Population
of Adult Learners 133
Age and Skills 134
Place of Birth and Mother Tongue 136
Educational Attainment 141
Comparisons between Hispanic Adult Learners in the United States
Adult Education in America: A First Look at Results from the Adult Education Program and Learner Surveys
8
Appendices
147
Appendix A
149
Appendix A1: Reader’s Guide 149
List of Acronyms 149
Roundind Procedures 150
Glossary of Statistical Values Used in this Report 150
Appendix A2: AEPS Program Questionnaire 151
Appendix A3: AEPS Background Questionnaire 181
Appendix A4: AEPS Instruments and Methods 205
Program Survey 205
Learner Survey 210
Appendix B
221
Appendix B1: Chapter 1 Tables 221
Appendix B2: Chapter 2 Tables 243
Appendix B3: Chapter 3 Tables 277
Appendix B4: Chapter 4 Tables 309
References
325
Adult Education Program
Study
General Introduction
Today in America the rewards for what one knows and can do are large and growing. Literacy and numeracy skills have become a currency both here in the United States and in many developed countries around the world. Those in our society with below average skills cannot hope to earn above average wages in a global economy. Neither can they hope to participate fully in an evolving society where individuals are required to take on additional responsibility for more aspects of their lives in the face of increasing types and amounts of information. Policy makers and others are coming to recognize that, in modern societies, human capital, or what one knows and can do, may be the most important form of capital.
The skills that participants in adult education programs do or do not develop have increasingly important implications in terms of workforce participation, long-term self-sufficiency, acculturation, and citizenship. A growing body of data shows that, in addition to obtaining and succeeding in a job, literacy and numeracy skills are associated with the likelihood that individuals will participate in lifelong learning, keep abreast of social and political events, and vote in state and national elections (Benjamini and Hochberg 1995; OECD and Statistics Canada 2005; Sum, Kirsch, and Yamamoto 2004a). These data also suggest that literacy is likely to be one of the major pathways linking education and health and may be a contributing factor to the disparities that have been observed in the quality of health care in developed countries. Thus, the noneconomic returns to literacy in the form of enhanced personal well-being and greater social cohesion have been viewed by some as well-being as important as economic and labor-market returns.
Given the social and economic stakes involved, one might reasonably argue that adult education programs have the potential to impact the lives of their participants in unprecedented ways. Adult education has a rich and diverse history in the United States and a range of groups—public and private, state and federal— has long been involved in educating America’s adults. In addition to public schools and voluntary organizations, various groups have played a role in promoting literacy. These include religious schools that promoted literacy so that adherents could read the Bible, lending libraries that worked with community members so they could read the latest in American literature or pursue personal enrichment, vocational schools that strove to advance the occupational skills of students, governments that saw literacy as a way to support citizenship, and the military, which promoted literacy to ensure
Adult Education in America: A First Look at Results from the Adult Education Program and Learner Surveys
10
legislation established a program of federal grants to states and focused on setting up basic education classes for adults who had not completed secondary education. Funding for states that first year was $18.6 million with an enrollment of just under 38,000 adults (Eyre 1998). In 1966, the program expanded beyond basic education and moved to the U.S. Department of Education with the passage of the Adult Education Act. The thirty years that followed saw an increase in the commitment of federal dollars to adult education, with a concomitant increase in the number of adults enrolled in federally supported programs. By 1992, federal funds had increased to over $235.7 million and enrollments had risen to over 3.8 million (Sticht 1998). Adult education programs in the United States are currently governed by the Adult Education and Family Literacy Act (AEFLA), Title II of the Workforce Investment Act of 1998. This legislation directs how federal dollars are distributed and defines the general goals of adult education programs as
•
assisting adults to become literate and obtain the knowledge and skills necessary for employment and self-sufficiency;•
assisting adults who are parents to obtain the educational skills necessary to become full partners in the educational development of their children;•
assisting adults in the completion of a secondary school education. In addition, the legislation establishes performance accountability standards organized around “core indicators” that the Act defines as•
demonstrated improvements in literacy skill levels in reading, writing, and speaking the English language; numeracy and problem-solving; English language acquisition; and other literacy skills;•
placement in, retention in, or completion of, postsecondary education, training, unsubsidized employment, or career advancement;•
receipt of a secondary school diploma or its recognized equivalent. The Adult Education Program Study (AEPS) was conducted to provide comprehensive information about federally funded adult education programs and the skills of participants enrolled in those programs. The study had two primary goals. The first was to gather and disseminate information about the programs that constitute the adult education system in the United States. The second was to assess and report on the literacy and numeracy skills of a nationally representative sample of adults who participated in those programs. Such information is particularly timely given that the major federal statute authorizing adult education activities—the Workforce Investment Act—expired at the end of fiscal year 2004 and has yet to be reauthorized by Congress. For the more than two million adults who currently participate in federally supported adult education programs, acquiring literacy and numeracy skills matters, perhaps now more than ever, and adult education programs have a critical role to play in improving their educational opportunities and outcomes.Overview of the Study
Efforts to understand the structure and characteristics of adult education programs and the learners they serve are not new. Between 1990 and 1994, the U.S. Department of Education conducted the National Evaluation of Adult Education Programs to “evaluate adult education programs funded under the basic grants provision of the [Adult Education] Act regarding their potential for significantly reducing deficits in the adult population with respect to literacy, English proficiency, and secondary
General Introduction
education” (Young et al. 1995, 4). This evaluation effort involved collecting general data from the universe of adult programs in 1990, followed by the collection of more specific data from a sample of adult education programs. This was later followed by the collection of data from adult education learners through a telephone interview to adults who had been out of adult education programs for about six months. While these studies collected detailed information about adult education programs, limited information was available on the literacy level of adult learners.
The overall goal of the AEPS was to provide nationally representative information about adult education programs and their participants. Sponsored by the Office of Vocational and Adult Education, the AEPS represented a collaborative effort. The study was designed and conducted by the Educational Testing Service (ETS) and Westat, Inc., working in conjunction with staff from the Office of Vocational and Adult Education and the National Center for Education Statistics. The AEPS consisted of two surveys: the Program Survey, which collected information about the characteristics of adult education programs and the services they offered, and the Learner Survey, which assessed the literacy skills of learners in a sample of adult education programs. The Program Survey covered the program year from July 1, 2001 to June 30, 2002 and data collection for the Learner Survey took place from March through June of 2003.
The Program Survey focused on adult education programs and was designed to provide a description of those programs in terms of
•
the characteristics of institutions offering such programs, including their size in terms of number of programs, number of sites, number of participants, and budget;•
the types of learners enrolled in programs and the kinds of support systems offered to those learners;•
characteristics of program staff members and their qualifications;•
the types of assessments employed and ways in which assessment information was used;•
the extent to which technology was employed and purposes for its use. Strict sampling procedures were designed to ensure that the program questionnaire was representative of programs of all sizes in all regions of the United States. The results of this survey are presented in Part I of this report.The Learner Survey was designed to provide a profile of a nationally representative sample of adult learners enrolled in adult education programs. Two instruments were used to gather this information. The first was a background questionnaire used to collect information about learner characteristics with respect to language background, educational background and experiences, labor force participation and other activities, and general demographic information such as gender and age. The second instrument was an assessment of literacy and numeracy skills. This instrument was derived from the Adult Literacy and Life Skills Survey (ALL), an international, large-scale assessment of adults conducted in 2003 with the United States as one of the seven participants (OECD and Statistics Canada 2005). The ALL was designed and implemented in collaboration with several international
Adult Education in America: A First Look at Results from the Adult Education Program and Learner Surveys
12
program year. This picture includes a description of adult education programs, a profile of the learners that are being served by these programs, and a description of their skills in prose literacy, document literacy, and numeracy. The AEPS can, in many ways, be considered a survey of firsts.
•
The AEPS represents the first time comparable literacy measures have been used to assess the skills of adult education participants in the United States in a nationally representative sample.•
It is the first time such measurement allows comparisons with a household sample, by comparing results with those from the ALL.•
It is the first time this kind of assessment has been conducted in both Spanish and English.All stakeholders in adult education, therefore, can benefit from the results of the AEPS, as they provide a unique look at the structure, organization, and substance of adult education programs and at the skills of adult learners enrolled in those programs across the country.
Organization of the Report
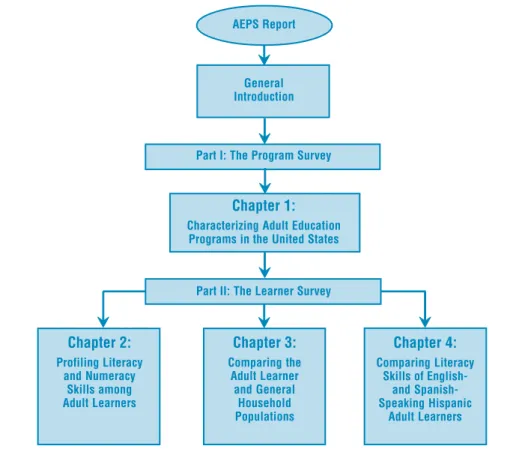
Figure I.1 illustrates the overall structure of this report. As shown in the figure, Part I focuses on the Program Survey and Part II on the Learner Survey. Part II consists of three chapters and, in addition to examining data from the Learner Survey, includes data from the ALL to compare adult learners with the general adult population in the United States.
Figure I.1 An Overview of the Adult Education Program Study Report
Chapter 2: Profiling Literacy and Numeracy Skills among Adult Learners Chapter 3: Comparing the Adult Learner and General Household Populations AEPS Report General Introduction
Part I: The Program Survey
Chapter 1: Characterizing Adult Education
Programs in the United States
Chapter 4: Comparing Literacy Skills of English-and Spanish-Speaking Hispanic Adult Learners Part II: The Learner Survey
General Introduction
Part I contains Chapter 1, in which the results of the Program Survey are presented. Data about programs funded under the AEFLA are presented and discussed. These data are organized around key areas of interest including the types and sizes of programs, information about funding sources, descriptive information about the types of instructional programs being delivered, the range of learners served, characteristics of staff associated with various types of adult education programs, general assessment practices, and uses of technology.
Part II consists of Chapters 2 through 4. Chapter 2 presents the results of the Learner Survey, looking at the distribution of literacy and numeracy skills among individuals participating in adult education programs. The relationship between skills and background characteristics such as gender, age, ethnicity, immigration status, and educational attainment is examined. Relationships between literacy and reading engagement, economic status, and health are also explored. In addition, the chapter looks at the distribution of literacy and numeracy skills by type instruction including Adult Basic Education (ABE), Adult Secondary Education (ASE), and English as a Second Language (ESL).
Chapter 3 compares results from the Learner Survey with results from the ALL for the U.S. sample. The ALL was a household survey that examined the characteristics and levels of literacy and numeracy of the general adult population in the United States and six other countries. As the Learner Survey uses instruments and methodology that emerged from the ALL, high comparability of the results from the two surveys is possible. This comparability allows the adult learner population to be compared with the general adult population in the United States.
Chapter 4 focuses on Hispanic learners and compares their performance on English and Spanish versions of the literacy tasks in the Learner Survey. As part of the study, a representative sample of the Hispanic population enrolled in adult programs was drawn and these learners were randomly assigned to either the English or Spanish versions of the AEPS instruments. This aspect of the study design allows an analysis of the extent to which the language of the assessment influenced performance on literacy tasks. In addition, this chapter compares the performance of the U.S. Hispanic adult learner population with the general adult population from the Mexican state of Nuevo Leon, also collected through the ALL.
The report also includes important information in its appendices: (a) Appendix A1 presents the reader’s guide with definitions of key terms used in the report, (b) Appendix A2 presents the questionnaire used in the Program Survey, (c) Appendix A3 presents the background questionnaire used as part of the Learner Survey, and (d) Appendix A4 describes and documents the methodology and procedures used for the implementation of the AEPS, including key aspects of survey administration, response, and data quality. Appendix B presents all supporting tables.
Overview of Key Findings
In many ways, the challenges for adult education programs and their learners are more complex today than ever before. Looking at data from the Program and Learner Surveys in conjunction with current and projected social and economic trends helps
Adult Education in America: A First Look at Results from the Adult Education Program and Learner Surveys
14
As this report shows, learners have a range of challenges to meet in order to develop the literacy skills they need. Data from the Learner Survey show that, overall, participants in adult education programs have measured average literacy and numeracy skills that are significantly below those of the general population. Of the three domains assessed in the Learner Survey—prose literacy, document literacy, and numeracy— the performance of adult learners was lowest in numeracy. While one would anticipate that those participating in adult literacy programs would have lower skills than adults in the general population, the implications of the skill levels demonstrated by adult education participants are nevertheless important to consider.
The literacy measures used in the Learner Survey divide performance into five levels, with Level 1 representing the lowest skill levels and Level 5, the highest. A number of national and state organizations, including the National Governors Association, have identified proficiency in Level 3 as a minimum for success in today’s labor market (see, for example, Comings, Sum, and Uvin 2000). The AEPS data show that, across all three domains measured, the highest proportion of adult learners performed in Level 1. This implies a critical need for these learners to develop their skills if they are to successfully participate in today’s society. Changes in the workplace, in large measure driven by globalization and technological innovations, have increased the demand for workers with higher skills. In fact, projections suggest that professional, management, and technical occupations will generate about 46 percent of all job growth between 2004 and 2014. And it is workers in these job categories who will have access to on-the-job training programs that will allow them to keep abreast of changing technologies and continue to improve their skills (Kirsch et al. 2007). The workplace is thus one context in which those with the lowest skills are likely to struggle to succeed.
The AEPS data also highlight the central role that English language learning plays in adult education. Program Survey data show that ESL represented the largest type of instructional program in adult education. In fact, about half of all participants in adult education programs reported that English was not their native language. One important question is whether focusing instruction on improving the English language skills of these learners is sufficient to help them succeed in their everyday lives, or whether this population has additional educational needs. To address this question, the AEPS compared the performance of Spanish-speaking Hispanic learners on English and Spanish versions of the literacy assessment. Results showed that while Spanish-speaking Hispanic learners demonstrated somewhat higher average literacy skills in Spanish than in English, their skill levels were still well below those of the general population. Thus, ESL classes and the learners they serve face the dual challenge of improving not just English language skills, but literacy skills as well. And one would expect that this challenge will continue to grow, as U.S. Census Bureau projections show net international migration likely to account for more than half of our nation’s population growth between 2000 and 2015 (Kirsch et al. 2007). An important overall finding from the AEPS data was that 2.5 million learners are being served and that those learners represent individuals most in need of improving their literacy, numeracy, and English language skills. However, findings from the study also highlight important issues within adult education that will require additional consideration and discussion.
For example, data from the Program Survey showed that, on average, learners participated in adult education programs for well under one hundred hours over the course of a year. Of those learners, about a third gained one or more educational levels during the year. Given the educational needs of these adults and the
General Introduction
consequences of not meeting those needs, one question is whether learners are attending programs for sufficient periods of time to improve their skills to a level that will impact their ability to succeed in today’s competitive societies and labor markets.
As national data show, the result of limited skills is limited opportunities to succeed. The goal of the AEPS was to collect and present representative data about adult education programs and the learners they serve—with the hope that this data will both inform and contribute to the national dialogue about adult education in its increasingly critical role in today’s society.
Note to Readers
Social science research by its very nature contains multiple sources of uncertainty and error. Examples include uncertainty and error introduced via sampling procedures, through the measurement instruments themselves, and as a result of variations in administration and scoring. All of these are inherent parts of any large scale assessment. In both the design and conduct of the AEPS, all participants strove to control and quantify errors that might interfere with or bias interpretation.
Program directors served as the contact point for the Program Survey. In some cases, directors were responsible for delegating the task of completing the survey to other staff in their programs. As the profile and tasks of adult education employees vary, so too will their knowledge about specific aspects of the programs. Knowing this, the survey included an extensive reference guide that included general definitions of terms used throughout the questionnaire as well as information that was designed to assist respondents in answering specific questions. Nevertheless, as is true in all surveys of this kind, differences may exist in how questions were interpreted and answered as well as in the level of knowledge respondents possessed about specific aspects of the programs. For example, while some administrators were responsible for and therefore familiar with budgetary issues, others were more familiar with the academic aspects of programs. These differences may have resulted in discrepancies between the data described in this report and official data that have been previously reported. Discrepancies may also exist between some of the program data collected in the AEPS and the state data contained in the annual report to congress for the 2001-2002 program year (Mike Dean, Office of Vocational and Adult Education, personal communication, January 12, 2007). This may result from different people responding to the AEPS and the NRS or it could result from the fact that AEPS was based on a sample of programs. Where such discrepancies exist, they have been noted throughout Chapter 1.
The chapters of this report that focus on the Learner Survey describe the literacy proficiencies of subpopulations of the adult learner population and general adult population by characteristics such as age, gender, race, ethnicity, birthplace, language, and educational attainment. While certain groups are identified as having lower average skills than others, within every group there were individuals who performed well and others who performed poorly. As a result, when one group is reported to have lower average proficiencies than another, this does not imply that these findings apply to all of the adults in either group. Such statements do not
Adult Education in America: A First Look at Results from the Adult Education Program and Learner Surveys
16
When comparing data presented in the tables included in this report with the analysis of that data in the text, readers will find that, in some cases, figures in those tables may not exactly match those presented in the text. Totals, differences and averages were calculated on the basis of exact numbers (including decimals) and were rounded only after the calculations were completed, thus resulting in minor discrepancies. The complete set of data from the AEPS Program and Learner surveys, as well as data from the ALL, can be accessed using an interactive data tool that can be found at www.ets.org/etsliteracy.
Adult Education Program
Study
PART I
The Program Survey
A Description of the Program Survey
The Program Survey was one of the AEPS instruments designed to provide nationally representative information about adult education programs and their participants. Developed to elicit information about crucial aspects of program structure and operation, it covered the program year from July 1, 2001, to June 30, 2002. More than 1,200 adult education programs funded under the Adult Education and Family Literacy Act (AEFLA) participated in this survey. This sample represented more than 3,100 adult education programs in the United States. Information on these adult programs was collected through a questionnaire answered by program personnel. This Program Questionnaire (a copy of which can be found in Appendix A2) was organized into five sections.
1. The program profile section focused on characteristics of adult education programs including provider type, program size, budget, and the extent to which programs received support from external organizations.
2. The instructional and support programs section gathered information about the organization and conduct of instructional programs. Questions were asked about the type and availability of services, types of instruction offered, and characteristics of the participants served in the program.
3. The program staff profile and characteristics section asked for information about the staff working in adult education programs, with a special emphasis on instructional staff members and their certification and experience. 4. The role and uses ofassessment section addressed the role of assessment and
evaluation in adult education programs. Information was collected about purposes for assessment, the instruments used, whether participants were
Adult Education in America: A First Look at Results from the Adult Education Program and Learner Surveys
18
Program Survey Highlights
Data from the Program Survey revealed an extensive delivery system with 3,108 funded programs serving 2.7 million adult learners at 29,424 learning sites. The data also showed that there was no prototypical adult education program. Programs varied in size, resources, instructional focus, and learner populations served.
Despite the fact that considerable variation was found across programs, some general findings can be reported. Overall, the data indicated that local education agencies were the major providers of adult education, followed by community colleges, community-based organizations and correctional institutions. However, the largest programs, in terms of median enrollment, were offered by community colleges. ESL represented the largest type of instructional program in adult education, followed quite closely by ABE. While ESL instruction focused most specifically on adults with limited English language skills, the program data also showed that some percentage of ABE and ASE instruction was offered in other languages, most often in Spanish. When attendance was investigated across programs, the average adult education participant attended his or her program for less than 100 hours over the twelve months reported. The majority of these learners participated in classroom-based and one-on-one instruction. Across provider types, instructional staff represented the largest program expenditures. To provide services to adult learners, programs depended on part-time staff and volunteers more than full-time staff. Programs reported that adult learners were assessed on a regular basis and generally had access to educational technologies including computers and video materials. These and other issues related to characteristics of adult education programs are examined in Chapter 1 of this report.
Adult Education Program Study
Chapter 1
Characterizing Adult
Education Programs in
the United States
Introduction and Highlights
One key goal of the Adult Education Program Survey (AEPS) was to characterize the adult education program delivery system. As noted previously, more than 1,200 adult education programs funded under the Adult Education and Family Literacy Act (AEFLA) participated in this survey, a sample that represented more than 3,100 adult education programs in the United States. The survey collected information on aspects of program structure and operation during the July 1, 2001 to June 30, 2002 program year.
Each section of this chapter focuses on a set of important questions the survey was designed to address. The program profiles section addresses questions such as: What types of organizations run adult education programs? Where do they hold classes? How large are these programs in terms of enrollment and budget size? The
instructional and support services section focuses on questions such as: What kinds of classes are offered to adult learners? How often do classes meet? What types of support services are offered to all learners and, in particular, to learners with special needs or English as a second language? The program staff profile and characteristics
section looks at questions such as: What kinds of qualifications and experience do adult education instructors have? Do these instructors have opportunities for professional development? The role and uses ofassessment section answers questions such as: For what purposes are standardized assessments used in adult education programs? What tests are used, and how often are they given? And the use of technology
Adult Education in America: A First Look at Results from the Adult Education Program and Learner Surveys
20
Key Findings
Some key findings from the Program Survey data are highlighted below. These points, and additional findings from the survey, are examined in greater detail throughout the remainder of the chapter.
Program Size
• Most programs in the survey sample could be characterized as small or midsized, with a median number of four sites, median total enrollment of 318 learners, and median total budget of $199,000. The median expenditure per learner was $626.1
• Twenty-five percent of the smallest programs were offered in only one or two sites, served up to 127 learners, and had a maximum budget of $84,000. In contrast, 25 percent of the largest programs were offered in at least ten sites, served at least 731 learners, and had a minimum budget of approximately $428,000.2
•
The largest providers of adult education were local education agencies, which offered 54 percent of programs, serving 60 percent of adult education learners with a median enrollment of 336 learners and accounting for 58 percent of the total budget reported by all programs.•
The largest programs were offered by community colleges with median enrollments of 702 adults, serving 27 percent of adult learners and accounting for 20 percent of the total budget.Funding and Support
•
As expected, adult education programs were largely supported by federal and state funding which, combined, provided nearly two-thirds of their funding.• Adult education programs forged relationships with other organizations in the community (e.g., businesses, social service agencies, libraries) to receive assistance with activities such as program planning, recruitment, and referrals, as well as in-kind donations of facilities.
Enrollment and Scheduling
•
The majority of adult education programs offered classes for more than forty weeks with four to six hours a week the most commonly reported class time category.•
Open enrollment policies, which allow learners to begin and stop classes at any time, were common among adult education programs. Overall, 79 percent of programs used open enrollment. Of these programs, 70 percent indicated that open enrollment was used for more than 80 percent of their instructional services.1 In the report to Congress, states reported an average median expenditure per learner of $768 during the 2001-2002 program year (Mike Dean, Office of Vocational and Adult Education, personal communication, January 12, 2007). The $626 and $768 figures vary because of the different methods used to gather NRS data from the states and data for national surveys such as the AEPS (see Notes to Readers for a more elaborated discussion.)
2 The distinction between programs and sites, as used in the Program Survey, is an important one to keep in mind when reviewing these data. A “program” is the entity funded to provide educational services and programs may have one or many sites where instruction is delivered. “Sites” are defined as the physical locations where instruction is offered.
Chapter 1
•
Adult education classes were offered mostly during work days and evenings. Two percent of programs offered instructional services on weekends.Instruction and Learning
•
Programs reported that individual and classroom style instruction were the two most common learning environments, with each representing more than 30 percent of total learner instructional time•
For those programs that served special populations of adult learners (e.g., adults with learning disabilities, vision or hearing impairments), the most commonly reported instructional settings were inclusion programs in which instruction is offered within regular classes, as opposed to in special classes.•
Overall, a little more than one-third of learners completed an educational functioning level by the end of the program year. The educational functioning level is a measure of adult educational progress defined under the National Reporting System (NRS). Each level describes a set of skills and competencies for participants in Adult Basic Education (ABE), Adult Secondary Education (ASE) and English as a Second Language (ESL) instructional programs. ASE programs had the largest percentage of participants completing an educational level, followed by ABE and finally ESL. Slightly more than one-quarter of learners separated from their programs before completing an educational level.Staffing
•
Full-time staff comprised the smallest group of employees in adult education programs. They were most highly concentrated in programs within correctional institutions where they represented 59 percent of the staff members.•
Part-time staff accounted for 40 percent of the work force in adult education programs. They represented the majority of staff members in programs offered by local education agencies and community colleges.•
Volunteer staff accounted for 43 percent of the employees in adult education programs. They were highly concentrated in programs offered by community-based organizations where they represented over 80 percent of the staff.•
Over three-quarters of the programs reported having minimum educational requirements for their full- and part-time employees. The most common educational requirements were a BA/BS degree and K-12 certification.Assessment
•
Assessments were most commonly used in adult education programs for initial placement, to monitor learner progress, and to guide instruction. The Test of Adult Basic Education (TABE) was the most commonly reported standardized test for ABE and ASE learners. The Basic English Skills Test (BEST) was the most commonly reported standardized assessment for ESL learners.Adult Education in America: A First Look at Results from the Adult Education Program and Learner Surveys
22
level. Over 40 percent of adult programs had formal technology plans that addressed issues related to the procurement and use of technology. When asked what would influence their ability to expand the use of computer technology, programs reported that financial resources and the ability to integrate technology into instruction were the most important factors.
Program Profiles
The Program Survey represented 2,728,512 adults who were enrolled in adult education programs in the United States during the 2001-2002 program year.3 These
programs accounted for a budget of over $1.6 billion and varied in important dimensions, ranging from the number of sites and number of adults enrolled, to their total budgets, as shown by the data presented in Table 1.1. 4 This section will
present the Program Survey findings as they relate to variations across programs in terms of provider types, program size, budgets, funding sources, types of expenditures, and their collaborations with public and private organizations to develop and deliver services to adult education learners.
Types of Providers
As mentioned previously, federal funding for adult education is authorized under the AEFLA. These funds are provided to state governmental agencies, which are responsible for distributing them to local adult education programs through a competitive grant process. While all programs follow federal guidelines for the distribution of funds, the administration and organization of adult education at the state level varies. Across different states adult education programs are the responsibility of Departments of Education, local school districts, Labor or Workforce Development Departments, community college systems, or some hybrid of these agencies.
The distribution of programs by providers was characterized as an important aspect to study in the AEPS in order to better understand adult education programs. Therefore the Program Survey collected data about the distribution of provider types, asking administrators to identify one of the following five provider categories as best characterizing their program.
•
Local Education Agencies—These are typically public schools or school districts. In addition to K-12 education, they provide adult education classes open to all members of the community.•
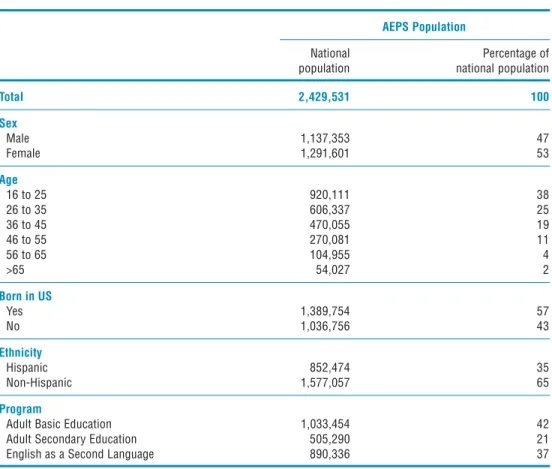
Community-Based Organizations—This is a broad category which encompasses religious and social service groups, libraries, volunteer literacy organizations, literacy coalitions, community action groups, and other kinds of public or private nonprofit groups.3 This 2,728,512 figure is the weighted sample of participants represented in the Program Survey. This value differs from the 2,429,531 figure used in Chapter 3 where the Learner Survey results are discussed. The latter figure is smaller because those learners with very low English-language skills who would not be able to complete the literacy and numeracy tasks were not included in the sample for the Learner Survey.
4 The total budget figure of $1.6 billion represents the weighted sum of budgets as reported by the programs, as shown in Table 1.1. During the same program year, states reported a total budget figure of $2.1 billion (Mike Dean, Office of Vocational and Adult Education, personal communication, January 12, 2007). The difference between these figures most likely results from the use of different methods used to gather NRS data from the states and data for national surveys such as the AEPS. (See the Notes to Readers section of this report for a more elaborated discussion.)
Chapter 1
•
Community Colleges—These are institutions of higher education (e.g., junior colleges without residential facilities) which offer degrees below a bachelor’s degree or technical degrees or certificates, such as in mechanical or industrial arts, and applied sciences (e.g., technical colleges).•
Correctional Institutions—These include both prisons and jails that are funded by the state to provide adult basic education services to incarcerated adults.•
Other—Some examples in this category include public or private colleges which are not community colleges, libraries, departments of human services, institutions for disabled individuals, and other coalitions of providers, including those that include more than one of the provider types listed above.As illustrated in Figure 1.1, data from the Program Survey revealed that the three largest providers of adult education programs in the United States were local education agencies (LEAs), community-based organizations (CBOs) and community colleges. LEAs represented the largest provider by far, offering over half of the adult education programs (54 percent). CBOs and community colleges offered 24 and 17 percent of programs respectively and correctional institutions were the smallest providers with 2 percent of adult education programs (see also Table 1.1).5
Local education agencies 54% Community-based organizations 24% Community colleges 17% Correctional institutions 2% Other 3% Figure 1.1
Distribution of adult education programs among type of provider
To further understand key aspects of adult education programs, in the following sections type of provider is examined in combination with other variables such as program size, funding sources and types of expenditures.
Adult Education in America: A First Look at Results from the Adult Education Program and Learner Surveys
24
Program Size
Program size can be examined in terms of a number of variables including number of participants, number of sites, and overall budget. These dimensions should, however, not be misconstrued as indicators of program quality or effectiveness. Figure 1.2 provides an overview of the distribution of variables that are associated with the size of programs among the types of providers. Four variables—number of programs, number of sites where the programs were offered, number of participants that were served, and the overall size of program budget—will be jointly examined as indicators of size. Overall, median values show that adult education programs were offered in four sites, served 318 learners, and had a median budget of $199,000.
Programs
Budget Sites
Participants
Figure 1.2
Size of adult education programs in respect to the programs’ number of sites, number of participants and total budget, by type of provider
0 20 40 60 80 100
Percentage
0 20 40 60 80 100
Percentage Local education agencies
Community-based organizations
Community colleges Correctional institutions
Other
As previously mentioned, LEAs represented the largest provider type. Not only did LEAs offer over half of the adult education programs (54 percent) but they also accounted for 58 percent of the overall budget for adult programs. Sixty percent of adult learners were enrolled in programs offered by LEAs and these programs had a median enrollment of 336 learners. In terms of program size, programs provided by LEAs were followed by CBOs and community colleges. While CBOs provided a quarter of adult education programs, they offered relatively small programs, serving only 8 percent of the adult learners with a median enrollment of 169 learners and accounting for 12 percent of the overall budget. In the case of community colleges, although the percentage of programs and number of sites were fewer than those of CBOs, community college programs were larger, serving 27 percent of the overall adult population with a median enrollment of 702 learners while accounting for 20 percent of the overall budget. Thus, while LEAs represented the largest provider overall in terms of numbers of programs, sites and budget size, community colleges offered the largest adult educational programs in terms of the numbers of students and accounted for the second largest percentage of the overall budget.
Chapter 1
Additional questions of interest related to the distribution of sites, participants and overall budgets include the following: How were programs distributed among the various sites? Were participants evenly distributed between programs and sites? What about the distribution of program budgets? One way of examining these distributions considers individual points that break them into parts. When variables are normally (i.e., evenly) distributed, the mean and the median have the same value.6
To eliminate the influence of extreme values, Table 1.1 presents information for the middle 80 percent of the distribution (i.e., the 10th and the 90th percentile points).7
As shown, the variables representing the number of sites, number of participants and overall budget were unevenly distributed, resulting in positively skewed distributions as some programs were much larger than average (i.e., there were larger differences between the median and the 90th percentile than between the 10th percentile and the median). Overall, 10 percent of the largest programs were offered in at least 19 sites and served at least 1,622 adult learners. On the other extreme, 10 percent of the smallest programs offered services in only one site and served 58 adult learners.
These differences were even more pronounced across providers. While LEAs were the largest provider, they offered programs in a relatively few number of sites. Only 10 percent of LEA programs were offered in more than 16 sites. On the other hand, community colleges offered 25 percent of their programs in more than 15 sites. Community colleges and CBOs offered programs in the largest number of sites with 10 percent of the programs being offered in more than 25 and 22 sites respectively. Community colleges and correctional institutions had the largest programs based on the median number of learners being served. The top 10 percent of their programs offered services to at least 2,700 and 3,900 learners respectively, while this figure was only 664 for CBOs.
Adult education programs also varied according to the settings that offered services. Common settings included public schools, community colleges, libraries, faith-based facilities, adult education centers, community centers, space provided by employers, and adult correctional facilities. For the majority of programs, public schools were the most common setting offering some services for 57 percent of the adult programs and serving some adult learners in 59 percent of the programs (see Figure 1.3). Also common were adult learning centers, community colleges and adult correctional facilities, with each offering some services to over one-third of the programs and serving some learners in over one-third of the programs.
According to these data, a picture emerges of an adult education field in which local schools were the prevailing service providers. Thus, the major providers of adult education were also those responsible for providing education for children and youths younger than age 18 enrolled in primary and secondary education, although the services provided under adult education programs are independent of those provided by primary and secondary education, and are targeted to a unique population of learners. Local schools were also largely involved in planning adult education programs, recruiting, and making referrals, as well as providing staff, facilities, and other resources (see Table 1.6).
Adult Education in America: A First Look at Results from the Adult Education Program and Learner Surveys
26
Budgets and per Pupil Spending
The Program Survey data showed a large range of variability for the size of individual program budgets, particularly when provider types were considered. Overall, the difference between the top and the bottom 10 percent of programs in terms of budget was $814,000. Additionally, the discrepancy between the overall mean of $532,000 and the overall median of $199,000 illustrates the skewness or unevenness of the distribution, where the majority of programs have a relatively small budget with only a few having very large budgets.8 For comparison purposes, three-quarters of CBO
programs had budgets of less than $299,000 and their median budget was $121,000. In contrast, 50 percent of the community college programs had budgets larger than $338,000.
These differences, while important and suggestive, should not distract from the larger point that all programs, independent of the type of provider they represented, had low per pupil spending rates. In terms of the median total enrollment and the median total budget figure, per pupil spending on adult learners was approximately $626.9
Types of sites Figure 1.3
Instructional programs and learners served at various types of sites
0 20 40 60 80 100 Percentage Percentage 0 20 40 60 80 100 Public school Adult learning center (single-use) Community college Adult correctional facility Other Faith-based facility Community center (multiple-use) Learner’s workplace Library Learner’s home
Percent of programs reporting that some services are offered at these kinds of sites (>0%)
Percent of programs reporting that some learners are served by these kinds of sites (>0%)
8 See Appendix A1 for a definition of skewness.
9 This figure was obtained by dividing the overall median budget by the overall median number of participants, as shown in Table 1.1. In the report to Congress, states reported an average median expenditure per learner of $768 during the 2001-2002 program year (Mike Dean, Office of Vocational and Adult Education, personal communication, January 12, 2007). The $626 and $768 figures vary because of the different methods used to gather NRS data from the states and data for national surveys such as the AEPS (see Notes to Readers for a more elaborated discussion).
Chapter 1
Budget size and per pupil spending are not, by themselves, indicators of program quality or effectiveness, but in the case of adult education programs these should be examined in respect to attendance. When hours of attendance were examined in relation to the number of learners enrolled in programs, data showed that adults, in general, attended programs for a very limited number of hours. The Program Survey asked administrators to provide attendance information by type of instructional service, collecting data about ABE, ASE, and ESL services. Data showed that the median attendance/number of enrolled learners during the program year July 1, 2001 to June 30, 2002, was 57 hours for ABE learners, 41 hours for ASE learners, and 49 hours for ESL learners (see Table 1.2).10 When the mean values were examined these values
increased to 85 hours for ABE learners, 70 hours for ASE learners, and 98 for ESL learners.11
Funding Sources
Overwhelmingly, adult education programs reported that they were supported by a combination of federal and state funding, rather than funding from local governments, private donations, or fees and tuition (see Table 1.3). Figure 1.4 shows sources of funding as a percentage of each program’s total budget. While, by definition, all Title II programs receive federal funding, only eighty percent of programs reported that they received some funding from the federal government. Given the relatively low missing data figure for this question (0.5 percent), this finding might be explained by the fact that funding may not be documented in a way that allows local program staff to identify funding sources. In some cases it is also possible that the person completing the program questionnaire had limited knowledge of the overall program budget and funding sources. One-third of programs reported receiving over 50 percent of their funding from the federal government. State governments also financed adult education programs with 89 percent of programs reporting that they received some funding from this source, including 47 percent reporting that over 50 percent of their funding came from the state. Local governments provided some funding, but at much lower levels than federal or state governments.
Table 1.3 also shows the percentage of funding received from various sources as a percentage of total budget, as well as the mean and median figures on these percentages, by providers. Based on the survey results, the distributions of funding sources across providers were quite similar for government funding (federal, state and local). Looking at the median percentages, LEAs and community colleges both reported that approximately one-third of their budgets were funded by federal sources, while CBOs reported that approximately one quarter of their budget came from these sources. CBOs received the least amount of funding from the state government (on average, 30 percent of their budget) while correctional institutions received the largest percentage of funding from this source (on average, 75 percent of their budget). On the other hand, CBOs reported receiving more financial support from a combination of foundation grants, corporate giving, and individual and civic giving than did the other providers.
Adult Education in America: A First Look at Results from the Adult Education Program and Learner Surveys
28
Figure 1.4
Sources of funding as percentage of total budget
0 20 40 60 80 100
Percentage of programs Percentage of programs
0 20 40 60 80 100 Federal govern-ment (all sources) State govern-ment (all sources) Local govern-ment (all sources) Foundation grants Corporate giving Civic/ individual donations Fees charged to employers for workforce services Fees charged to volunteers for training / materials Fees charged to learners Other 20 20 40 40 60 60 80 80 100 No funding 100 Some funding Some funding Some funding Some funding Some funding
More than 50 percent of total budget from this source
Between 1 and 50 percent of total budget from this source
No funding from this source
Programs also reported that they received additional support from in-kind non-cash donations which included materials (e.g., computer software and hardware), space (e.g., classrooms and offices), and services (e.g., legal assistance to programs, child care, and psychological counseling provided to learners) Such donations were quite common, with 71 percent of programs reporting that they received some type of in-kind donations (see the AEPS database12). Of the programs receiving such
non-cash donations, 36 percent were LEAs, 19 percent were CBOs, 12 percent were community colleges, and less than 2 percent were correctional institutions and other providers (see top panel in Figure 1.5). Figure 1.5 also shows that the most commonly reported in-kind donations clustered around physical facilities and included classroom and laboratory space, facilities and utilities, and office space.
While fees represent another possible source of income for adult education programs, in general the collection of fees is discouraged. Department of Education regulations limit the collection of fees to only those that are “necessary and reasonable” and require that such fees do not pose a barrier to program participation, particularly for disadvantaged learners (U.S. Department of Education 2005). As a result, programs reported limited income from fees. Eighty-seven percent of programs reported that they did not charge any fees for assessments, 82 percent did not charge fees for books and materials, 85 percent did not charge tuition, and 76 percent did not charge any other fees (see the AEPS database). This reporting was consistent with the data shown in Table 1.3 where 92 percent of programs reported that fees charged to learners did not contribute to their overall budget.
12 Data from the AEPS Program and Learner Surveys, as well as data from the Adult Literacy and Life Skills Survey (ALL), can be accessed using an interactive data tool that can be found at www.ets.org/etsliteracy.
Chapter 1
Classroom and laboratory space
Materials (office supplies, furniture) Facilities and utilities Office space
Figure 1.5
In-kind services received by adult education programs
0 20 40 60 80 90 Percentage of programs 0 20 40 60 80 90 Percentage of programs 70 70 50 50 30 30 10 10 Technical assistance (legal, insurance,
technology support) Technology support services Media services (electronic, print, broadcast) Administrative support (secretarial, copying) Hardware Instructional materials Hardware (computers used for administrative functions) Support services (e.g., childcare, transportation, psychological counseling)
0 10 20 40 60 80
Percentage of programs Receiving in kind donation
Local education agencies Community-based organizations Community colleges Correctional institutions Other 30 50 70 90
Types of Expenditures
The Program Survey provided interesting data about how expenditures were divided among categories that included administrative staff, instructional staff, support staff, materials, equipment, and technology (see Table 1.4). Across all programs, the largest expenditure was on instructional staff for the creation and delivery of instruction. The median value reported was 55 percent of the total expenditure. The second largest expenditure category was administrative staff comprising 10 percent of the total when based on median values. The next largest expenditure categories were instructional materials and equipment, and clerical and other staff costs, with each accounting for about 5 percent of expenditures based on median values. Two of the
Adult Education in America: A First Look at Results from the Adult Education Program and Learner Surveys
30
hardware for instruction and technology support services were reported as in-kind donations by 50 and 60 percent of programs respectively. In addition, only a small percentage of program budgets was reported to have been spent on professional development.13
Table 1.5 shows expenditure as a percentage of the overall budget for the different types of providers. The situation across providers did not differ significantly. Median values showed that CBOs spent the least amount of funding for instructional staff (47 percent) and 15 percent of their budget on administrative staff. Besides these two categories, programs spent, on average, between 3 and 9 percent of their budgets on clerical and other staff, and instructional materials or equipment. Data also showed that CBOs spent, on average, over 6 percent on facilities, utilities and custodial services, while other providers spent less than 3 percent. This may indicate that CBOs are either responsible for absorbing more of these costs than other providers or that these costs are represented by in-kind contributions for the other providers.
Collaborations with Public and Private Community
Organizations
Adult education providers do not exist in a vacuum. A wide variety of stakeholders in the community participate in the development and delivery of services. The ways in which organizations—such as local schools, community colleges, state and local employment agencies, businesses, foundations, media organizations, public libraries, and other state agencies—are involved in adult education programs may play an important role in their effectiveness and scope as well as the extent to which these programs meet the needs of the community.
Figure 1.6 shows the involvement of different types of organizations in specific aspects of adult education programs for categories in which more than 40 percent of the programs reported some involvement (see also Table 1.6). Overall, recruiting and referrals was the category in which organizations were most heavily involved with adult education programs. Looking across types of organizations, 92 percent of programs reported that local schools were involved in some aspect of their programs, particularly in planning, recruiting and referrals, and providing staff, resources and facilities. LEA programs reported the highest level of support from local schools, followed by CBOs and community colleges. Adult education programs were also supported by a variety of other types of organizations. For example, 29 percent of programs reported some involvement of labor unions, 31 percent reported the involvement of AmeriCorps, 44 percent reported the involvement of hospitals, and 50 percent reported the involvement of foundations in their programs.
13 The Adult Education and Family Literacy Act, under the State Leadership Activities section, specifies that up to 12.5% of the federal allocation may be used for professional development activities. The very small percentage that programs reported investing in professional activities may indicate that this funding was not included in the figures they reported (Van Scoyoc Associates 2003).
Chapter 1 Figure 1.6
Level of involvement of selected public and community organizations in selected aspects of adult education programs
Percentage of programs Percentage of programs
Local schools (including public voc-tech
schools)
Note:This figure shows only the categories where more than 40 percent of the programs reported involvement. 0 10 40 60 80 0 10 40 60 80 20 20 30 30 50 50 70 70
State and local employment and training agencies Literacy councils / organizations Workforce development investment boards Public libraries
Involved in planning Involved in recruiting / referrals
Provided staff, facilities, and other resources Community
colleges
Businesses
It is worthwhile expanding on another category of community involvement, which is funding. Table 1.3 shows that government sources (at the federal, state and local levels) accounted for the majority of funding for adult education programs. The next largest category was contributions from foundations and civic or individual donations with around one-sixth of the programs reporting donations from these sources. When viewed by provider type, 42 percent of CBOs reported receiving funding from foundations while 10 percent or fewer of other providers reported receiving such funding. This funding comprised a small percentage of support for all types of providers—however, when such funding was forthcoming it was, by and large, directed to CBOs.
Instructional and Support Services
Types of Instructional Services
Adult education programs typically offer different kinds of instructional services categorized according to the skill level or language background of learners. These include the following three types of instruction: