(IJSBAR)
ISSN 2307-4531
(Print & Online)
http://gssrr.org/index.php?journal=JournalOfBasicAndApplied
---
24
Prediction Analysis of Floods Using Machine Learning
Algorithms (NARX & SVM)
Nadia Zehra
*Department of Computer Sciences, Allama Iqbal Open University, Islamabad, Pakistan Email: [email protected]
Abstract
The changing patterns and behaviors of river water levels that may lead to flooding are an interesting and practical research area. They are configured to mitigate economic and societal implications brought about by floods. Non-linear (NARX) and Support Vector Machine (SVM) are machine learning algorithms suitable for predicting changes in levels of river water, thus detection of flooding possibilities. The two algorithms employ similar hydrological and flood resource variables such as precipitation amount, river inflow, peak gust, seasonal flow, flood frequency, and other relevant flood prediction variables. In the process of predicting floods, the water level is the most important hydrological research aspect. Prediction using machine-learning algorithms is effective due to its ability to utilize data from various sources and classify and regress it into flood and non-flood classes. This paper gives insight into mechanism of the two algorithm in perspective of non-flood estimation.
Keywords: flood; prediction; time series; NARX; SVM.
1.Introduction
Throughout the history, it has been observed that floods are one of the major disasters ever reported and can cause severe personal injuries along with the property damages. Escalation in flooding events is indeed a dilemma through recent years, as innumerable causalities are caused by them every year. One of the main reason have been that with drastic population growth, the human settlements are getting nearer to water bodies. Thus the infrastructure and lives associated get badly damaged and disturbed. with river overflows and flash floods.
--- * Corresponding author.
25
Moreover, climaticchange has many consequences as surge in frequency of rainfalls potentially enhance the rate of flooding [1,2]. As people have started to live in close proximity of rivers, precautions and safety measures are required to reduce the mortality and other harms associated with it. One of those measures can be the real-time flood forecasting which is at the same time a challenging task. It combines the efforts to identify subject risk areas, modeling of relations between flooding regions, securing probabilities of flood, thresholds, and setting alarming conditions. The parametric and causal factors that embed uncertainties in flood predictions are a very perplexing task, for scientists involved in study of it. The forecasting errors or misconstructions can lead to increase damages as cost factor. Therefore, estimation of uncertainties and integrating them for development of a prediction scheme can provide efficient warning systems [3]. Computational algorithms as neural networks have been majorly used to estimate flood in threatened area of a river and its effect outside of the specific area: for e.g. the upstream river flow or discharge is very helpful in finding downstream flows which are not equipped or lack measurements. [4]. Various researchers have reported different approaches towards forecast of water flood. Most prominent have been microwave imagery analysis: that uses land scanning through emissions received from satellite systems and on bases of parameters for an instance: Emissivity Polarization Index (EPI) threshold or Gravity Recovery and Climate Experiment (Grace) estimates extent of floods and ground level water estimations respectively [5,6]. Other techniques include wireless sensors based flood forecasting that provide robust communication channeling for flood warning systems [7]. In an extensive aspect hydrological modeling of flood prior to estimation require decision support systems that calculate flood level assessment, topographical categorization, catchment characteristics, resources management, data availability and abilities to run a flood model. Apart from compiling the complete information, the lead-time requirement and uncertainties for flood warning be properly evaluated and adjusted as per requirement [8]. These are the fundamental aspects that need to be addressed for flood modelling for wide range of applications. Machine learning (ML) is a sub-field of Artificial Intelligence (AI) whose applications as part of algorithmic and heuristic approach tend to understand patterns in certain dataset through intuitive training. Not more than decades ago prediction and forecasting was part of fiction, but as truth is more magical, the improvement and research in machine learning made the field emerge from laboratories into practical applications and industries. Today, healthcare associated detections, Natural language processing, fraud detection, face recognition, stock trends analyzing, natural hazard (flood, earthquake) estimation all are attributed to ML algorithms. The learning behavior as anticipated by Arthur Samuel in 1959 defined Machine Learning as it gives “Computers the ability to learn without being explicitly programmed.”. Conversely in flood prognosis, using such techniques allow scientists and relevant flood authorities to simulate the occurrence and the expected magnitude of the impending flood. The statistical modeling of the flood problem with basic linear regression help in predicting the behavior of a system by programming an equation for fitting the data in a successive manner. However, all hydrological and metrological influxes systems are non-linear in nature. That means that they cannot be logically or smoothly interpreted from one stage to another. Even if they are assumed to be linear, this estimation will lead to compromise majorly on accuracy and error detection [9]. With computational advancement and algorithms enhancements, Machine Learning (ML) has emerged as preferable instrument to delve with non-linear systems and explore automatically generated predictions of flash floods too for instance. In this paper we are going to discuss how prediction strength of ML algorithms Nonlinear Autoregressive Exogenous Model (NARX) and Support Vector Machine (SVM) help in providing early forecasts.
26
2.Prediction ConceptVirtually it is possible that a problem of the real world is mapped into a function. That requires input information, a mapping process and resultant output. This forms the bases of supervised machine learning in Artificial Intelligence (AI). A learning algorithm on the basis of provided input or features trains itself into a function(s) that could be further used to infer the output or labels. The training is done provided with the correct labels so the algorithm adjusts itself with tuning of hyperparametes which are most critical in controlling behavior and correct prediction. The training stops when an acceptable performance level has been achieved. Supervised Machine learning hence have been used to detect and forecast floods with varying methods (mixture of labelled and unlabeled data) [10,11]. In broad sense, supervised machine learning is further divided into two categories: Classification and Regression.
A. Classification Modeling
Classification learning deals with the problems when response vector is categorical or every training example is labeled. The classification algorithm groups the data into classes based on learnt mechanism.
B. Regression Modeling
In comparison, regression model attempts to finds the relation between input vector X and continuous output variable Y: ([X, Y]) trying to predict the value of response variable Y with the aim to minimize the Loss Function: Least Square Errors (L2) and Mean Square Error (MSE). The regression function m: ( ) * + is constructed for estimation and with help of Loss function can be minimalized as:
* ( ) + * ( ) + ∫ ( ) ( ) ( ) (1)
The m predictor along with L2 risk minimization factor : ∫ ( ) ( ) ( ) are formally used for regression analysis [12]. In this paper two algorithms (SVM and NARX) with supervised learning methodology are explained further. SVM is majorly used in classification learning and NARX uses a regression approach.
3.Non-linear Autoregressive model (Narx)
NARX prediction capabilities are derived from the linear ARX model that is often adjusted for time-series modeling. NARX gets two inputs, one is marked as incoming entry and the other one with opposite sign as output. This relates the model having exogenous inputs i-e model incorporates both the past values of the time series and current values as well. These inputs mark NARX as eminent for exogenous variables emulator that are defined as:
“A factor in a causal model or causal system whose value is independent from the states of other variables in the system; a factor whose value is determined by factors or variables outside the causal system under study” [13].
27
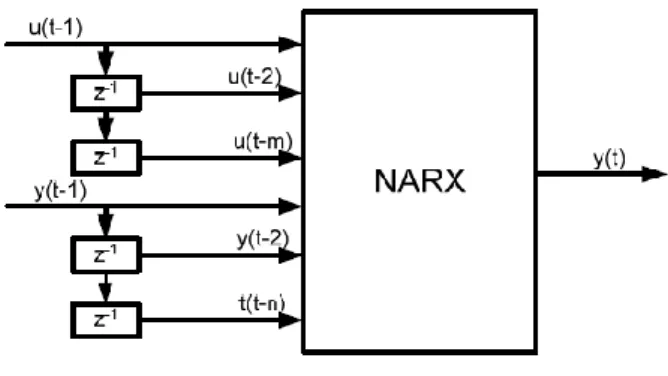
The model that pervades in NARX is auto regression. It incorporates the preceding time steps observations as inputs to a regression model. The regressor model constitutes of a non-linear and a linear function that maps the regressed inputs to output. The regressed values are the delayed inputs and outputs for e.g.: u(t-1) and y(t-2). The incorporating neural network model generates value of next time steps. It is a simple approach that can result in accurate forecasts for a wide range of time series problems. The equation of NARX is given as:
( ) , ( ) ( ) ( ) ( )- (2)
where ( ) and ( )denote, respectively, the input and output of the model at discrete time , while and , , are the input-memory and output memory orders.
The consequent of the dependent signal ( ) is regressed on previous values of the signal and
former values of an (exogenous) input. Aslayered structure of a feed-forward neural network can be embedded
in this architecture to approximate the function of . NARX can help in the prediction of the flood as time series and it predicts a nonlinear behavioural sample. NARX can be evaluated by statistical methods that compare the predicted output with actual data. The performance indices as: Akaike‟s Final Prediction Error (FPE), Loss Function (V) and Root Mean Square Error (RMSE) [14]. Below is the graphical representation of a classic NARX. The multilayer network is provided with input u with delayed times t (t-1) ... (t-m) and the feedback outputs y with t (t-1) ...(t-n). m and n are consequently the input delays and output delays.
Figure 1: Graphical Representation of NARX
3.1.Scholastic concept of NARX algorithm for flood prediction
The NARX algorithm is beneficial to forecasting of floods, because it is designed on the basis of time series interpretation. A Time series is a historical data of values related to a particular domain or problem constituting seasonal influxes, data trends and noise. In NARX network the preceding predictions become input to the system with a certain delay. The signal transmission is carried out through a non-linear static function. NARX is a type of Recurrent Neural Network (RNN) architecture. The architecture of RNN is similar to Multilayer Perceptron (MLP), i-e input layer, hidden layer(s) and output but extended feature is a loop back of output from hidden layer or output layer to the previous or input layer. Hence the graph of an RNN is difficult to understand. But the information flow is similar to Feed forward neural network (FFNN) i-e from Input layer to hidden layer(s) and eventually to the output layer. The hidden layer(s) constitutes of neurons whose numbers are
28
dependent upon size and complexity of the network.
The neurons are assigned random weights initially and applying activation processes each layer forwards its output that becomes input of the next layer. Consider three weight matrices: Input weights, hidden layers and loop back prediction input to hidden layer, the respect output w.r.t to regression functions can be summarized as:
( ) ( ( ) ( ))
( ) ( ( )) (3)
The neurons perform regression functions as backward propagation w.r.t loss function to reduce the error. The cost of the function is calculated as sum of errors at each time step. The weights are adjusted on each layer depending on the error induced by following layer with contribution of gradient descent algorithm. Thus training of the algorithm is done in the reverse order until minimum loss is achieved. The interesting factor in NARX algorithm as already explained is that, it also incorporates the delayed inputs along with delayed output as input in training, testing and validation of the model. The working nature of RNN network with feedback delays can be converted to FFNN by unfolding over time.
3.2.Research perspective of NARX algorithm
Various studies have been reported for the forecast of flood based on NARX algorithm. Few of them are discussed here.
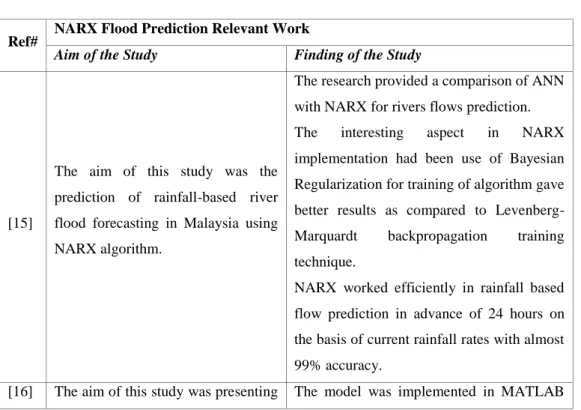
Table 1: NARX prediction research work
Ref# NARX Flood Prediction Relevant Work
Aim of the Study Finding of the Study
[15]
The aim of this study was the prediction of rainfall-based river flood forecasting in Malaysia using NARX algorithm.
The research provided a comparison of ANN with NARX for rivers flows prediction.
The interesting aspect in NARX
implementation had been use of Bayesian Regularization for training of algorithm gave better results as compared to
Levenberg-Marquardt backpropagation training
technique.
NARX worked efficiently in rainfall based flow prediction in advance of 24 hours on the basis of current rainfall rates with almost 99% accuracy.
29
Ref# NARX Flood Prediction Relevant WorkAim of the Study Finding of the Study
a 5 hours flooding model for Kuala Lumpur. The flooding vulnerable region was predicted by applying
Neural System Autoregressive
model with Exogenous Feedback (NNARX).
Neural Network Toolbox. The training was done with 131 samples, validation was done with 84 samples and testing vector was of 170 sample size. The training was done by gradient descent.
For further enhancement, an improved model was proposed and it was observed that both the models i.e. NNARX and improved NNARX performed the prediction 5 hours ahead of time. The performance of model obtained best results of 89.2% best fit.
[17]
The aim of this study was the prediction of flood 5 hours in advance of the occurrence specific to Terengganu River using NARX.
641 data sample were used for training, and further 641 data samples were used for validation. As for testing data samples, 1351 data were collected.
NARX performed the prediction 5 hours ahead of time and low RMSE value with 0.0220 meter. The result that was quite good since the best fit value recorded is more than 80% and it may not be 100% because the nonlinearity of the data.
[18]
The aim of this study was to propose a reliable and prediction model for flood as static neural network with back propagation cannot efficiently
perform it. Flood forecasting
requires dynamic nonlinear
properties therefore, NARX NN is used in this study for the prediction of dynamic characteristics of water flood level.
The results in this paper were based on a comparison between NARX and Extended Kalman Filter (EKF) algorithm in this study. Results illustrated that the NARX model predicted results more impressive than EKF. Though EKF is also a predictor for non-linear studies. Yet NARX outperformed and provided RMSE of 0.06m as compared to 0.67m.
[19]
The aim of this study was the prediction of flood 10 hours in advance. The NARX was for the forecast of the flood. The case study was specific to Kelang river level.
Results indicated this NARX design
properly believed the flooding water stage 10.833 hours before time. The performance level was very promising as value of RMSE accounted to be 0.0806 m
30
4. Support vector machine (SVM)In technical methodology, support vector machines (SVMs) are observed to understand and get trained by learning methods that perform to identify patterns within data, and these are explicitly designed for classification. SVM possess many useful properties such as optimization function for construction of SVM creates a unique solution [20]. More specifically, a support vector machine constructs a hyperplane or group of hyperplanes in a high- or infinite-dimensional plane, which may be useful for classification, regression, and other tasks like outliers‟ detection [21]. In case of flood prediction consider the input variable belonging to the vector {xi|i = 1, 2,…,N}, where N is total number of samples and the response vector yi ∈ {1,−1} define (flood, non-flood) classes. The best case of separating hyperplane equation is:
(4)
where w and b are corresponding model parameters, that conclude the direction of the hyperplane and its distance from origin. The SVM uses kernel trick to fit the maximum margin hyperplane in a higher dimensional plane. Kernel functions enable them to operate in a high-dimensional, implicit feature space without ever computing the coordinates of the data in that space, but rather by simply computing the inner products between the all pairs of data in the feature space. This operation is often computationally cheaper than the explicit computation of the coordinates [22].
4.1. Scholastic concept of SVM for flood prediction
The SVM is widely used in many studies as the task of flood forecast and water level prediction. A flood is actually an event in time series of water level which when raises causes flood thus SVM can generate a hyperplane of water level and on the basis of the rising in water level, it can forecast flood. The SVM algorithm marginalizes binary classes by increasing the distance amid them and creates an imaginary hyperplane between them. The decision is to choose the right hyperplane increases robustness to the classification algorithm. Consider binary classification of flood prediction by svm: the vectors on one side of hyperplane are denoted by „1‟ and on the other side of plane by „-1‟. Support vectors are those instances which are very near to the hyperplane on either side. In visualization the hyperplane can be considered as a particular line with intercept which is found by the learning algorithm. And the coefficients and represent the slope of the line. The equation of the line can be written as:
( ) ( ) (5)
Where and are the inputs to the system. The classification is made putting the input variables into the equation of the line and then perceiving the results. If the result is a positive value greater than zero, it belongs to the first class, class [0] and if the results are a negative value less than zero it belongs to second class i.e.
class [1].
31
Related studies conforming SVM as flood prediction in various researches are given as below:
Table 2: SVM prediction research work
Ref # SVM Flood Prediction Relevant Work
Aim of the Study Finding of the Study
[23]
This report presents a flooding forecast process by applying SVM. Authors
investigated the 2-year
knowledge based on 2005 and 2006. A total of 7 critical lake floods that happened in the downtown of Chiang Mai, Thailand were used as data. SVM was used for function
approximation and the
regression.
This study reveals that SVM a Ɛ-intensive loss function is
able to perform more accurately as compared to MLP models. Moreover, the outcome from the blind test sets illustrates that the SVM can be used for the forecasting of flooding events. The planned SVM forecast types may also be applied in a
real-world flooding caution system of
commercially available data..
[24]
This study also aimed at the forecast of flood using SVM. The area under study was Bird Creek, USA catchment areas for training. And the unseen data for testing and model calibration. Rainfall and river flow were derived
from 12 rain gauges
situated in/ near the
catchment area.The study
took in account the
number of parameters to
the kernel function
optimization.
A comparison with some benchmarking prediction algorithms was made i.e. Transfer functions, Trends and Naïve models. It illustrates SVM has the capacity to outperform them all in the time data series, at the expense of a large number of time and effort. This report also suggests linear and nonlinear kernel features (i.e. RBF) may provide remarkable activities against one another for various conditions in the exact same catchment. The analysis also reveals an appealing result in the SVM reaction to various rainfall inputs, wherever light rainfalls could create completely different
[25]
The aim of study was to predict flood in Dhaka,
Bangladesh data to
establish forecasting
capabilities of SVM and compare them with ANN performance.
The comparison of ANN with SVM to predict flood yielded interesting results. Due to non-regularization and non-optimization
requirements SVM proved a robust
methodology. For a 7-day lead forecasting SVM was close to ANN in case of testing
and verification results. However
values of SVM was marginally better than of ANN. The author attributes this as structural risk minimization ability of SVM.
[26]
The aim of this study was better attribute selection,
and discharge level
estimation of Rawal Lake, Islamabad. SVM was one
of the comparing
algorithm for above
mentioned study.
A 12 years‟ data was streamlined for attribute selection. Different classification models were used to determine the best selected attributes level and capacity of the Dam. J48 Tree produced the best results in this regard. The Forecasting methods to predict the discharge time were SVM, ANN (MLP), RBF and ARIMA. The results showed that SMOreg forecast model an improved version of SVM generated better results than its counterparts.
32
5. Synthesis / comparisonNARX and SVM are two of the most used algorithms for the flood forecast algorithms. Various other linear practices exist for times series prediction. For example, AR, ARMAX and Kalman Filtration have already been properly used in many flood forecasting problems. Nevertheless, the linear procedures for time series forecast might not always conduct well. In real life, the complex structure of information is hard to analyze and estimate accurately. Thus, the nonlinear analysis is chosen to support these problems. NARX actively comes in domain of deep learning i-e it takes assistance of neurological structure that tends to have human brain like working. This provides complexity to the NARX model and it helps it to deal with an incremented amount of data or features. It learns very rigorously and extracts usefulness of information provided. In case of SVM, however the case of optimal feature recognition is an extended problem and it learns through trial and error the best performing matrix of input. Flood assessment requires multitude of data as weather and hydrological parameters. Most of machine learning algorithm pertain to work with similar performance when data is limited. Therefore, NARX has an edge to deal more appropriately with curse of dimensionality. One of the advantage of SVM is that it slots in structural risk minimization (SRM). The idea proposed by Vapnik and Chervonekis in 1974. According to which SVM fits the data in set of models with higher degree of polynomials. The training applied to the model show the empirical errors in each model. And which case is over-fitting and memorizing the data but on testing show low performance. They calculated the risk associated and induced regularization in the loss function thus minimizing complexity of the predicting function. The model with less complexity i-e less degree polynomial and reduction in over-fitting is selected as ultimate predicting model. This is called as structural risk minimization. And it guarantees a classifier with minimum risk. In comparison neural networks as NARX follow empirical risk minimization whose objective are to find a function that produced less-likelihood of false prediction based on it has a smooth loss function, the class of prediction functions be simple and distribution of data shouldn‟t be irregular/ complex. Moreover, SVM procedure doesn‟t require local minima to solve the prediction problem, that NARX and other neural networks(NN) suffer from. In minimizing loss of a neural network it can undergo through many constraints like the gradient descent can stuck with local minima or could escape the global one. The step size or learning rate tuning is a factor that could also lead to vanishing gradient descent. However, domain knowledge and experimentation provide better assistance to solve such in case of NN. NARX is a black box regression model as compared to SVM that adapts with flood data very finely unless the data pattern changes with whole new dimension. NARX however requires to configure the Neural architecture to elevate the performance. But once configured it automatically adjusts itself even the dimensionality of the problem in reduced or increased. Thus NARX is a parametric learning model that doesn‟t care about how much data is thrown to them. Therefore, it tends to be more effective with real time training and prediction. NARX is provided with memory capabilities that it stores the previous outputs with delays and use them in regression model along with various other inputs. That makes the model more complicated but it increases accuracy or reduces errors. SVM marginalizes the data on the subjected training data and doesn‟t cater extra past input behavior of the system. So it‟s simple yet doesn‟t provide reliability in Time Series Analysis as in case of Flood Prediction. As indicated by the relevant works, NARX provides better performance in flood assessment, yet the problem nature has to carefully examined with various constraints and parameters of utilization.
33
6. ConclusionThis report was aimed at the meta-analysis of previously reported articles in the context of flood forecasting and the techniques targeted were the SVM and NARX. NARX is a type of NN and is widely used in terms of time series prediction. Based on the comparison, literature review and synthesis stated above, it is concluded that use of statistical methods with NARX can provide highly accurate and promising results for flood forecast. This study was quite helpful in elaborating the mechanism of those proposed techniques and their comparison with each other so that one can get to know which method is better and how.
References
[1] G. Corani and G. Guariso, “Coupling fuzzy modeling and neural networks for river flood prediction,”
IEEE Trans. on Systems Man and Cybernetics, vol.35, no.3, pp.382-390, Aug.2005.
[2] A. Luchetta and S. Manetti, “A real time hydrological forecasting system using a fuzzy clustering approach,” Computers & Geosciences, vol.29, no.9, pp.1111-1117, Nov.2003.
[3] Todini, E. (2004). Role and treatment of uncertainty in real‐ time flood forecasting. Hydrological Processes, 18(14), 2743-2746.
[4] Tienfuan Kerh and C.S. Lee, “Neural networks forecasting of flood discharge at an unmeasured station
using river upstream information,” Adv. in Eng. Software, vol.37, no.8, pp.533-543, Aug.2006. [5] Antony, T., Raju, C. S., Mathew, N., & Moorthy, K. K. (2015). Flood Extent Analysis Over the Major
River Basins in the Indian Subcontinent Using Satellite Microwave Radiometric Data. IEEE Journal of Selected Topics in Applied Earth Observations and Remote Sensing, 8(9), 4373-4378.
[6] Iqbal, N., Hossain, F., Lee, H., & Akhter, G. (2016). Satellite gravimetric estimation of groundwater storage variations over Indus Basin in Pakistan. IEEE Journal of Selected Topics in Applied Earth Observations and Remote Sensing, 9(8), 3524-3534.
[7] Khan, F., Memon, S., Jokhio, I. A., & Jokhio, S. H. (2015, November). Wireless sensor network based flood/drought forecasting system. In 2015 IEEE SENSORS (pp. 1-4). IEEE.
[8] D.P. Lettenmaier and E.F. Wood, 1993, Hydrological Forecasting, Chapter 26 in Handbook of
Hydrology. (D. Maidment, ed.), McGraw-Hill. D.P.
[9] Adeli, H. (2001). Neural networks in civil engineering: 1989–2000. Computer‐ Aided Civil and Infrastructure Engineering, 16(2), 126-142.
[10] Benoudjit, A., & Guida, R. (2019). A Novel Fully Automated Mapping of the Flood Extent on SAR Images Using a Supervised Classifier. Remote Sensing, 11(7), 779.
[11] Zhao, G., Pang, B., Xu, Z., Peng, D., & Xu, L. (2019). Assessment of urban flood susceptibility using semi-supervised machine learning model. Science of The Total Environment, 659, 940-949.
[12] Bauer, B., & Kohler, M. (2019). On deep learning as a remedy for the curse of dimensionality in nonparametric regression. The Annals of Statistics, 47(4), 2261-2285.
[13] Engle, R. F., D. F. Hendry, and J. F. Richard. 1983. Exogeneity. Econometrica 51:277-304
[14] Ruslan, F. A., Samad, A. M., Zain, Z. M., & Adnan, R. (2013, August). Flood prediction using NARX neural network and EKF prediction technique: A comparative study. In 2013 IEEE 3rd International Conference on System Engineering and Technology (pp. 203-208). IEEE.
34
[15] H. M. Noor, D. Ndzi, G. Yang and N. Z. M. Safar, "Rainfall-based river flow prediction using NARX in Malaysia," 2017 IEEE 13th International Colloquium on Signal Processing & its Applications (CSPA), Batu Ferringhi, 2017, pp. 67-72.
[16] R. Adnan, A. M. Samad, Z. M. Zain and F. A. Ruslan, "5 hours flood prediction modeling using improved NNARX structure: case study Kuala Lumpur," 2014 IEEE 4th International Conference on System Engineering and Technology (ICSET), Bandung, 2014, pp. 1-5.
[17] Q. A. Lukman, F. A. Ruslan and R. Adnan, "5 Hours ahead of time flood water level prediction modelling using NNARX technique: Case study terengganu," 2016 7th IEEE Control and System Graduate Research Colloquium (ICSGRC), Shah Alam, 2016, pp. 104-108.
[18] F. A. Ruslan, A. M. Samad, Z. M. Zain and R. Adnan, "Flood prediction using NARX neural network
and EKF prediction technique: A comparative study," 2013 IEEE 3rd International Conference on System Engineering and Technology, Shah Alam, 2013, pp. 203-208.
[19] F. A. Ruslan, A. M. Samad, Z. M. Zain and R. Adnan, "Flood water level modeling and prediction using NARX neural network: Case study at Kelang river," 2014 IEEE 10th International Colloquium on Signal Processing and its Applications, Kuala Lumpur, 2014, pp. 204-207.
[20] V. Vapnik, “An Overview of Statistical Learning Theory,” IEEE Trans. on Neural Networks, Vol.10,
No.5, pp.988-999, 1999.
[21] S. Gunn, “Support vector machines for classification and regression,” ISIS Technical Report ISIS-ı-eb, Image Speech & Intelligent Systems Research Group, University of Southapton, May 1998.
[22] Liong, S. Y., & Sivapragasam, C. (2002). Flood stage forecasting with support vector machines 1. JAWRA Journal of the American Water Resources Association, 38(1), 173-186.
[23] N. Theera-Umpon, S. Auephanwiriyakul, S. Suteepohnwiroj, J. Pahasha and K. Wantanajittikul, "River basin flood prediction using support vector machines," 2008 IEEE International Joint Conference on Neural Networks (IEEE World Congress on Computational Intelligence), Hong Kong, 2008, pp. 3039-3043.
[24] Han, D., Chan, L., & Zhu, N. (2007). Flood forecasting using support vector machines. Journal of hydroinformatics, 9(4), 267-276.
[25] Yu, P. S., Chen, S. T., & Chang, I. F. (2006). Support vector regression for real-time flood stage forecasting. Journal of Hydrology, 328(3-4), 704-716.
[26] Ali, M., Qamar, A. M., & Ali, B. (2013). Data analysis, discharge classifications, and predictions of hydrological parameters for the management of Rawal Dam in Pakistan. In 2013 12th International Conference on Machine Learning and Applications.1, pp. 382-385. IEEE.