by Thierry Bracke, Matthieu Bussière,
Michael Fidora and Roland Straub
OCCASIONAL PAPER SERIES
NO 78 / JANUARY 2008
A FRAMEWORK FOR
ASSESSING GLOBAL
IMBALANCES
O C C A S I O N A L P A P E R S E R I E S
N O 7 8 / J A N U A R Y 2 0 0 8
by Thierry Bracke, Matthieu Bussière,
Michael Fidora and Roland Straub
A FRAMEWORK FOR ASSESSING
GLOBAL IMBALANCES
This paper can be downloaded without charge from http://www.ecb.europa.eu or from the Social Science Research Network electronic library at http://ssrn.com /abstract_id=1005942
In 2008 all ECB publications feature a motif taken from the €10 banknote.
© European Central Bank, 2008 Address Kaiserstrasse 29 60311 Frankfurt am Main Germany Postal address Postfach 16 03 19 60066 Frankfurt am Main Germany Telephone +49 69 1344 0 Website http://www.ecb.europa.eu Fax +49 69 1344 6000
All rights reserved. Any reproduction, publication or reprint in the form of a different publication, whether printed or produced electronically, in whole or in part, is permitted only with the explicit written authorisation of the ECB or the author(s).
The views expressed in this paper do not necessarily refl ect those of the European Central Bank.
ISSN 1607-1484 (print) ISSN 1725-6534 (online)
CONTENTS
C O N T E N T S ABSTRACT 4
NON-TECHNICAL SUMMARY 5
1 INTRODUCTION 7
2 DEFINING GLOBAL IMBALANCES 1 0
2.1 Features of today’s imbalances 1 0
2.2 Twin motives to monitor trends
in global imbalances 1 1
2.3 A defi nition of global imbalances 1 2
2.4 A quantitative glimpse at global
imbalances since 1870 1 3
3 MEASURING GLOBAL IMBALANCES 1 7
3.1 Statistical measures of world
current account positions 1 7
3.2 Statistical measures of net
foreign assets positions 2 1
3.3 Indicators of distortions 2 3
(i) Foreign exchange
interventions 2 4
(ii) Distortions arising from macroeconomic
or structural policies 2 4
(iii) The role of governments in
fi nancial markets 2 4
(iv) International regulatory
barriers 2 5
3.4 Indicators of risks 2 5
(i) The disorderly adjustment
scenario 2 6
(ii) The risk of a protectionist
backlash 2 7
(iii) The relationship between
risks and distortions 2 7
4 STRUCTURAL AND CYCLICAL FACTORS 2 8
4.1 Structural factors 2 8
4.1.1 A view of global imbalances from the
fi nancial angle 2 9
4.1.2 Global economic and
fi nancial integration 3 1
4.1.3 The role of institutions and
fi nancial development 3 3
4.1.4 Financial imperfections
and precautionary savings 3 4
4.1.5 Business cycle moderation, economic policies and
precautionary savings 3 6
4.2 Cyclical factors 3 7
4.2.1 Private sector savings/
investment imbalances 3 8
4.2.2 Public sector savings/
investment imbalances 4 1
5 CONCLUSION 4 4
REFERENCES 4 6 EUROPEAN CENTRAL BANK
OCCASIONAL PAPER SERIES 50
BOX
A review of past episodes of
ABSTRACT
In this paper, we take a systematic look at global imbalances. First, we provide a defi nition of the phenomenon, and relate global imbalances to widening external positions of systemically important economies that refl ect distortions or entail risks for the global economy. Second, we provide an operational content to this defi nition by measuring trends in external imbalances over the past decade and putting these in a historical perspective. We argue that three main features set today’s situation apart from past episodes of growing external imbalances: (i) the emergence of new players, in particular emerging market economies such as China and India, which are quickly catching up with the advanced economies; (ii) an unprecedented wave of fi nancial globalisation, with more integrated global fi nancial markets and increasing opportunities for international portfolio diversifi cation, also characterised by considerable asymmetries in the level of market completeness across countries; and (iii) the favourable global macroeconomic and fi nancial environment, with record high global growth rates in recent years, low fi nancial market volatility and easy global fi nancing conditions over a long time period of time, running at least until the summer of 2007. Finally, we provide an analytical overview of the fundamental causes and drivers of global imbalances. The central argument is that the increase in imbalances has been driven by a unique combination of structural and cyclical determinants.
Key words: global imbalances, current account, incomplete fi nancial globalisation, structural factors, cyclical factors.
N O N - T E C H N I C A L S U M M A R Y NON-TECHNICAL SUMMARY
Global imbalances have been a key issue in international policy discussions over recent years. Since the International Monetary Fund/ World Bank annual meetings in Dubai in September 2003, the IMF and the G7 have repeatedly pointed to risks from the imbalances and have designed a policy strategy to facilitate a smooth unwinding.
More recently, in the course of 2007, concerns over global imbalances have been partly attenuated, as the current account imbalance of the main defi cit country, the United States, has started to correct, partly in response to the turmoil in the sub-prime mortgage market. Nevertheless, the size of these imbalances remains large, and a further widening of external positions can be observed across a range of countries, including in the main surplus country, China. The imbalances therefore remain a central item at policy meetings.
The understanding of global imbalances has evolved over recent years. Initial analysis and discussions centred on the current account defi cit of the United States. Attention then broadened to include developments in the main surplus countries, fi rst and foremost Asian economies and oil-exporting countries. Also, the focus on current account positions was complemented by a focus on the domestic and fi nancial imbalances in the economies concerned.
Despite considerable advances in the analytical understanding of global imbalances, several questions remain open. Opinions are still split over whether, when and how these imbalances will adjust. It is unclear how long they can be sustained. It is unclear whether their adjustment will be orderly and gradual or instead be coupled with macroeconomic and fi nancial instability. With so many open questions, this paper aims to take a more systematic look at global imbalances. It fi rst offers a defi nition of global imbalances and puts them into perspective. We defi ne global imbalances as “external positions
of systemically important economies that refl ect distortions or entail risks for the global economy”. The defi nition has three components. It refers to external positions, encompassing current account positions as well as fi nancial positions; it refers to systemically important
economies, including both the defi cit side
(e.g. the United States) and the surplus side (e.g. Asia, oil exporters); and it refers to distortions and risks, so as to distinguish imbalanced from balanced positions. Distortions can be defi ned as deviations from the fl exible price/perfect competition world; they can be induced by policy choices or private sector decisions. Risks refer to the macroeconomic and fi nancial implications, both under a scenario of unwinding (risk of disorderly unfolding, as manifested for instance in the fi nancial market turmoil of summer 2007) and under a scenario of further increasing imbalances (risk of a protectionist backlash, as manifested for instance in the limited progress made under the Doha round of trade negotiations).
The paper then provides an operational content to this defi nition by measuring trends in external imbalances over the past decade and putting these in a historical perspective. Current account indicators point to widening external positions since the mid-1990s, with an acceleration in the most recent years. The absolute value of current account positions as a percentage of global GDP has doubled since the mid-1990s. Global defi cits are increasingly concentrated in a single country, the United States, which now absorbs around 75% of world net savings. Current account balances have also become highly persistent, with only a few large countries switching between defi cit and surplus positions over the past ten years.
Gross international fi nancial positions have built up even more rapidly than current account positions. The evolution of net foreign asset positions largely mirrors that of current account positions, with some differences due to valuation effects (in particular for the United States). Gross asset positions, however, have increased at a much faster pace, refl ecting intensifying
global fi nancial integration. Although emerging market economies in aggregate do not account for a substantial share of total gross foreign assets, they account for a very large share of the build-up in international reserve assets.
Potential distortions and risks have increased in tandem with the widening external positions. There is indeed ample evidence that the current pattern of global imbalances is not entirely the result of freely operating market forces, but also of policy interventions (large, persistent and unidirectional interventions in foreign exchange markets; persistent deviations of
fi scal policy from long-run equilibria; lack of
fl exible labour, product and fi nancial markets). Risks relate mainly to a scenario of unwinding imbalances (potential macroeconomic and
fi nancial disruption) but are relevant also under a scenario of continuously high imbalances (potential increase in protectionist pressures). We argue that three main features set today’s situation apart from past episodes of growing external imbalances: (i) the emergence of new players, in particular emerging market economies such as China and India, which are quickly catching up with the advanced economies; (ii) an unprecedented wave of fi nancial globalisation, with more integrated global fi nancial markets and increasing opportunities for international portfolio diversifi cation, also characterised by considerable asymmetries in the level of market completeness across countries; and (iii) the favourable global macroeconomic and fi nancial environment, with record high global growth rates in recent years, low fi nancial market volatility and easy global fi nancing conditions over a long time period of time, running at least until the summer of 2007.
Finally, the paper provides an analytical overview of the fundamental causes and drivers of global imbalances. The central argument is that the increase in imbalances has been driven by a unique combination of structural and cyclical determinants. Structural changes in the global economy have allowed a widening of external positions that may be sustainable
in the medium term. These structural changes have been supplemented by cyclical or policy-induced factors that highlight short-run risks and create the possibility of a sudden, disorderly unwinding of global imbalances.
The structural determinants of global imbalances relate mainly to the incomplete process of
fi nancial globalisation, which is linked to the lower stage of fi nancial development in some regions of the world. Financial market imperfections in fast-growing emerging economies combined with the rapid process of
fi nancial globalisation has had an impact on the magnitude and the direction of capital fl ows at the global level, with capital fl owing from emerging to industrial economies. The effects of
fi nancial market imperfections on capital fl ows are further amplifi ed by the differential impact of business cycle moderation and by the specifi c ability of the US fi nancial markets to insure households against idiosyncratic risks. The equilibrium generated by these structural factors cannot last forever but is sustainable in the short and medium term.
Cyclical factors have further fuelled this structural process of widening external positions. These factors relate to saving/ investment patterns in the private sector (in the United States, for instance, accelerating private consumption due to a productivity-induced increase in US permanent income and due to wealth effects from rapid asset price increases) and the public sector (“twin” defi cits in the United States). If market participants start to question the sustainability of these patterns, an overshooting can happen and a disorderly unwinding of global economic imbalances is possible.
The framework provided in this paper, based on a clear distinction being drawn between structural and cyclical drivers, can therefore provide a concrete operational tool for policy-makers to monitor developments in global imbalances.
1 I N T R O D U C T I O N 1 INTRODUCTION 1
Global imbalances have been a key issue in international policy discussions over recent years. Since the International Monetary Fund/ World Bank annual meetings in Dubai in September 2003, the IMF and the G7 have repeatedly pointed to risks from the imbalances and have designed a policy strategy to facilitate a smooth unwinding. When the IMF designed its multilateral consultation process as a new global surveillance tool in 2006, global imbalances were selected as the fi rst topic to be addressed, resulting in a detailed policy agenda for the major economies. The President of the European Central Bank (ECB) has mentioned these risks in his introductory statement to each of the Bank’s monthly press conferences since November 2003, and they have been discussed in various issues of the ECB’s Financial Stability Review.
More recently, in the course of 2007, concerns over global imbalances have been partly attenuated, as the current account imbalance of the main defi cit country, the United States, has started to correct in response to the turmoil in the sub-prime mortgage market. Nevertheless, the size of these imbalances remains large, and a further widening of external positions can be observed across a range of countries, including in the main surplus country, China. The imbalances therefore remain a central item at policy meetings.
The understanding of global imbalances has evolved over recent years. Initial analysis and discussions centred on the current account defi cit of the United States. Attention then broadened to include developments in the main surplus countries, fi rst and foremost Asian economies and oil-exporting countries. Also, the focus on current account positions was complemented by a focus on the domestic and fi nancial imbalances in the economies concerned.
Despite considerable advances in the analytical understanding of global imbalances, several questions remain open. Opinions are still split
over whether, when and how these imbalances will adjust. It is unclear how long they can be sustained. It is unclear whether their adjustment will be orderly and gradual or instead be coupled with macroeconomic and fi nancial instability. More broadly, the imbalances fi gure prominently in political and societal debates over job losses, outsourcing, currency manipulation and possible protectionist measures.
With so many open questions, this paper aims to take a more systematic look at global imbalances. It fi rst offers a defi nition of global imbalances and puts them into perspective (Section 2). We defi ne global imbalances as “external positions of systemically important economies that refl ect distortions or entail risks for the global economy”. The defi nition has three components. It refers to external positions, encompassing current account positions as well as fi nancial positions; it refers to systemically
important economies, including both the defi cit
side (e.g. the United States) and the surplus side (e.g. Asia, oil exporters); and it refers
to distortions and risks, so as to distinguish
imbalanced from balanced positions. Distortions can be defi ned as deviations from the fl exible price/perfect competition world; they can be induced by policy choices or private sector decisions. Risks refer to the macroeconomic and fi nancial implications, both under a scenario of unwinding (risk of disorderly unfolding, as manifested for instance in the fi nancial market turmoil of summer 2007) and under a scenario of further increasing imbalances (risk of a protectionist backlash, as manifested for instance in the limited progress made under the Doha round of trade negotiations).
The project of this paper was initiated by C. Thimann and received 1
many substantive comments in the preparation process from M. Fratzscher. The authors would like to thank L. Bini Smaghi, L. Dedola, G. Korteweg, F. Moss, C. Nordquist, G. Pineau and the members of the General Council of the ECB and International Relations Committee of the European System of Central Banks as well as an anonymous referee for very helpful comments. We also would like to thank for very stimulating discussions at different stages of the project A. Brender, M. Chinn, F. Perri, F. Pisani, J. Pisani-Ferry and F. Warnock.
The paper then provides an operational content to this defi nition by measuring trends in external imbalances over the past decade and putting these in a historical perspective (Section 3). Current account indicators point to widening external positions since the mid-1990s, with an acceleration in the most recent years. The absolute value of current account positions as a percentage of global GDP has doubled since the mid-1990s. Global defi cits are increasingly concentrated in a single country, the United States, which now absorbs around 75% of world net savings. Current account balances have also become highly persistent, with only a few large countries switching between defi cit and surplus positions over the past ten years.
Gross international fi nancial positions have built up even more rapidly than current account positions. The evolution of net foreign asset positions largely mirrors that of current account positions, with some differences due to valuation effects (in particular for the United States). Gross asset positions, however, have increased at a much faster pace, refl ecting intensifying global fi nancial integration. Although emerging market economies in aggregate do not account for a substantial share of total gross foreign assets, they account for a very large share of the build-up in international reserve assets.
Potential distortions and risks have increased in tandem with the widening external positions. There is indeed ample evidence that the current pattern of global imbalances is not entirely the result of freely operating market forces, but also of policy interventions (large, persistent and unidirectional interventions in foreign exchange markets; persistent deviations of
fi scal policy from long-run equilibria; lack of
fl exible labour, product and fi nancial markets). Risks relate mainly to a scenario of unwinding imbalances (potential macroeconomic and
fi nancial disruption) but are relevant also under a scenario of continuously high imbalances (potential increase in protectionist pressures). We argue that three main features set today’s situation apart from past episodes of growing
external imbalances: (i) the emergence of new players, in particular emerging market economies such as China and India, which are quickly catching up with the advanced economies; (ii) an unprecedented wave of fi nancial globalisation, with more integrated global fi nancial markets and increasing opportunities for international portfolio diversifi cation, also characterised by considerable asymmetries in the level of market completeness across countries; and (iii) the favourable global macroeconomic and fi nancial environment, with record high global growth rates in recent years, low fi nancial market volatility and easy global
fi nancing conditions over a long time period of time, running at least until the summer of 2007. Finally, the paper provides an analytical overview of the fundamental causes and drivers of global imbalances (Section 4). The central argument is that the increase in imbalances has been driven by a unique combination of structural and cyclical determinants. Structural changes in the global economy have allowed a widening of external positions that may be sustainable in the medium term. These structural changes have been supplemented by cyclical or policy-induced factors that highlight short-run risks and create the possibility of a sudden, disorderly unwinding of global imbalances. The structural determinants of global imbalances relate mainly to the incomplete process of
fi nancial globalisation, which is linked to the lower stage of fi nancial development in some regions of the world. Financial market imperfections in fast-growing emerging economies combined with the rapid process of
fi nancial globalisation has had an impact on the magnitude and the direction of capital fl ows at the global level, with capital fl owing from emerging to industrial economies. The effects of
fi nancial market imperfections on capital fl ows are further amplifi ed by the differential impact of business cycle moderation and by the specifi c ability of the US fi nancial markets to insure households against idiosyncratic risks. The equilibrium generated by these structural factors cannot last forever but is sustainable in the short and medium term.
1 I N T R O D U C T I O N
Cyclical factors have further fuelled this structural process of widening external positions. These factors relate to saving/ investment patterns in the private sector (in the United States, for instance, accelerating private consumption due to a productivity-induced increase in US permanent income and due to wealth effects from rapid asset price increases) and the public sector (“twin” defi cits in the United States). If market participants start to question the sustainability of these patterns, an overshooting can happen and a disorderly unwinding of global economic imbalances is possible.
The framework provided in this paper, based on a clear distinction between structural and cyclical drivers, can provide a concrete operational tool for policy-makers to monitor developments in global imbalances. By way of illustration, applying the framework to 2007, one may note that developments over the year were driven mainly by changes in cyclical factors. During the fi rst half of the year, real economy developments – a rotation of global demand – helped to bring about a broad stabilisation of imbalances, especially in the United States, although not in China. Later in the year, fi nancial market turmoil intensifi ed this rebalancing of global demand, which could lead to a somewhat more rapid adjustment of imbalances. However, with structural drivers remaining largely in place, a very pronounced reduction in the imbalances remained, as of autumn 2007, relatively unlikely.
2 DEFINING GLOBAL IMBALANCES
External imbalances are a central theme in international economics and a powerful driver of change in economic history. Under the gold standard, trade balance adjustment was typically very slow and costly for defi cit countries, which triggered a search for a better international monetary system. During the interwar period, growing imbalances ended in a dismantling of international free trade and monetary arrangements, adding to geopolitical tensions in the run-up to the Second World War. In the early 1970s, tensions over external imbalances caused of a fundamental overhaul of the international monetary system, marking the end of the Bretton Woods system. In the 1980s, widening current account positions led to intensive international coordination with concrete policy commitments under the G5/G7 Plaza (1985) and Louvre (1987) agreements focusing on exchange rates. In the 1990s, external imbalances in emerging economies were a key source of concern, with a series of fi nancial crises sweeping across nearly all large emerging economies.
Today, the world again faces large external imbalances. Aggregate current account positions as a share of global output are twice as large as in the mid-1980s. Gross foreign asset positions have increased fourfold since this period, while net foreign asset positions have increased threefold. Reserve accumulation has reached a never-seen pace in the past decade, a seeming paradox in a world of increasingly freely fl oating exchange rates. The fundamental operation of the international monetary system is again under discussion, and the strategic role of the IMF within that system is being debated. Discussions that were confi ned to economic policy circles have moved to broader political and societal levels, through debates over job losses, outsourcing, currency manipulation, and possible protectionist measures.
2.1 FEATURES OF TODAY’S IMBALANCES
Current external imbalances have appeared in a fundamentally new economic landscape with three key features. First, the global economy
includes new players that were once at the periphery of global trade and fi nancial fl ows. Ten years ago, the global economic sphere was not truly global. It was limited largely to a tripolar world consisting of the United States, Europe and Japan. Emerging markets were largely peripheral areas of production and in some cases exotic niches for fi nancial investors. Economic liberalisation and post-cold war political transformation have removed borders between the centre and the periphery. Falling transportation costs, the growing use of information technology and deepening fi nancial markets have reduced spatial and temporal distances. The slicing up of production chains has allowed emerging economies to specialise in specifi c parts of the value-added ladder. Second, intensifying fi nancial links have altered the character of globalisation. Ten years ago, international fi nancial fl ows, at least in the emerging world, were largely the counterpart of trade fl ows. Today, fi nancial globalisation has prompted a strong increase in gross fi nancial
fl ows. Gross international asset positions rose above global GDP in the early 2000s and are now around 1.3 times as large. This surge in international portfolios was made possible by a strong rise in overall fi nancial wealth, coupled with a secular decline in investors’ home bias and accelerated by fi nancial innovation.
Third, the growing imbalances occurred in a phase of improving macroeconomic and fi nancial conditions, with record high economic growth and record low fi nancial market volatility. Ten years ago, the global macroeconomic environment was still surrounded by considerable uncertainty. High business cycle volatility, fi nancial crises in emerging markets (Asia, Russia, Brazil, Turkey), instability in pockets of the developed industrial fi nancial markets (Long-Term Capital Management) and concerns about infl ation still plagued the global economy. From 2004 to at least until early 2007 the global macroeconomic environment looked very stable, with global economic growth around 5% per annum over the period 2004-07. Business cycle volatility decreased, at least among the industrial countries.
2 D E F I N I N G G L O B A L I M B A L A N C E S
Infl ation was tame in spite of the strong growth environment. Financial market volatility and risk aversion were at record lows. Having said that, a number of market corrections (for example in May 2006 and February 2007) as well as the
fi nancial market turmoil that started in August 2007 signalled that markets considered some re-pricing of risk necessary. Still, emerging markets appear to have been more resilient to fi nancial turmoil in the mid-2000s than a decade earlier. The emergence of new players, the deepening fi nancial globalisation and the stable macroeconomic environment complicate the assessment of imbalances. Large imbalances could be seen as an equilibrium, market-driven outcome in a world operating under a new paradigm. The sustainability of external imbalances becomes hard to measure, as traditional metrics of sustainability may not apply in an era of enhanced fi nancial integration. Imbalances could be argued to be a side effect of stronger global growth, whose benefi ts strongly outweigh the costs.
2.2 TWIN MOTIVES TO MONITOR TRENDS IN GLOBAL IMBALANCES
A good understanding and close monitoring of global imbalances are important for two reasons. First, large and protracted external imbalances can be linked to distortions in economic decision-making, especially to the extent that such imbalances deviate from the levels at which they would be in a world with full price fl exibility and perfect competition. Such deviations may be caused by public policies or private sector decisions. One example could be the unprecedented pace of reserve accumulation – an anachronism in an era with a never-seen share of currencies with fl oating exchange rate and central banks targeting infl ation – which may create distortions in asset prices. Excessively easy global liquidity conditions may fuel unwarranted risk taking and lead to bubbles in global asset markets. Exchange rate pegging on the part of some emerging economies with large imbalances may lead to sustained deviations from equilibrium. These policy choices may have an impact on private sector decisions and
on fi nancial market prices, including on the returns on assets held by reserve accumulators. Second, external imbalances entail risks, both under a scenario of unwinding (disruptive macroeconomic developments) and under a scenario of further increasing imbalances (protectionist pressures). An unwinding is likely to affect all areas of the global economy, given the unprecedented scale and unique geographical reach of the imbalances. The large stock of international fi nancial portfolios increases the potential fall-out from large asset price changes. Financial transmission channels have become very important, as illustrated in February 2007, when a shock in a “remote” segment of the global fi nancial markets (Shanghai’s stock market) propagated to the entire spectrum of global fi nancial markets, or in July-August 2007, when tensions in a specifi c sub-segment of the US fi nancial markets (mortgage loans) triggered a generalised re-pricing of risk across nearly all asset classes. But risks may also appear if the external imbalances continue at present levels. For instance, the persistence of imbalances may have induced markets to take a complacent view of these imbalances and to take excessively risky investment positions. Also, the existence of imbalanced trade
fl ows intensifi es calls for protectionist responses. In 2005 and 2006, 27 separate pieces of anti-China trade legislation were introduced in the US Congress. Even if the probability of concrete measures may seem small, there is a broader risk of the ongoing trade liberalisation process coming to a halt, as exemplifi ed by the ongoing diffi culties in the Doha round negotiations.
These issues also matter for the euro area, even though the euro area’s current account is at present broadly balanced. The current phase of further growing or even constant external imbalances has a tangible impact on the European economy (including the euro area, the European Union and the other European countries).2 This effect takes place through shifts
This effect may actually be asymmetric across countries, in 2
particular because some European countries run a large current account surplus (e.g. Switzerland) and others a defi cit (as is the case for many of the new EU Member States from Central and Eastern Europe). Substantial heterogeneity can also be found within the euro area, but we do not tackle this issue here.
in trade patterns, enhanced competitive pressure, as well as rapid changes in industrial structures and in the job markets. Globalisation forces also have a profound impact on infl ation and on
fi nancial developments in Europe. In the event of an unwinding, the euro area would again be directly concerned, as potential disruptions to global economic activity and fi nancial markets would clearly spill over to the euro area.
2.3 A DEFINITION OF GLOBAL IMBALANCES
The notion of global imbalances is often used but rarely defi ned. This stands in contrast to the concept of an internal imbalance, which is typically operationalised in terms of full employment and the absence of infl ationary pressures. External balances have not yet received a similarly careful defi nition in the economic literature. The concept is usually left vague and seems to fl uctuate between one extreme view (that any external position different from zero is an imbalance) and another (that any external position, no matter how large, refl ects a balance, as long as it is driven by private sector forces – what is commonly referred to as the Lawson doctrine).
At the outset, it would seem that one can defi ne global imbalances simply as “widening current account deficits or surpluses”. This notion seemed to underpin the early work on global imbalances, in particular in the late 1990s and early 2000s, when the academic and policy community focused mainly on understanding the drivers and sustainability of the US current account defi cit. While such a defi nition would be convenient, the focus on current account defi cits or surpluses does not do full justice to the phenomenon of global imbalances. In particular, it misses out the important fi nancial dimension of imbalances, as captured for instance by gross and net international capital fl ows and the build-up of international investment positions. Also, a focus on widening defi cits or surpluses is not helpful in assessing whether trends are “unbalanced” or “balanced”. The concept of imbalances suggests that positions are not in line with their long-run equilibrium value. Therefore, a defi nition
of imbalances should arguably contain some element to assess the “unbalanced” versus “balanced” nature of the external positions. With these considerations in mind, we defi ne global imbalances as:
External positions of systemically important
economies that refl ect distortions or entail risks
for the global economy.
The defi nition includes several elements: • “External positions”: this refers not only to
current account balances but also to fi nancial positions. This is crucial in view of fi nancial globalisation, which implies that the fi nancial dimension is more than the current account dimension with an inverted sign.
• “Systemically important economies”: these are economies whose macroeconomic and
fi nancial developments may have a signifi cant impact on the global economy. While the concept of systemic importance is not fully unambiguous, it is useful because it contains the notion that economies participate in global goods and fi nancial markets, and that may have a global impact either because of their size or because of other factors (e.g. important
fi nancial centres, key regional players).3
• “Refl ect distortions”: the build-up of external positions may (partly) refl ect distortions, i.e. deviations from the equilibria that would prevail in an environment of full price
fl exibility and perfect competition. The distortions can be introduced by economic policies, for instance fi xed exchange rate policies, structural policies (e.g. lack of economic fl exibility), or macroeconomic policies (e.g. public saving policy-induced distortions in private saving decisions or the infl uence of cartels on oil prices).
The list of systemically important countries may change over 3
time. For instance, Thailand appeared to be systemically relevant at the onset of the 1997 Asian crisis although it accounted for a very small share of world output (less than 1%).
2 D E F I N I N G G L O B A L I M B A L A N C E S
• “Entail risks for the global economy”: the existence of external positions may pose risks for the global economy, both under a scenario of unwinding (risk of disorderly unfolding with disruptions to macroeconomic and fi nancial stability) and a scenario of further increasing imbalances (risk of a protectionist backlash). The reference to distortions and risks captures the extent to which external positions are unbalanced, as opposed to balanced. These two notions are particularly helpful from a policy viewpoint. Our defi nition is tailored to a policy-maker’s perspective, as it relates to the two potential sources of welfare loss from global imbalances. One aspect that is not included in our defi nition is the concept of sustainability. This is a deliberate choice, because measuring equilibrium external positions is notoriously diffi cult, largely judgemental, and hugely dependant on the time horizon used. All the same, even though one may not need sustainability to defi ne imbalances, the notion may be useful as an underlying principle to organise an assessment of the main drivers of imbalances. Therefore, our discussion of the drivers of imbalances in Section 4 is underpinned by a distinction between structural factors behind current global imbalances – which imply a certain degree of sustainability over the medium term – and cyclical factors – which imply a potential element of unsustainability over the near term. Our defi nition is suffi ciently broad to encompass a number of angles from which global imbalances have been analysed over the last few years. Until 2003, the main focus was on current account positions of large economies. Around 2004, the focus shifted to imbalances in the international monetary system, as academics and policy-makers increasingly turned to more fundamental explanations for the imbalances. They found such explanations in the set-up and functioning of the international monetary system (Bretton Woods II view of Dooley, Garber and Folkerts-Landau, 2003). In 2005, attention shifted to imbalances in domestic saving and investment, with an emphasis on high savings and low investment outside the United States as key drivers of
global imbalances. In 2006, economists started to formulate integrated theories on the fi nancial aspects of global imbalances, focusing on trends in the supply of and demand for fi nancial assets as drivers of imbalances (Caballero et al., 2006, Mendoza et al., 2007).
2.4 A QUANTITATIVE GLIMPSE AT GLOBAL IMBALANCES SINCE 1870
Although the current level of global current account positions seems to have risen to unprecedented levels, the issue of global imbalances is not new. A bird’s eye view of trade balances (Chart 1) suggests that past imbalances have been signifi cant. This section considers historical examples of global imbalances in order to bring the current situation into perspective. Although history never fully repeats itself (since technological advances are made, communication facilities are improved and legal frameworks change), some valuable lessons can be learnt from the past. The objective here is not to review the individual developments taking place in each country, but to highlight two main aspects of global imbalances.4
A more detailed historical perspective on global imbalances is 4
provided for instance in Brender and Pisani (2007) or in Meissner and Taylor (2006).
Chart 1 Trade balances since 1870 (as a percentage of GDP) -25 -20 -15 -10 -5 0 5 10 1870 1890 1910 1930 1950 1970 1990 -25 -20 -15 -10 -5 0 5 10 United Kingdom United States
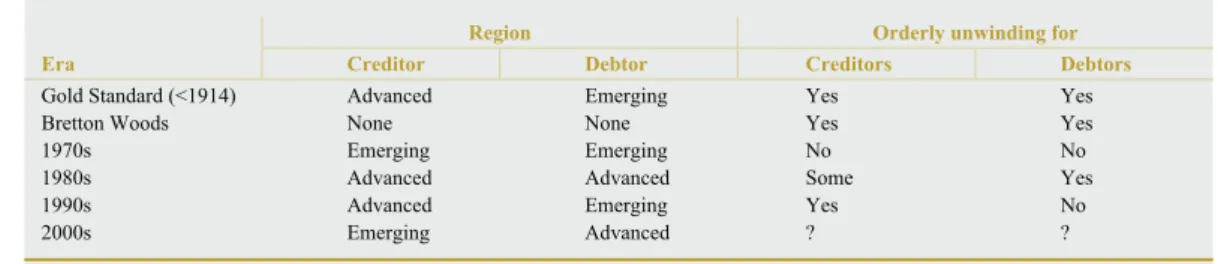
A synthetic view of past global imbalance episodes suggests substantial diversity across historical events (Table 1). Like any synthetic table, it is subject to caveats, as it implies summarising complex developments in one cell; however, it has the advantage of providing an overview. One key lesson to draw from the table is the diversity of the situations. In some periods, capital fl owed from advanced economies to emerging markets. This was the case for instance during the gold standard period preceding the First World War, when the United Kingdom funded the “emerging markets” of that time (the United States, Canada, India and Australia). It was also the case during the 1990s, when emerging market economies (mostly in Asia and Latin America, but also Russia) borrowed from advanced countries. By contrast, some episodes have seen fi nancial fl ows taking place mostly among emerging markets, or among advanced economies (see also the box below). For instance, during the late 1970s oil-exporting countries were running sizeable current account surpluses, while Latin American countries were building up signifi cant external debt positions. Another lesson from past global imbalance episodes is that not all of them unravelled in a disorderly fashion. During the gold standard period for instance, countries that were borrowing from the United Kingdom did not have diffi culty in repaying their debt.5 Although the end of the
Bretton Woods system was seen as a collapse (Bordo and Eichengreen, 1993), it did not map into a debt crisis and was not accompanied by a collapse of output.6 Among the cases in which
some countries were negatively affected by the unwinding, there is also a lot of diversity. In some
situations the debtor countries went through a period of capital drought and severe output decline, as in many emerging market countries in the 1990s (as a result of the 1995 “Tequila” crisis, the 1997 Asian crisis or the 1998 Russian crisis). Yet, in other instances, creditor countries were actually more severely affected than debtor countries. This was for instance the case of the US defi cit episode of the 1980s, which corrected during the second half of the 1980s without recessionary effects in the United States, whereas the main countries accounting for the corresponding surpluses, Japan and Germany, went through a signifi cant economic slowdown.7
Overall, the current situation is not exceptional by historical standards as there have been episodes of global imbalances before. As many of these episodes unravelled in a relatively orderly fashion, this bodes well for the present case. However, the current situation has unprecedented features in that, for the fi rst time,8
emerging economies are actually transferring net savings to advanced economies, which calls for a careful monitoring of the situation.
The view defended here is that the event which precipitated the 5
end of the gold standard was actually the World War I, i.e. an exogenous political event, rather than a collapse of the system due to inherent unsustainability. In addition, the gold standard era also witnessed some partial defaults, such as on the part of Russia, which had substantial economic and social effects, in particular in France.
If one sees the end of the Bretton Woods system as a disorderly 6
adjustment, then this represents a unique case of disorderly unwinding without a build-up of global imbalances, given that the United States did not run substantial defi cits at the time. Both economies were very dependent on their external sector and 7
were affected by the reduction in US imports, while other factors also played a role (in the case of Germany the slowdown can also be partly attributed to the side effects of unifi cation).
For the fi rst time since the late nineteenth century. This does not 8
preclude other episodes going further back in time.
Table 1 Past episodes of global imbalances
Region Orderly unwinding for
Era Creditor Debtor Creditors Debtors
Gold Standard (<1914) Advanced Emerging Yes Yes
Bretton Woods None None Yes Yes
1970s Emerging Emerging No No
1980s Advanced Advanced Some Yes
1990s Advanced Emerging Yes No
2 D E F I N I N G G L O B A L I M B A L A N C E S
Box
A REVIEW OF PAST EPISODES OF GLOBAL IMBALANCES 1 The gold standard era (until 1914)
The gold standard era, at least in the period preceding the First World War, was characterised by relatively high mobility of capital across countries, together with signifi cant stability in exchange rates. This feature of the world fi nancial system greatly facilitated a large fl ow of investment from industrial countries (mostly the United Kingdom but also France) to the (then) emerging markets, such as the United States, Canada, Australia or India. The main difference between this and the current situation is that fl ows are now running in the other direction, from poor to rich countries.
The Bretton Woods era
While the Bretton Woods system also relied on fi xed exchange rates, it differed from the gold standard as strong restrictions existed on cross-border capital fl ows. In fact, the Bretton Woods system did not allow large transfers of net savings between countries through trade. In this system, a country running a large trade defi cit would normally, in agreement with the IMF, engineer a devaluation of its currency in order to regain competitiveness and reduce the defi cit. The Bretton Woods system arrangement was ended through the exhaustion of international reserves in the anchor country.
The oil shocks of the 1970s
In the 1970s, a major terms of trade shock occurred in the world economy, implying a net transfer of resources from oil-importing countries to oil producers. By defi nition, for the oil-exporting countries to run a surplus, other countries had to run a defi cit, and Latin American countries accounted for part of this. The unravelling of this situation started with a rise in interest rates in the United States, which substantially added to the burden of Latin American countries, whose external debt was at fl oating interest rates. The reduction in absorption among Latin American countries, but also some advanced economies, in the late-1970s and mid 1980s also a had signifi cant impact on the oil-exporting countries (Saudi Arabia actually ran a current account
defi cit in the mid 1980s).
The widening and correction of the US defi cit in the 1980s
The main counterparts of the rise in the US defi cit in the early 1980s were advanced economies (Japan, Germany and the Netherlands). The second part of the 1980s saw a relatively orderly unwinding of global imbalances, accompanied by a gradual depreciation of the US dollar, supported by –among other things— low interest rates in Japan. However, one could partly (and indirectly) attribute the recession in Japan in the 1990s to the resolution of the US defi cits in the 1980s, as the low interest rates in Japan contributed to the build-up of a fi nancial bubble in Japanese fi nancial assets, whose bursting had a marked defl ationary effect in the 1990s.
1 A detailed account and very informative discussion of these past episodes of global imbalances can be found in Brender and Pisani (2007).
The emerging markets crises of the 1980s and 1990s
In the 1980s and 1990s, many emerging markets were affected by severe fi nancial debt crises, which had sizeable real effects (with output losses sometimes amounting to 20% of GDP). One particular aspect of these crises is that they corresponded to the classical case of (relatively) rich lenders investing in poorer debtor countries. It is an understatement to say that most of these episodes ended in a disorderly fashion for the debtors. For the creditors, by contrast, the losses were relatively contained (which can be partly related to the currency composition of the debt and the associated valuation gains and losses). This example suggests that even when capital
3 M E A S U R I N G G L O B A L I M B A L A N C E S 3 MEASURING GLOBAL IMBALANCES
Although the strong increase in the US current account defi cit has become one of the main international policy issues in recent years, the topic of global imbalances is not new. Indeed, economic history provides numerous examples of large transfers of net savings between countries or regions which at the time raised the question of the sustainability of the imbalance. Two natural questions emerge from such historical comparisons: fi rst, to what extent are current developments comparable to these past events, and second, what lessons can be learnt from past adjustment episodes. Answering these questions is challenging given the diffi culty of measuring global imbalances; it is not possible to summarise global imbalances in a single index.9
Accordingly, this section provides a range of indicators, covering four specifi c aspects of global imbalances: (i) the dispersion of current account positions across countries, (ii) measures of imbalances on the fi nancial side (focusing on gross and net foreign asset positions), (iii) a set of indirect measures of the economic distortions behind global imbalances, and (iv) some estimates of the associated risks. While these indicators have been used in the past for different applications, this is the fi rst time they have appeared together in the context of global imbalances.
3.1 STATISTICAL MEASURES OF WORLD CURRENT ACCOUNT POSITIONS
The extent of global imbalances can be gauged by looking at the distribution of current account positions over time, focusing on (i) the magnitude of absolute current account balances, (ii) their concentration across countries, and (iii) their persistence over time.
The absolute value of current account positions indicates not only an increase in global imbalances over time, but also an acceleration in recent years, both in value terms and as a percentage of world GDP (Chart 2).10
Whereas this index remained broadly stable during the 1980s and the fi rst part of the 1990s (between 2% and 3% of world GDP), it rose to nearly 4% in 2000. After a small decrease in 2001,11 it increased at a faster pace thereafter, to
reach well above 5% in just four years.12 Scaling
current account balances with world GDP allows in particular global growth to be controlled for: a given country could indeed run a current account defi cit permanently (in value terms) and be in a perfectly sustainable situation, as long as the absolute value of this defi cit is below its growth rate. As a fi nal comment on this statistical measure, one can note that aggregating the absolute value
An additional diffi culty stems from the fact that offi cial statistics 9
may imperfectly refl ect the true magnitude of global imbalances. In particular, the puzzling link between the US income account and foreign direct investment (FDI) stocks has attracted a lot of attention (Hausmann and Sturzenegger, 2005). A potential explanation for this puzzle is related to the role of multinational companies’ transfer prices and to tax arbitrage across countries. This paper does not tackle the issue of statistical measurement problems.
This measure is also used by the IMF in its G7 surveillance note 10
(9 February 2007).
In 2001 the US current account defi cit fell below USD 390 billion, 11
from USD 415 billion in 2000. The deceleration in US domestic output growth in 2001 (to 0.8%) and the accompanying deceleration in the growth rate of domestic demand may explain in particular weak US imports in that year (they fell, in real terms, by 2.7% year on year). The euro area current account defi cit also fell markedly in 2001. In addition, the surpluses of several countries decreased noticeably in 2001 (this includes China, Canada, Japan and several Asian emerging markets). The small decrease that took place in 2001 may have been partly related 12
to lower oil prices, which reduced the current account surplus of oil-exporting countries, and to lower output growth in the United States.
Chart 2 Sum of current account balances in the world
(USD billions; as a percentage of world GDP)
1980 1983 1986 1989 1992 1995 1998 2001 2004 0 1 2 3 4 5 6 7 USD billions (left-hand scale)
USD billions (left-hand scale), excluding intra-euro area
percentages of world GDP (right-hand scale) 3,500 3,000 2,500 2,000 1,500 1,000 500 0
of global current account positions could lead to double accounting, as any given defi cit should by defi nition be matched by a corresponding surplus. An alternative defi nition could then consist in dividing the measure plotted on Chart 2 by two. While this would affect the level of the variable, it obviously would not change its growth rate over time: by this standard, the build-up of global imbalances over time has been very substantial. Finally, one may also point out that the creation of the euro area in 1999 reduces somewhat the extent of global imbalances. When intra-euro area trade is subtracted from total current account balances, the index represented in Chart 2 is nearly 16% lower. However, this does not affect the trend.
However, this aggregate measure hides large differences across countries and regions (Chart 3). In particular, the strong increase in the US current account defi cit (which roughly doubled from slightly above USD 400 billion in 2000 to over USD 800 billion in 2006) constitutes one of the key factors behind the rising concerns about global imbalances. The main counterparts of the
US defi cit are very substantial surpluses in China and oil-exporting countries, such that the issue of global imbalances is now considered a “shared responsibility” of the international community. Taking a longer-run perspective, several countries have experienced noticeable changes in their current account balances (see Table 2, which includes only the 50 largest economies in the world). This is in particular the case of Saudi Arabia, which switched from having the largest defi cit as a percentage of GDP in 1985 to having the largest surplus in 2005. Several emerging markets also moved from a large defi cit in the early 1980s to a surplus in later years. Some industrial countries ran sizeable defi cits for most of this period (e.g. Australia), which could suggest that persistent defi cits are not necessarily unsustainable, while others ran mostly surpluses throughout the period. This is in particular the case of Japan and of the Netherlands, whose current account surpluses have been between 6% and 9% of GDP for a considerable period of time. It is also noticeable that in 2005, the group of nine countries whose current account was above 9% of GDP included six emerging market economies (the three advanced countries were Switzerland, Norway and Singapore); it also included the majority of the oil-exporting countries (fi ve out of nine). Historically, the group of countries with a current account surplus above 9% of GDP has never been as large. This already indicates the high dispersion of current account balances on the surplus side, which is addressed in more detail below.
The pattern of current account imbalances is also changing in another important respect: while current account defi cits are increasingly concentrated in a single country (the United States), current account surpluses are spread across a number of economies. Whereas the statistical measure presented in Chart 2 suggests that current account positions in the world are widening, another issue is whether this process is shared equally across countries or is confi ned to a few, large economies. Inference on the degree of dispersion can be gained by considering the following statistical measures:
Chart 3 Current account balances, key economic regions (USD billions) United States oil exporters euro area Japan China
other Asian countries
central and eastern Europe Latin America -1,200 -1,000 -800 -600 -400 -200 0 200 400 600 800 1,000 1,200 1990 1992 1994 1996 1998 2000 2002 2004 2006-1,200 -1,000 -800 -600 -400 -200 0 200 400 600 800 1,000 1,200
Source: IMF World Economic Outlook.
3 M E A S U R I N G G L O B A L I M B A L A N C E S Ssurpluses 1
/
¤
i,s.t.CAi > 0 CAi CAi i¤
¥
§
¦
¦
´
¶
µ
µ
2 i,s.t.CAi < 0 CAi CAi i¤
¥
§
¦
¦
´
¶
µ
µ
2 Sdeficits 1/
¤
with CAi indicating the current account in (US dollar) nominal terms and CAi its absolute value.
An increase in these indices denotes a greater dispersion across countries and a decrease denotes a concentration in smaller number of countries. The index “Ssurpluses” is computed only
for surplus countries and the index “Sdefi cits” only
for defi cit countries. If there are N countries, this measure is bounded between 1 (a single country accounts for the total, i.e. concentration has reached its maximum) and N (the countries have equal shares of the total, i.e. dispersion has reached its maximum).
Table 2 Current account balances – major economy groupings as a percentage of GDP
1985 1995 2005 2006
Defi cits above 9% of GDP
Saudi Arabia -12.5 Malaysia -9.7 New Zealand -9.0 -8.8
Greece -12.3 Thailand -7.9
Poland -10.3
Defi cits between 6% and 9% of GDP
Chile -8.6 Hong Kong -6.3 Turkey -6.3 -8.0
New Zealand -7.3 United States -6.4 -6.5
Australia -5.8 -5.4
Defi cits between 3% and 6% of GDP
Australia -5.3 Israel -5.3 South Africa -3.8 -6.4
Egypt -4.8 Australia -5.2
Denmark -4.6 New Zealand -5.0
Ireland -4.5 Colombia -5.0
Thailand -4.0 Saudi Arabia -3.7
Colombia -3.9 Ukraine -3.1
China -3.8 Indonesia -3.0
Surpluses between 3% and 6% of GDP
Japan 3.8 Sweden 3.4 Denmark 3.6 2.0
Israel 4.0 Norway 3.5 Egypt 3.2 0.8
South Africa 4.1 Iran 3.7 Japan 3.6 3.9
Switzerland 4.3 Finland 4.1 Taiwan 4.6 7.1
Norway 4.9 United Arab Emirates 5.1
Venezuela 6.0 Belgium 5.6
Surpluses between 6% and 9% of GDP
Netherlands 7.2 Netherlands 6.2 China 7.2 9.1
Hong Kong 7.5 Switzerland 6.8 Sweden 7.0 7.4
Iran 7.4 6.7
Surpluses above 9% of GDP
Taiwan 14.5 Singapore 17.1 Russia 10.9 9.8
United Arab Emirates 25.3 Hong Kong 11.4 10.2
Switzerland 16.8 18.5
United Arab Emirates 15.8 16.3
Malaysia 15.2 15.8
Norway 15.5 16.7
Venezuela 17.8 15.0
Singapore 24.5 27.5
Saudi Arabia 29.3 27.4 Source: IMF World Economic Outlook. This table only considers the world’s 50 largest economies. Euro area countries are reported individually only until 1999.
Since 1980 the dispersion of current account positions has changed considerably, with noticeable differences between defi cit countries and surplus countries (Chart 4). The magnitude of global defi cits is overwhelmingly accounted for by the United States, which in 2005 absorbed over two-thirds of world net savings.13 In fact,
the concentration of world defi cits in a single country (the United States) has considerably increased over time. The dotted (red) line in Chart 4, representing the degree of dispersion for the countries running a defi cit, falls over time, indicating greater concentration in a single country. In 1985, for instance, when the United States registered what was at the time a record high defi cit, it accounted for 54% of world defi cits. In 1990 this proportion had fallen to only 25%. The fi gure is now around 75% if one considers the euro area as an aggregate (and 63% otherwise, as intra-euro area defi cits are added up to the total, therefore increasing the denominator).
Turning to current account surpluses, the dispersion of current account balances has actually increased over time: the blue line on Chart 4 has risen since the early 1990s (from around 5 to nearly 15 now), implying also that more countries account for world surpluses now than in the mid-1980s. This means that
the surpluses that mirror the US defi cit are in a larger number of countries than before. In 2005, fi ve countries accounted for 50% of world surpluses (Japan, China, Germany, Saudi Arabia and Russia, noting that Germany’s surplus is part of the euro area’s overall balanced external position). In 1985, three countries only accounted for 50% of world surpluses (Japan, Germany and the Netherlands).
A rising number of countries accounting for world surpluses has the advantage of spreading risks across a larger number of players; however, it may also make the resolution of global imbalances more diffi cult. Indeed, it may introduce a problem of coordination across the regions responsible for the imbalances. For instance, in the 1980s, the US defi cit was largely accounted for – on a bilateral basis – by Germany (8.2%) and Japan (33.5%), which made international negotiations, especially in a G7 context, relatively easier. By contrast, surplus countries now include developed economies, emerging markets in Asia (primarily China, 26.3%) and Latin America (Mexico, 6.3%), as well as oil-exporting countries (Saudi Arabia, 2.7% only). The heterogeneity of these countries also implies a broader set of adjustment mechanisms, as refl ected in the IMF’s multilateral consultation.
Finally, one can also observe a strong persistence of current account balances since the mid-1990s. The individual current account positions shown in Chart 3 reveal that the main economic regions mostly run increasing surpluses or increasing defi cits, but rarely switch from one to the other. One exception is the euro
This fi gure rises to 75% when the euro area is considered as an 13
aggregate. In Chart 3 (which goes back to 1990) the euro area is considered as a single country. In Charts 2 and 4, which go further back in time, the euro area countries are considered individually to make the comparison possible. This makes an important difference, as the euro area as a whole runs a current account position close to balance, whereas some of its individual countries run large surpluses (4.1 % of GDP for Germany and 6.3% for the Netherlands) or defi cits (7.4% for Spain, above 9% for Portugal and 7.8% for Greece). It is noticeable that, also within the euro area, the current account balances of the member countries widened during the 1990s and early 2000s, although a full analysis of this pattern is beyond the scope of the present study.
Chart 4 Average dispersion of current account balance 1980 1983 1986 1989 1992 1995 1998 2001 2004 30 25 20 15 10 5 0 30 25 20 15 10 5 0 surplus countries deficit countries
Source: IMF World Economic Outlook.
3 M E A S U R I N G G L O B A L I M B A L A N C E S
area, which switched from a moderate defi cit to a moderate surplus in 2002, and back to a moderate defi cit in 2005. Since 1980 the United States has run a surplus only in 1991.
The persistence of current account positions can be assessed by looking at the following measure (using the same notation as in the dispersion indicators described above):
∀i ∑ ⎥ ⎥ ⎥ ⎦ ⎤ ⎢ ⎢ ⎢ ⎣ ⎡ − = CAi CAi ∀i ∑ ⎛ ⎝ ⎜ ⎜ ⎞ ⎠ ⎟ ⎟ t CAi CAi ∀i ∑ ⎛ ⎝ ⎜ ⎜ ⎞ ⎠ ⎟ ⎟ t−1 persistence, t abs S 2 1
This measure is bounded between 0 and 1, with 0 indicating maximum persistence and 1 maximum volatility. Following this defi nition, an increase refl ects higher volatility, or lower persistence; it is therefore convenient to take the inverse of Spersistence and plot it against time (Chart 5). Throughout the 1990s and early 2000s, persistence actually increased over time, implying that the same countries persistently ran similar defi cits (e.g. in the case of the United States) or surpluses (e.g. oil-exporting countries or China). For 2006, the persistence indicator shows a very high increase, mainly because the US defi cit did not increase as much as in previous years.
3.2 STATISTICAL MEASURES OF NET FOREIGN ASSETS POSITIONS
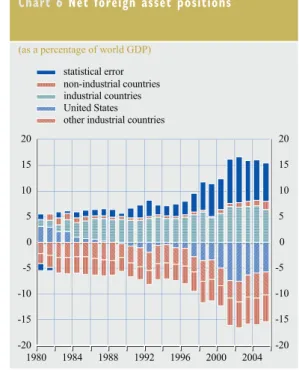
The evolution of net foreign asset positions in recent years partly mirrors that of current account positions (Chart 6). In particular, the magnitude of world net foreign positions has increased signifi cantly since the late 1990s, and the United States has the highest liabilities in the world (more than 5% of world GDP). However, marked differences can also be noted. First, the magnitude of US net liabilities has actually decreased since 2002 (owing to the depreciation of the US dollar and valuation changes, often attributed to the “dark matter” puzzle of possibly unaccounted assets, see Hausmann and Sturzenegger, 2005). Also, the United States accounts for a relatively small share of total net foreign liabilities in the world (slightly over one-third) compared with its share in current account defi cits (75%). This comparatively lower level of net foreign liabilities may partly attenuate the risk of a disorderly adjustment; however, the factors that explained this discrepancy in the past may unravel in the future. In particular, one should not take for granted that foreign investors will be willing to accumulate low-interest-bearing US assets eternally.
Another key difference between net foreign asset positions and current account positions is that while emerging markets account for the largest share of the increase in current account surpluses, they do not seem to contribute to the rise in net foreign assets (Chart 6).14 In fact,
non-industrial countries now account for about one-third of net foreign liabilities.
Further, looking at gross foreign assets (Chart 7), emerging markets account for a very small part (less than 10%) of the total. This, again, may require a reassessment of the role of emerging markets in the unfolding of global imbalances, as they actually account for a much
However, net errors and omissions are sizeable for net foreign 14
assets and could be partly allocated to emerging markets, where statistical reporting is generally perceived to be less accurate than in advanced economies. In addition, one important source of statistical discrepancies might be the valuation of FDI positions in non-listed companies.
Chart 5 Average persistence of global current account balances
0 2 4 6 8 1980 1984 1988 1992 1996 2000 2004 16 14 12 10 0 2 4 6 8 16 14 12 10
Source: IMF World Economic Outlook. Note: An increase denotes higher persistence.
smaller proportion of net and gross foreign asset positions than suggested by recent current account balances.
A detailed list of the world’s largest debtors and creditors in 2005 reveals a relatively mixed
pattern (Table 3). On the net foreign liabilities side, the three largest “countries” are all industrial (the United states, the euro area and Australia). However, Brazil and Mexico rank fourth and fi fth respectively, with cumulated net foreign liabilities (above USD 600 billion)
Table 3 Largest external debtors and creditors
15 largest debtors 15 largest creditors
Country USD bn % GDP Country USD bn % GDP
1 United States -2,546 -20 1 Japan 1,532 34
2 Euro area -1,009 -10 2 Switzerland 363 99
3 Australia -389 -55 3 China 287 13
4 Mexico -349 -45 4 Saudi Arabia 119 38
5 Brazil -329 -41 5 Singapore 105 89
6 United Kingdom -294 -13 6 Algeria 43 42
7 Turkey -169 -47 7 Venezuela 37 28
8 Canada -151 -13 8 Iran 36 19
9 Poland -124 -41 9 Libya 34 88
10 Indonesia -106 -38 10 Argentina 19 10
11 South Korea -95 -12 11 Syria 13 49
12 Hungary -94 -86 12 Botswana 8 78
13 New Zealand -92 -85 13 Nigeria 8 8
14 Sweden -87 -24 14 Bahrain 7 55
15 Thailand -58 -34 15 Oman 5 15
Source: IMF World Economic Outlook.
Note: The euro area is here considered as a single entity.
Chart 6 Net foreign asset positions (as a percentage of world GDP)
-20 -15 -10 -5 0 10 5 15 20 -20 -15 -10 -5 0 10 5 15 20 1980 1984 1988 1992 1996 2000 2004 United States
other industrial countries industrial countries statistical error non-industrial countries
Source: IMF World Economic Outlook.
Note: The category “other industrial” on the liability side refers to industrial countries excluding the United States.
Chart 7 Gross foreign asset positions (as a percentage of world GDP)
0 20 40 60 80 100 120 140 0 20 40 60 80 100 120 140 other industrial countries
non-industrial countries
United States
1980 1984 1988 1992 1996 2000 2004 Source: IMF World Economic Outlook.
Note: The category “other industrial” refers to industrial countries excluding the US.
3 M E A S U R I N G G L O B A L I M B A L A N C E S
larger than China’s net foreign assets (USD 287 billion). On the assets side, the fi ve largest creditors actually include several industrial countries (noticeably Japan and Switzerland, Singapore being perhaps a special case due to its size and role as a fi nancial centre). This means that emerging market economies are currently accumulating net foreign assets through current account surpluses in fl ow terms, but many of them still remain net debtors on a stock basis. Another implication is that the United States accounts for a much smaller proportion of world net foreign liabilities (around 37%) than its share of world net current account defi cits (75%). This discrepancy is partly due to the fact that many emerging markets, such as Brazil and Mexico, currently record current account positions close to balance, whereas they still hold net debtor positions (thus increasing the denominator when it comes to measuring the share of the United States in total world net debtor positions). In addition, the particular dynamics of the US net international investment position have played a crucial role, as the sum of past current account defi cits notoriously exceeds in absolute value the level of the country’s net liabilities. The difference between the two measures is accounted for both by the high returns earned on US assets abroad and the low interest on paid US liabilities to foreigners. These factors may, however, not persist indefi nitely (in fact, the US income account moved from a surplus to a defi cit in 2006).
Finally, another noteworthy fact is that gross asset positions (Chart 7) have increased at a much faster pace than net positions.15 Between
1995 and 2006 gross foreign assets in the world increased from 55% to 130% of world GDP, whereas net foreign assets rose only from 7% to 15% over the same period. In other words, the increase in fi nancial fl ows across countries has been relatively balanced, since they have been matched by offsetting fi nancial fl ows. This is consistent with a higher degree of fi nancial integration and risk-sharing and a lower home bias, and in turn suggests that cross-border capital fl ows have taken place not so much to participate in a transfer of net saving across
countries as to spread risk and/or allocate resources more effi ciently.
Although emerging markets as an aggregate do not account for a substantial share of (total) gross foreign assets, they contribute to a very substantial part of the build-up in international reserve assets (Chart 8). Total reserve assets have in particular reached nearly USD 1 trillion in China, mainly refl ecting a fi xed exchange rate policy amid a rising current account surplus.
3.3 INDICATORS OF DISTORTIONS
External positions do not always refl ect optimising behaviour of private agents. They may also be the result of distortions in the functioning of global goods and fi nancial markets. The presence of distortions is a source of concern as it represents a net welfare loss to
Lane and Milesi-Ferretti (2005) also note, based on a “Grubel-15
Lloyd” index, that (since the late 1980s) “the growth in gross asset trade has been more dramatic than the increased dispersion in net positions”. The Grubel-Lloyd index is defi ned as 1 – [ |A-L| / (A+L)], where A and L stand for assets and liabilities respectively: this index is therefore bounded between 0 (if asset trade occurs solely to fi nance net positions) and 1 (if the net position is zero and only gross cross-border asset trade takes place). For further detail see Milesi-Ferretti and Lane (2005) p. 3 and Fig. 4, p. 34.
Chart 8 Foreign exchange reserves (USD billions) 5,000 4,500 4,000 3,500 3,000 2,500 2,000 1,500 1,000 500 0 5,000 4,500 4,000 3,500 3,000 2,500 2,000 1,500 1,000 500 0 1990 1992 1994 1996 1998 2000 2002 2004 2006
rest of the world oil exporters Korea emerging Asia Japan China