Classification of Waking, Sleep Onset and Deep Sleep
by Single Measures
K. Šušmáková, A. Krakovská
Institute of Measurement Science, Slovak Academy of Sciences Dúbravská cesta 9, 842 19 Bratislava, Slovak Republic
E-mail: [email protected]
Abstract. The study analyses electrophysiological signals (EEG, EOG, ECG and EMG) to select measures and scoring methods suitable for the detection of sleep stages from waking to deep sleep. 85 measures, selected from relevant spectral characteristics and measures inspired by dynamical systems theory are discussed.
Some new characteristics proved to be more sensitive than the conventional scoring measures. Discriminant analysis done with Fisher quadratic classifier determined as the best measures power ratios in delta-alpha, theta-alpha, delta-sigma, delta-beta bands, relative power in delta band, fractal dimension, and coefficient of detrended fluctuation analysis. Keywords: sleep, EEG, rules of Rechtschaffen and Kales, nonlinear, spectral measures
1. Introduction
Human fatigue, sleepiness, and sleep belong to areas of great socioeconomic concern. Monitoring some physiological signals makes it possible to score sleep stages and provides the potentiality of detecting and warning of fatigue. In current neurophysiological research, big effort is spent on developing new systems suitable for automated scoring of sleep stages.
The evaluation of sleep stages is done after broadly appreciated Rules of Rechtschaffen and Kales (RKS) [1], which involves parameters, techniques and wave patterns of three physiological signals –
electroencephalogram (EEG), electrooculogram (EOG) and electromyogram (EMG). The scoring, usually accomplished by well-trained personnel, consists in classifying all 30 s pieces of a sleep recording into one of six stages - waking, rapid eye movement (REM) sleep, and nonREM sleep, divided into four stages from the lightest Stage 1
through Stage 2 to the deepest stages Stage 3 and Stage 4:
Waking (W)
There is a low voltage (10−30 µV) and mixed frequency EEG during wakefulness. Possible features are substantial alpha activity in EEG and relatively high tonic EMG.
Stage 1 (S1)
S1 is characterized by low voltage, mixed frequence EEG with the highest amplitude in 2-7 Hz range. Alpha activity may be present but it must not take more than 50% of an epoch. Vertex sharp waves may occur, their amplitude can reach the value of about 200 µV. In S1 after wakefulness slow eye movements can be present. The EMG level is lower than in the wakefulness.
Stage 2 (S2)
S2 is characterized by sleep spindles and K-complexes on a relatively low voltage, mixed frequency background activity and the absence of slow waves. Sleep spindles are bursts of brain waves of 12-16 Hz. A K-complex is a sharp negative wave (the amplitude demand is at least 75 µV)
followed by a slower positive one. K-complexes occur randomly throughout S2, but may also occur in response to auditory stimuli. The duration of these patterns should be 0.5 s at minimum. If the time between two succeeding occurrences of sleep spindles or K-complexes is less than 3 min, this interval is scored as S2, unless there are movement arousals or increased tonic activity. If the time interval is 3 min or more, it is scored as Stage 1.
Stage 3 (S3)
If 20%-50% of the epoch of EEG record contains waves with 2 Hz or slower and with the amplitudes above 75 µV the epoch is scored as S3. Sleep spindles and K-complexes may also be present.
Stage 4 (S4)
S4 has the same attributes as S3, but slow wave activity (waves with 2 Hz and slower) with the amplitudes above 75 µV appear more than 50% of the epochs. In this work a large amount of measures was tested to find the best candidates for sleep onset detection and sleep stages discrimination.
2. Subject and Methods
Data
Data of all-night polysomnographic records were kindly provided by Prof. G. Dorffner, received by The Siesta Group Schlafanalyse GmbH. The records were obtained from 20 healthy subjects, 10 men and 10 women. Ages ranged from 23 to 82 years old with an average 50 ± 21.5 years. All measures were computed on 30 s window length, for 2 channels of EMG, 2 channels of EOG, 6 EEG channels (derivations: Fp1-M2, C3-M2, O1-M2, Fp2-M1, C4-M1, O2- M1, where M1, M2 are the left and right mastoids, see Figure 1) and 1 channel of ECG. Following numbers of sleep stages were analyzed: 1786 states of waking, 870 of S1, 3470 of S2, 1246 of S3, and 1463 of S4.
Figure 1.: derivations of EEG, EOG, and EMG signals, modification of picture in [1]
Computed measures
Following measures were computed for all 11 channels: zero-crossing rate, average amplitude, variance, skewness, kurtosis, normality test [2], spectral moments [3], spectral edge [4], spectral exponent [5], spectral entropy [4], fractal dimension [6], coefficient of detrended fluctuation analyses [7, 8], entropy [9], absolute spectral powers [10], relative spectral powers [10], ratios of relative powers [10]. Coherence [10], phase angles, [10] and mutual information [9] were computed for 29 combinations of EEG, EOG, EMG, and ECG channels.
Powers, coherences, and phase angles were computed in following frequency bands: delta 1: 0.5 - 2 Hz, delta 2: 2 - 4 Hz, theta 1: 4 - 6 Hz, theta 2: 6 - 8 Hz, alpha 1: 8 - 10 Hz, alpha 2: 10 - 12 Hz, sigma 1: 12 - 14 Hz, sigma 2: 14 - 16 Hz, beta 1: 16 - 25 Hz, beta 2: 25 - 35 Hz, beta 3: 35 - 45 Hz, gamma 1: 60 - 95 Hz, gamma 2: 95 - 128 Hz, and total power: 0.5 Hz -128 Hz. Ratios of relative powers were computed between the main frequency bands: alpha-beta, alpha-gamma, alpha-sigma, alpha, beta, gamma, delta-sigma, delta-theta, gamma-beta, sigma-beta, sigma-gamma, alpha, theta-beta, theta-gamma, theta-sigma.
Discriminant analysis was done by Fisher quadratic classifier, which is appropriate for multinormal data and for classes with different covariance matrices [11].
Measures were tested on discriminating between several conditions during the first sleep cycle – between waking (W) and sleep (all sleep stages taken together),
between four stages W-S1-S2-SWS (slow wave sleep – S3 and S4 of nonREM sleep), and also between pairs of states W-S1, S1-S2, and S2-SWS. Discriminant analysis was done for one-dimensional case to find out the best single performing measures. Training set was constructed as a random choice of 90% of values of each class, testing was done on the rest of the data. This procedure was repeated 100 times. Error rate was computed as the ratio of all misclassified states to the size of the testing set.
3. Results and discussion
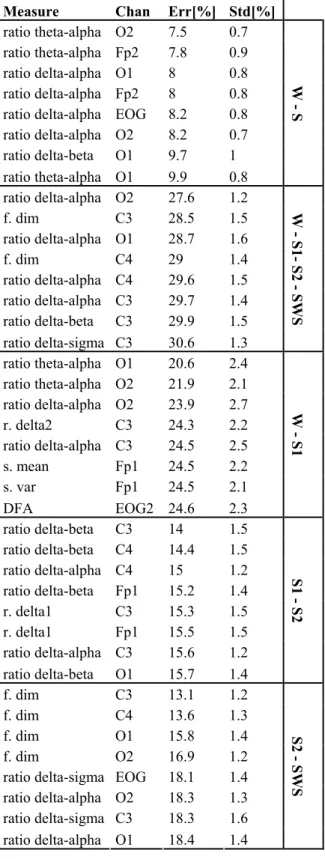
Table 1 presents the list of the best single performing measures with their mean and standard deviation of classification error. The best single performing measures in classification between sleep and waking were power ratio between bands theta– alpha, delta-alpha, and delta-beta. The mean error was from 7.5 ± 0.7 %, the error of stage W classification was higher (from 22.8%) than of S (from 3.6%).
In classification just between states W and S1 the best discriminator was power ratio theta-alpha, with the mean error of 20.6 ± 2.4 %; the error of W classification was smaller (from 13.7%) than of S1 ( 34.8 %). The best discrimination between states S1-S2 was done by power ratio delta-beta, with the mean error from 14 ± 1.5 %; again the Stage 1 was more difficult to discriminate (error of S1 was 47.3%, error of S2 was 5.7%).
Fractal dimension turned up to be the best measure for discrimination between S2 and SWS with the mean error from 13.1 ± 1.2 %.
In classification with four classes – W, S1, S2, and SWS the best discriminators were power ratio delta-alpha and fractal dimension; the mean error was 27.6 ± 1.2
Measure Chan Err[%] Std[%] ratio theta-alpha O2 7.5 0.7 ratio theta-alpha Fp2 7.8 0.9 ratio delta-alpha O1 8 0.8 ratio delta-alpha Fp2 8 0.8 ratio delta-alpha EOG 8.2 0.8 ratio delta-alpha O2 8.2 0.7 ratio delta-beta O1 9.7 1 ratio theta-alpha O1 9.9 0.8 W - S ratio delta-alpha O2 27.6 1.2 f. dim C3 28.5 1.5 ratio delta-alpha O1 28.7 1.6 f. dim C4 29 1.4 ratio delta-alpha C4 29.6 1.5 ratio delta-alpha C3 29.7 1.4 ratio delta-beta C3 29.9 1.5 ratio delta-sigma C3 30.6 1.3 W - S1- S2 - SWS ratio theta-alpha O1 20.6 2.4 ratio theta-alpha O2 21.9 2.1 ratio delta-alpha O2 23.9 2.7 r. delta2 C3 24.3 2.2 ratio delta-alpha C3 24.5 2.5 s. mean Fp1 24.5 2.2 s. var Fp1 24.5 2.1 DFA EOG2 24.6 2.3 W - S1 ratio delta-beta C3 14 1.5 ratio delta-beta C4 14.4 1.5 ratio delta-alpha C4 15 1.2 ratio delta-beta Fp1 15.2 1.4 r. delta1 C3 15.3 1.5 r. delta1 Fp1 15.5 1.5 ratio delta-alpha C3 15.6 1.2 ratio delta-beta O1 15.7 1.4 S1 - S2 f. dim C3 13.1 1.2 f. dim C4 13.6 1.3 f. dim O1 15.8 1.4 f. dim O2 16.9 1.2
ratio delta-sigma EOG 18.1 1.4 ratio delta-alpha O2 18.3 1.3 ratio delta-sigma C3 18.3 1.6 ratio delta-alpha O1 18.4 1.4
S2 - SWS
Table 1: list of the best single performing measures in classification task with 2 classes (resp. 4 classes in the second case);
Abbreviations: Chan – channel; Err, Std – mean and standard deviation of the total error of the classification; W - wake, S sleep, f. - fractal, r. - relative, s. – spectral, DFA – coefficient of detrended fluctuation analyses
%, however all measures had problem to discriminate S1.
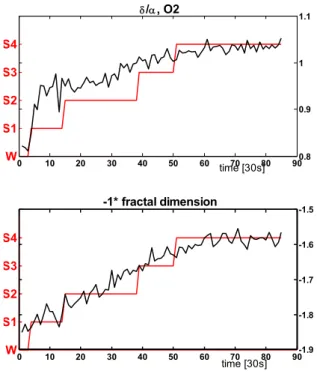
The efficiency of power ratios between relative powers in lower frequency bands to higher frequency bands are in good agreement with RKS. On the other hand the high classification ability of the fractal dimension is quite surprising. Fractal dimension reflects the complexity of signals. In this study the dimension was significantly decreasing with the level of vigilance. This result supports the hypothesis that during sleep onset many nervous centres attenuate and the brain becomes a less complex system compared with waking.
The evolutions of fractal dimension and power ratio delta-alpha during sleep onset are depicted in Figure 2.
Figure 2: Evolution of two best measures - ratio between relative powers delta/alpha and fractal dimension - during sleep onset for one subject. Comparison with hypnogram (red line).
Similarly to [4], our results suggest that human brain goes through several relatively stable psychophysiological states as falling asleep and the combination of traditional spectral and novel nonlinear measures appears to be a very promising
approach to the discrimination of particular sleep stages.
Acknowledgements
This work was supported by Slovak Research and Development Agency (RPEU-0008-06).
References
[1] Rechtschaffen A. and Kales A. (Eds.): A Manual of Standardized Terminology, Techniques and Scoring System for Sleep Stages of Human Subject, US Government Printing Office, National Institute of Health Publication, Washington DC, 1968. [2] Galbraith, C. G. and Wong E.: Moment analysis of EEG amplitude histograms and spectral analysis: relative classification of several behavioral tasks, Perceptual and
Motor Skills, 76, 1993, p. 859-866
[3] Vogel F., Holm S., and Lingjærde O. C.: Spectral moments and time domain representation of photoacoustic signals used for detection of crude oil in produced water, In Proc. Nordic Symp. on Physical Acoustics, Ustaoset, Norway, 2001.
[4] Fell J., Röschke J., Mann K., and Schäffner, C: Discrimination of sleep stages: a comparison between spectral and
nonlinear EEG measures,
Electroencephalography and clinical
Neurophysiology, 98, 1996, p. 401-410.
[5] Pereda E., Gamundi A., Rial R., and González, J.: Nonlinear behaviour of human EEG: fractal exponent versus correlation dimension in awake and sleep stages, Neurosci. Lett., 250, 1998, p. 91– 94.
[6] Higuchi T.: Approach to an irregular time series on the basis of the fractal theory, Physica D, 31, 1988, p. 277 – 283 [7] Little M., McSharry P., et al: Nonlinear, biophysically-informed speech pathology detection, In Proceedings of
W S1 S2 S3 S4 δ/α, O2 0 10 20 30 40 50 60 70 80 900.8 0.9 1 1.1 time [30s] W S1 S2 S3 S4 -1* fractal dimension 0 10 20 30 40 50 60 70 80 90-1.9 -1.8 -1.7 -1.6 -1.5 time [30s]
ICASSP, Toulouse, France, 2006, EEE Publishers.
[8] Peng C.-K., Havlin S., Stanley H. E., and Goldberger A. L.: Quantification of scaling
exponents and crossover phenomena in nonstationary heartbeat time series, Chaos, 5, 1995, p. 82 – 87
[9] Moddemeijer R.: On estimation of entropy and mutual information of continuous distributions, Signal
Processing, 16(3), 1989, p. 233 246
[10] Thatcher W., North R. D., and Biver C.: EEG and intelligence: Relations between EEG
coherence, EEG phase delay and power,
Clinical Neurophysiology, 116, 2005, p.
2129-2141
[11] Meloun M., Militký: J. Statistická analýza experimentálních dat (Statistical Analysis of Experimental Data, in Czech). ACADEMIA, Praha, 2004.
![Figure 1.: derivations of EEG, EOG, and EMG signals, modification of picture in [1]](https://thumb-us.123doks.com/thumbv2/123dok_us/1787426.2755164/2.892.473.777.108.235/figure-derivations-eeg-eog-emg-signals-modification-picture.webp)