Christina Pavlopoulou
Purdue University
Electrical and Computer Engineering
West Lafayette, Indiana 47906 USA
+1 650 494 3499
[email protected]
Michal Young
University of Oregon
Computer Science Department
Eugene, Oregon 97403-1202 USA
+1 541 346 4140
[email protected]
ABSTRACT
Structural coverage criteria are often used as an indica-tor of the thoroughness of testing, but complete satisfac-tion of a criterion is seldom achieved. When a software product is released with less than 100% coverage, testers are explicitly or implicitly assuming that executions sat-isfying the remaining test obligations (the residue) are either infeasible or occur so rarely that they have neg-ligible impact on quality. Violation of this assumption indicates shortcomings in the testing process.
Monitoring in the deployed environment, even in the beta test phase, is typically limited to error and sanity checks. Monitoring the residue of test coverage in ac-tual use can provide additional useful information, but it is unlikely to be accepted by users unless its perfor-mance impact is very small. Experience with a proto-type tool for residual test coverage monitoring of Java programs suggests that, at least for statement coverage, the simple strategy of removing all probes except those corresponding to the residue of coverage testing reduces execution overhead to acceptably low levels.
Keywords
Testing, coverage, instrumentation.
1 INTRODUCTION
Quality assurance activities in the development environ-ment, including systematic dynamic testing, cannot be performed exhaustively, therefore they always depend on models. Static analysis depends on the delity of models extracted for analysis. Statistical testing for re-liability estimation depends on models of program us-age. Partition testing depends on the models used to di-vide program behaviors into classes that should be \cov-ered." Discrepancies between these models and actual program behavior are valuable information, even when they don't result in observed program failures, because
they indicate how quality assurance activities in the de-velopment environment can be improved. For example, having some way of judging when \enough" testing has been done can be valuable in a negative sense. Test ad-equacy criteria indicate, not when testing is denitely adequate, but when there is evidence that a set of tests is inadequate because some signicant class of program behaviors has never been tested.
The family of structural coverage criteria (statement coverage, branch coverage, dataow coverage, etc.) are based on syntactic models of program control and data ow. These syntactic models are conservative in the sense that they include not only all control and data ows that will occur in any execution, but also many infeasible paths that can never occur. It is (provably) impossible to determine exactly which paths are infea-sible. Thus even exhaustive testing would often fail to satisfy structural coverage criteria.1 When a software product is released without 100% coverage, testers are explicitly or implicitly assuming that the remaining test obligations (the residue) is either infeasible, or occurs in a vanishingly small set of possible executions.
We cannot completely avoid models and assumptions. What we can do is validate the models we use. If we have implicitly or explicitly assumed that a particular path or region in code is never, or almost never exe-cuted, then knowing that an execution of that path or region has occurred in actual use is valuable informa-tion, even if the software performed correctly in that case. However, in current practice this is not possible since there is a sharp divide between unit, integration, and system testing on the one hand, and feedback from deployed software on the other. While developers have access to a variety of monitoring tools in the develop-ment environdevelop-ment, monitoring in the deployed environ-ment is typically limited to error and sanity checks, and the channel from users back to developers is just a list of trouble reports. Residual test coverage monitoring exploits the opportunity provided by increasingly ubiq-1Frankl [5] has dened variant criteria relative to feasible
paths, but practically speaking that does not change the prob-lem considered here.
uitous networking to enrich the feedback channel and validate one kind of model used in the development en-vironment.
The remainder of this paper is organized as follows: Section 2 discusses potential objections to residual test coverage monitoring and motivates investigation of the problem of performance impacts. Section 3 sketches the design of a prototype tool constructed to evaluate a sim-ple approach to minimizing performance impacts in the deployed environment, and Section 4 reports measuments obtained with the tool. Sections 5 discusses re-lated work and open issues, and Section 6 concludes.
2 RESIDUAL TEST COVERAGE
MONI-TORING
The purpose of residual test coverage monitoring is to provide richer feedback from actual use of deployed soft-ware to developers, helping developers validate and re-ne the models they have relied upon in quality assur-ance. To be successful, run-time monitoring must over-come at least two classes of potential objections from users.
The rst class of potential objections is related to secu-rity, condentiality, and privacy. There is probably no complete solution to the condentiality problem since the most innocuous seeming communications to devel-opers could convey condential information gathered from users.2 Communication of any information from actual use will be unacceptable to some users and in some application domains. This class of objections can be partially avoided by targeting the beta test phase, in which users are already used to providing some infor-mation to developers, and by limiting communication to forms that are observable and controllable by the end-user (for example small textual e-mail messages that the user can inspect before sending).
The second class of potential objections is related to per-formance, including degradation of responsiveness and perturbation of real-time behavior. Sensitivity to per-formance concerns diers widely among dierent classes of software, and there will be some applications in which no run-time monitoring is acceptable. On the other hand, we believe there is a large class of applications in which some very modest performance degradation is acceptable, particularly in the beta test phase.
In the longer term, we believe it will be useful to pro-vide deployed software with adjustable levels and focus to address performance requirements with user control to address concerns of security, and condentiality. One
2In standard terminology, this information is a potential covert channel. The basic block information described in the following
sections can be used as a covert channel by including tests of of condential information in the application, so that execution of a particular block indicates the outcome of the test.
can easily imagine uses for very detailed monitoring, sucient to completely reproduce an unanticipated be-havior, and there are no doubt situations in which the inevitable overhead of such detailed monitoring would be acceptable. However, we have chosen to concentrate initially on the other end of the spectrum, establishing that some useful information can be gathered even when the tolerance for performance degradation is small. The prototype tool described in the following sections of this paper selectively monitors execution of Java pro-grams for a simple test coverage criterion, equivalent to statement coverage. Initially, all basic blocks are mon-itored, but subsequent to a few test runs the program can be instrumented again, removing monitoring of ba-sic blocks that have already been covered and leaving only the probes needed to recognize execution of the \residue" of unexecuted code. Since the high-frequency program paths tend to be executed on almost every pro-gram run, the cost of selective reinstrumentation quickly decreases. For the programs we have tested, after a few iterations of testing and reinstrumentation the run-time overhead of execution monitoring becomes insignicant.
3 A RESIDUAL COVERAGE TOOL FOR
JAVA
We have implemented a simple residual test coverage monitoring tool for Java applications and applets. The prototype tool provides a record of which basic blocks (hence which statements) have been executed at least once in a series of test runs. An XEmacs library pro-vides a way to view cumulative coverage graphically, by highlighting regions of code that have not been ex-ecuted. This section sketches the overall design of the tool and a few details of its implementation; full de-tails can be found in the M.S. thesis of the rst author [13]. Except for the choice of object code instrumen-tation, which is specic to Java, the design should be equally applicable to traditionally compiled procedural and object-oriented languages.
Overall process
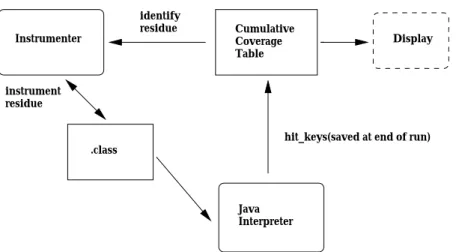
Figure 1 illustrates the overall process of program in-strumentation and coverage monitoring. An object code instrumenter places instrumentation in the program, re-ferring to a cumulative coverage table to place probes only on the as-yet unexecuted \residue." Initially noth-ing has been covered, so a probe is placed in every basic block of the program. The instrumented class les are executed by an (unmodied) Java interpreter, and as a side eect the instrumentation creates a le recording which basic blocks were executed. After one or several test runs, the instrumenter is invoked again to place probes only in the blocks that remain unexecuted.
Key structures
.class
Instrumenter CumulativeCoverage Table Display Java Interpreter identify residue
hit_keys(saved at end of run) instrument
residue
Figure 1: Instrumentation process: in every iteration the basic blocks that were not covered in previous executions are instrumented and the new class le is executed in order to collect coverage information.
minimize execution time overhead by moving as much computation as possible to the instrumentation and post-processing phases. Residual test coverage moni-toring provides one extra opportunity for optimization, compared to conventional coverage monitoring: Since the number of blocks monitored may be far fewer than the number of blocks in the program, we can use smaller keys to index blocks at run time. This introduces an extra level of indirection in the auxillary tables which are produced at instrumentation time and interpreted in post-processing.
The key data structures are:
An Id Table which associates a unique identier (block id) with each basic block in a program. The Id Table must be stable in the sense that, if the same program is compiled twice without changes, the same unique identiers are associated with each basic block.
A Coverage Table recording the basic blocks (ele-ments of the Id Table) that have been covered in previous executions; this corresponds to the cumu-lative coverage table in Figure 1. It could be a simple list of block identiers or, as in our imple-mentation, an array of booleans indexed by block id.
A Correspondence Table that associates integers (hit keys) with block ids. Hit keys are integers in the range 0:::n, where n is the number of basic blocks that have not been covered when the instru-menter is run. When n is small, a more ecient code sequence can be used for each run-time probe. The instrumenter creates a new set of hit keys each time the program is reinstrumented, and creates
0 1 2 3 4 5 6 7 8 9 10 0 1 2 3
ID Table: block id → basic block (stable)
Correspondence: hit key → block id (changes at each re-instrumentation) Hit table (run-time) Coverage table Hit keys Block Ids Source code
Figure 2: Tables for maintaining the information needed for selective monitoring
the correspondence table so that a post-processor can update the coverage table from a smaller table of hit keys.
When an instrumented program is executed, a Hit-Table indexed by hit keys is maintained. The hit table is a simple array of booleans, initially all false.
HitTable[i]will be set to true when the i-th basic
block has been executed.
The relation among the various tables appears in Fig-ure 2.
Execution of a probe at run time causes a single boolean to be set in the hit table. The table is dumped to a
le at the end of execution, and a post-processor up-dates the coverage table correspondingly. In the case of deployed software, the usual case would be an empty hit table, and the writing and post-processing phases could be skipped except in the exceptional cases when an untested region of code has been executed; the post-processing phase would also take place in the develop-ment environdevelop-ment rather than the eld environdevelop-ment. In our prototype, however, we simply dump and process the hit table after every run.
Object Code Instrumentation
While the structures and processing described above should apply to most procedural and object-oriented languages, the strategy we chose for instrumenting pro-grams was strongly inuenced by the target language. Java programs and applets are typically compiled to a byte-code format and interpreted by a byte-code in-terpreter called Java virtual machine [10]. For other languages, an instrumenter based on source-to-source translation or modication of an existing compiler might have been a better choice, but for Java we found direct instrumentation of object code (class les) more attrac-tive.
Java byte code is stack-oriented, whereas the instruction set architectures of the dominant contemporary proces-sors are register-oriented. The only practical way to insert instrumentation that aects register allocation is to insert the instrumentation at the level of source or intermediate code, leaving adjustment of the register allocation to the compiler back end. In contrast, it is relatively easy to insert a few stack-oriented instructions in a stack-oriented instruction stream, leaving the stack unchanged. Equally important is what is not possible in stack-oriented code: In a machine with a generous set of registers, it is worthwhile to work very hard at minimizing the number of memory accesses by making clever use of registers (e.g., as in the path proling tech-nique of Ball and Larus [2]), but stack code presents no such temptation.
At a more pragmatic level, we had access to standard Java packages for reading, interpreting, and writing Java class les, which greatly reduced the eort re-quired to produce an object-code instrumenter. It is relatively simple to extract control structure and other information from the assembly-language level of infor-mation provided by these Java packages, and the les also contain debugging information that served our need for associating regions of object code with regions in the source les.
Basic blocks are identied in the byte codes using stan-dard algorithms [20]. At the head of each basic block that has not previously been executed we insert a call to Monitor.hit(hit_key), a method that stores one
value in a boolean array. If the hit key is less than 256, the code is
bipush hit_key invokestatic #index
where index is the location of the address of method Monitor.hit(int)in the constant pool. ClassMonitor
is the run-time library which encapsulates the hit table and provides initialization and nalization. Directly ac-cessing the array might be faster than a method call, but would require more inline code.
In Java, every class is allowed to have a \main" method, and the user can begin execution from any class, so we simply instrument the main methods of all classes. This simple expedient was adequate for our purposes, al-though obviously inappropriate for a production-quality tool.
Producing valid bytecode
Instrumentation must be inserted in such a way that the Java Virtual Machine Specication is not violated. The Java interpreter checks each class le to deter-mine that it it conforms to the format dictated by the virtual machine specication and that appropri-ately typed arguments are on the top of the stack when needed. The stack-typing requirement is easily met, since the inserted instrumentation has no net ef-fect on the stack contents (it pushes and then con-sumes one argument), but the maximum stack depth of each method must be incremented by four to acco-modate the added instructions. Method calls in Java are made by indirection through a table of constants (recall the invokestatic #index instruction in the sample
code above), so entries for the instrumentation meth-ods must also be added to the constant pool of each instrumented class. In addition, the target addresses of control transfer instructions and the exception table must be adjusted. Target addresses of lookupswitch
and tableswitchmust also be adjusted and, in some
cases, aligned by inserting zero bytes.
Multi-threading
Java programs typically have multiple concurrent threads of control. Execution of a coverage probe at run-time is simple and does not require mutual exclu-sion, on the fairly conservative assumption that con-current stores of the same boolean value to a memory location will result in that value being stored. The only real issues we encountered were in ensuring proper ini-tialization and nalization (dumping to a le) of the run-time table.
Multithreaded programs can be applets or programs that use threads or graphics. In the case of applets, execution of the program begins from the constructor
of the applet and ends at the destroy method. Thus, unlike single-threaded programs, we do not need to in-strument the main method. While applets are designed primarily for execution in web browsers, we executed them in the appletviewer application to relax the usual web browser security restriction against writing to a le. The case of multithreaded Java applications which are not applets is more dicult. The beginning of execu-tion is easy to recognize (execuexecu-tion begins at the main
method of some class), but termination can occur in dif-ferent places; basically whenever there is a system call to exit the program. In multithreaded testcases the call to dump the le with execution information was inserted manually before the approriate system calls.
4 EXPERIENCE
We have measured the performance impact of residual test coverage monitoring on four applications ranging in size from 55 to 4000 lines. The experiments were conducted in a SPARC 5 processor at 70 MHz, run-ning the Solaris operating system. Two of the tions, ArcTest and Sorting, are an applet and applica-tion taken from the examples distributed with the Sun Java Development Kit (JDK), version 1.0. The other two are Java applications that were developed in our laboratory, the larger of these being the residual in-strumentation tool itself. In general, no changes were needed in the code to execute the dierent test cases, except for minor changes to catch the beginning and ending of execution in multithreaded programs as dis-cussed in the previous section. Java applications were executed by the Java interpreter provided in the JDK, and Java applets were executed in the appletviewer ap-plication provided in the JDK.
We observed generally that while the execution of a fully instrumented program may have signicant overhead, after a few iterations of test execution and reinstrumen-tation the overhead reduces dramatically. The addi-tional execution time required for the instrumentation statements of a program depends mainly on the size and number of loops as well as on the size of the input data. In practice one would reinstrument only after sev-eral test executions, but for measurement purposes we reinstrumented after processing each test case.
The execution time (elapsed wall time) of each test pro-gram was measured with the Java system service for time measurement. The execution times in the tables below are averages over ten runs, rounded to the nearest 0.1 second. The rst row of each table contains the ex-ecution times of the uninstrumented application for dif-ferent data inputs. The execution times for the instru-mented program (second row in the tables) were mea-sured as follows: initially instrumentation is inserted in every basic block and the program is executed (10 times)
test 1
original 4.5
instrumented 5.0
# blocks instrumented 29
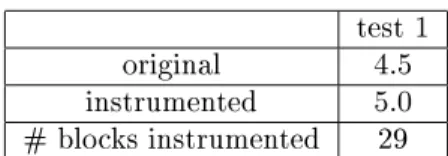
Table 1: ArcTest execution times in seconds and num-ber of blocks executed
with the rst test case (time in rst column); then the program is reinstrumented, placing probes inserted in those basic blocks that did not execute previously and the program is run with the second test case (time in second column); the process is repeated for all test cases. The last row of each table contains the number of basic blocks that were instrumented for each test case. The rst program, ArcTest, is a simple applet of ap-proximately 80 lines that draws on the screen a number of arcs with random beginning and end. In this case the overhead even from complete instrumentation is small relative to the cost of the graphics operations. Rein-strumentation was not performed on this example; we include it here for comparison because it is the only ap-plet in this group of programs.
The Sorting program (55 lines) sorts an array of ran-domly generated numbers using either binary or quick sort. The rst test case is sorting numbers with bi-nary sort, the second test case is sorting numbers with quicksort and the third is sorting numbers with quick-sort again. In the program distributed with the JDK, run times vary considerably depending on the sorting algorithm; we made them comparable by increasing the size of the arrays for the faster algorithms, to make the trend in instrumentation overhead easier to see in the tables (we have also measured the program without this modication, with similar results). In the rst test, the instrumentation overhead is nearly 130%. In the second test, which executes a dierent sorting algorithm and therefore mostly in a dierent region of code, overhead remains very high at nearly 160%. The third test case uses the same sorting algorithm as the rst, and there-fore executes in the same region of code. In this case no probes are executed, and the program with residual instrumentation executes in essentially the same time as the uninstrumented program.
Elevator (650 lines) is a simulation program for the op-eration of two elevators. Unlike the sorting algorithm, it does not consist primarily of tight loops, so even the overhead of complete instrumentation is only about 15%. After two iterations of testing and reinstrumenta-tion the overhead is reduced to 1.5%.
test 1 test2 test3
original 24 20 20
instrumented 55 52 20
# blocks instrumented 43 25 6
Table 2: Sorting execution times in seconds and number of blocks instrumented
test 1 test 2 test 3
original 5.5 6.1 6.5
instrumented 6.3 6.8 6.6
# blocks instrumented 323 240 119
Table 3: Elevator execution times in seconds and num-ber of blocks executed
lines) has been instrumented and has been used to in-strument the program Sorting. The execution over-head of full instrumentation is approximately 9.3%. Af-ter two iAf-terations of testing and reinstrumentation, the overhead of residual coverage monitoring falls below the level that we were able to measure.
5 DISCUSSION
Related work
We are not aware of prior attempts to gather struc-tural test coverage information from deployed software, although Cusamano and Selby report that Microsoft gathers detailed use proles from specially instrumented versions of its products [3, pp. 377{378].
One class of \residual" monitoring that is already com-mon, though, is run-time checks of assertions. As with coverage monitoring, tolerance of run-time overheads for assertion checking diers between the development en-vironment and the deployed enen-vironment. For example, evaluating a quantier by enumerating elements of a nite set may be acceptable when testing software in the development environment, but unacceptable for de-ployed software. Some assertion checking systems rule out very expensive predicates entirely (ADL [19] takes this approach), while others like Gnu Nana [12] provide exible ways to deactivate some checks while leaving
test 1 test 2 test 3
original 4.3 1.7 4.4
instrumented 4.7 1.8 4.4
# blocks instrumented 1000 614 547
Table 4: Instrumentation program execution times in seconds and number of blocks executed
others active. The Anna project [11, 18] is the root of much of the recent research in enriching run-time checks [16, 17, 19].
Instrumentation for cheap run-time coverage monitor-ing has obvious relations to cheap instrumentation for other purposes, including performance proling. Cov-erage monitoring requires less information than perfor-mance proling, since the latter does not distinguish whether code is executed once or one thousand times, and this makes the design of cheap coverage monitor-ing considerably simpler than cheap performance pro-ling. Agrawal has shown that the number of program probes needed for basic block coverage monitoring can be reduced considerably by using control ow analysis (pre- and post-dominator information) [1]. The rela-tive savings in the cost of residual coverage monitoring over full monitoring would be correspondingly reduced if Agrawal's technique were applied, and vice versa the savings from Agrawal's technique would be less signif-icant if applied to residual coverage obligations after a few tests. Nonetheless it may be be useful to combine the techniques, not so much to achieve further reduc-tions in execution time overheads as to reduce space overheads, which residual coverage monitoring is less eective at reducing.
The object code instrumentation approach discussed in Section 3 is related to a variety of tools for instru-menting binary machine code [7, 21, 6, 15]. Among tools suited for instrumenting Java byte codes, the most closely related is Lee's Bytecode Instrumenting Tool (BIT) [8, 9]), which was developed contemporaneously but independently. BIT is more general than our tool, providing a way to insert method calls in user class les. In principle, a tool like our residual test cover-age monitor could be more simply constructed using a tool like BIT, but several current limitations of BIT pre-vent us from using it in that way. BIT allows the user to specify the instrumentation statements, but it does not provide the capability of removing monitoring code automatically, nor does it maintain the links we require between source code and bytecode locations. Moreover, BIT does not (yet) properly adjust exception handling code to account for instruction relocation.
Open Issues and Future Work
As stated earlier, our tactic in exploring residual test-ing is to rst establish that some useful information can be gathered even when the tolerance for performance degradation is small before moving on to gather richer and potentially costlier information. We have so far in-vestigated residual monitoring of only the simplest test coverage criterion, albeit the one most used in practice. Many of the more stringent test coverage criteria involve sub-paths in program control ow, rather than
individ-ual points. The best known of these is data ow cover-age testing, in which execution of particular \denition use" pairs (what compiler writers know as \reaching denitions") are monitored. The interested reader may refer to [14] for denitions and an in-depth discussion of data ow testing.
It is not clear whether the run-time performance im-pact of residual test coverage monitoring can be made insignicant for data ow coverage and other path-based coverage criteria. In the worst case we might have code like the following:
if (cond1) x = ...; // 1 else y = ...; // 2 if (cond2) z = x; // 3 else z = y; // 4
with the assumptions that
the code occurs in a high frequency loop,
in each of the two \if" statements, the \then" branch is taken 50% of the time and the \else" branch is taken 50% of time,
when the \then" branch is taken in the rst \if" statement, the \else" branch is always taken in the second, and when the \else" branch is taken in the rst \if" statement, the \then" branch is always taken in the second.
We observe that the denition-use pairs (1,3) and (2,4) are never executed, even though every point in the path is executed 50% of the time. In this case, unless we transform the code, we cannot avoid monitoring at a point that is executing on 50% of the loop iterations. In some cases (including the example above) such code can be transformed to separate frequently and infrequently executed paths, but such transformations are expensive in space. Empirical evidence is needed to determine how often such pathological cases occur in real programs. Notication that a user has executed code in a way that was not adequately tested leaves to testers the task of determining how to reproduce a behavior that they have not previously encountered in testing. Even the limited information provided by our current tool should be use-ful in focusing eort on the presumably small number of reported blocks rather than the whole population of uncovered blocks, but it would be more useful to have
additional information such as input data, intermediate data values, or parts of the execution path leading to the newly exercised code. In case testers cannot easily reproduce the behavior, it would be possible to pro-vide selected users with versions of the application that are specially instrumented to provide more information about the particular behaviors of interest.
Security and condentiality concerns may be more di-cult to overcome than the performance issues that would result from providing additional information to develop-ers. As noted earlier, seemingly innocuous information communicated from the users' environment to develop-ers is a potential covert channel which could be used by an unscrupulous developer to obtain condential infor-mation. Increasing the amount of information commu-nicated exacerbates potential security and condential-ity concerns. Even a user who is willing to trust that developers are not encoding condential information in coverage records may balk at providing input data from actual executions.
6 CONCLUSIONS
We have argued for monitoring of deployed software, particularly in beta testing, that goes beyond correct-ness checks to provide validation of the models used dur-ing quality assurance. In particular, we have described how monitoring of the \residue" of test coverage criteria could be used to validate the thoroughness of testing in the development environment.
A prototype system that implements residual test cov-erage monitoring has been presented. The system mon-itors a simple (but widely used) test coverage criterion, statement coverage. By selectively reinstrumenting a program under test to monitor only the coverage obli-gations that remain unmet, it can dramatically reduce the cost of continued monitoring of programs that have been through development test. Performance measure-ments made with this tool suggest that the performance impact of residual test coverage monitoring may be low enough to be acceptable in at least some kinds of actual use, such as the beta test phase. We view the simplicity of the approach as a particular virtue.
Only the performance aspect of residual test coverage monitoring has been investigated so far. We have par-tially side-stepped issues of privacy and security by con-sidering monitoring in the beta test phase of software deployment, but more sophisticated approaches to these issues as well as the actual communication between users and developers deserve attention. Additionally, approaches to minimizing the performance impact of residual path-oriented coverage monitoring remain to be investigated; the prototype tool described here will be useful in gathering empirical data to evaluate possible approaches.
ACKNOWLEDGEMENTS
We thank the anonymous reviewers for their useful com-ments.
This eort was sponsored by the Defense Advanced Research Projects Agency and Rome Laboratory, Air Force Materiel Command, USAF, under agreement number F30602-97-2-0034. The U.S. Government is au-thorized to reproduce and distribute reprints for Gov-ernmental purposes notwithstanding any copyright an-notation thereon. The views and conclusions contained herein are those of the authors and should not be in-terpreted as necessarily representing the ocial policies or endorsements, either expressed or implied, of the De-fense Advanced Research Projects Agency, Rome Lab-oratory, or the U.S. Government.
REFERENCES
[1] Hiralal Agrawal. Dominators, super blocks, and program coverage. In Proceedings of the ACM Sym-posium on Principles of Programming Languages (POPL 94), pages 25{34, Portland, Oregon, Jan-uary 1994.
[2] Thomas Ball and James Larus. Ecient path proling. In Proceedings MICRO-29. IEEE Press, 1996.
[3] Michael A. Cusumano and Richard W. Selby. Mi-crosoft Secrets. The Free Press, 1995.
[4] Prem Devanbu and Stuart G. Stubblebine. Crypto-graphic verication of test coverage claims. In Pro-ceedings of the Fifth ACM/SIGSOFT Conference on Foundations of Software Engineering (FSE), Zurich, Switzerland, 1997.
[5] Phyllis G. Frankl and Elaine J. Weyuker. An applicable family of data ow testing crite-ria. IEEE Transactions on Software Engineering, 14(10):1483{1498, October 1988.
[6] Jerey K. Hollingsworth, Barton P. Miller, Marcelo J.R. Gongalves, Oscar Naim, Zhichen Xu, and Ling Zheng. MDL: A language and compiler for dynamic program instrumentation. In Proceedings of the International Conference on Parallel Archi-tectures and Compilation Techniques (PACT '97), San Francisco, California, November 1997.
[7] James R. Larus and Eric Schnarr. EEL: Machine-independent executable editing. In Proceedings of the Fifth ACM SIGPLAN Conference on Program-ming Language Design and Implementation (PLDI '95), June 1995.
[8] H. Lee. Bit: A tool for instrumenting java byte-codes. In Proc. USITS, 1997.
[9] H. Lee. Bit: Bytecode instrumenting tool. Master's thesis, University of Colorado, 1997.
[10] T. Lindholm and F. Yellin. The Java Virtual Ma-chine Specication. Addison-Wesley, 1996.
[11] D. Luckham and F. von Henke. An overview of Anna, a specication language for Ada. IEEE Soft-ware, 2(2):9{22, 1985.
[12] P. J. Maker. Gnu Nana: improving support for as-sertions and logging in C and C++ (web page). http://www.cs.ntu.edu.au/homepages/pjm/nana-home/.
[13] Christina Pavlopoulou. Residual coverage moni-toring of java programs. Master's thesis, Purdue University, 1998.
[14] S. Rapps and E. J. Weyuker. Selecting software test data using data ow information. IEEE Trans-actions on Software Engineering, 11(4):367{375, 1985.
[15] Ted Romer, Geo Voelker, Dennis Lee, Alec Wol-man, Wayne Wong, Hank Levy, and Brian Bershad. Instrumentation and optimization of Win32/Intel executables using Etch. In Proceedings of the USENIX Windows NT Workshop, pages 1{7, Au-gust 1997.
[16] D. Rosenblum. Specifying concurrent systems with TSL. IEEE Software, 8(3):52{61, 1991.
[17] D. Rosenblum. Towards a method of programming with assertions. IEEE Transactions on Software Engineering, 21(1):19{31, 1995.
[18] D. Rosenblum S. Sankar and D. Luckham. Concur-rent runtime checking of annotated Ada programs. In Proceedings of the 6th Conference on Foun-dations of Software Technology and Theoretical Computer Science, pages 10{35. Springer-Verlag-Lecture Notes in Computer Science, 241, 1986. [19] S. Sankar and R. Hayes. Specifying and testing
software components using ADL. Technical Report SMLI TR-94-23, Sun Microsystems Laboratories, Inc., April 1994.
[20] A. Aho R. Sethi and J. Ullman. Compilers: Princi-ples Techniques and Tools. Addison-Wesley, 1986. [21] Amitabh Srivastava and Alan Eustace. ATOM: A
system for building customized program analysis tools. In Proceedings of the SIGPLAN '94 Confer-ence on Programming Language Design and Imple-mentation, pages 196{205, June 1994.