RADAR
Research Archive and Digital Asset Repository
Value drivers within SMEs: growth and value creation within the context of the Economic Value Added® framework
Karen Dennis (2013)
https://radar.brookes.ac.uk/radar/items/6d2e39e6-1a29-4240-86f6-2c8cee64bf14/1/
Note if anything has been removed from thesis:
Copyright © and Moral Rights for this thesis are retained by the author and/or other copyright owners. A copy can be downloaded for personal non-commercial research or study, without prior permission or charge. This thesis cannot be reproduced or quoted extensively from without first obtaining permission in writing from the copyright holder(s). The content must not be changed in any way or sold commercially in any format or medium without the formal permission of the copyright holders.
When referring to this work, the full bibliographic details must be given as follows:
Dennis, K D (2013)
Value drivers within SMEs: growth and value creation within the context of the Economic Value Added® framework, PhD, Oxford Brookes University
Value Drivers within SMEs: Growth and Value Creation
within the Context of the Economic Value Added
®Framework
Karen D. Dennis
A thesis submitted in partial fulfilment of the requirements of Oxford Brookes University for the degree of Doctor of Philosophy
i
ABSTRACT
Value based performance measurement has become popular in modern day financial practices. Of the many value based measurements, the EVA® framework has gained much notoriety. It became the focus of much research because it has been widely implemented in many large organisations with professed benefits in maximizing shareholder wealth. Much of the previous work on the EVA® framework focused on the performance metric; conclusions differed as to whether the EVA® performance metric resulted in better information or whether it was better at indicating performance, and ultimately shareholder wealth. Conclusions were similar when compared to other value based measures and with traditional measures. EVA®’s management and compensation framework was also investigated, again resulting in conflicting results. Other studies focused on the theory behind EVA® and concluded that it is financially sound and was agreed to be based on established theory on residual income.
This study investigates growth and value creation in SMEs within the context of the EVA® framework. The investigation was conducted using and integrating a mixed method approach. Using purposive sampling, a range of SMEs was selected; senior management interviewed and financial reports for a 5 years period were collected. Practitioners are included for their expert views which were utilised when comparing and contrasting evidence obtained during the investigation. The study reveals some correlation between the characteristics of SMEs and the theory for the implementation of EVA®. However, it was found that SMEs lack vital information on value and value creating elements within their businesses for successful implementation of EVA®. The study fills a major gap in identifying and resolving the issue of the value drivers employed in the EVA® performance metric. The study concludes that it may be practical to implement EVA® in SMEs as it can provide information on progress and value creation.
ii
ACKNOWLEDGEMENTS
I would like to offer my sincere gratitude to those who helped me in so many ways to complete this research.
Firstly, to my Director of Studies Dr Samantha Miles who guided me with unwavering patience and understanding over the years. Your firm encouragement and belief in me propelled me through. Also to Stephen Duhan whose support and encouragement was greatly appreciated.
To the Graduate Tutor and the team in the Graduate Office, I could not have made it to the end without your help.
I would also like to thank the participants from the case study companies who made this possible. The time taken to host me at your respective companies is very much appreciated. Many thanks also to the Practitioners who took time out from their own work to contribute valuable insights.
To Alasdair and my work colleagues who supported me to Rob and Jackie who encouraged me in the darkest of times thank you; to Pete, I will be forever grateful.
Also to my BBM friends and other family members who kept me sane throughout. To Dervon, Dale, Trisha and Horace although you are all miles away you all fiercely supported me. For that I am truly grateful.
Last, but by no means least, thanks to my Mum who prayed constantly and believed that it this was all possible. Too my local support group; Kim, Giselle, Denese, Melonae, Michael, Madeline and Sophia, thank you.
iii
TABLE OF CONTENTS
ABSTRACT ... I
ACKNOWLEDGEMENTS ... II
TABLEOFCONTENTS ... III
LIST OF ABBREVIATIONS ... X
LIST OF TABLES ... XIV
LIST OF FIGURES ... XIX
LIST OF APPENDICES ... XXI
CHAPTER 1: INTRODUCTION ... 1
1.0 RESEARCH AREA ... 2
1.1 RESEARCH RATIONALE ... 3
1.2 INTEREST AND JUSTIFICATION FOR THE RESEARCH ... 4
1.3 RESEARCH PROBLEM ... 4
1.4 OVERVIEW OF THE THESIS ... 5
CHAPTER 2: PERFORMANCE APPRAISAL AND VALUATION TECHNIQUES ... 10
2.0 INTRODUCTION ... 11
2.1 ACCOUNTING PRACTICES,PROFIT MEASUREMENT AND INVESTMENT DECISIONS ... 11
2.2 PERFORMANCE AND VALUATION TECHNIQUES ... 16
2.3 SINGLE PERIOD METHODS ... 20
2.3.1PROFIT BASED METHOD ... 20
2.4 MULTI-PERIOD METHODS... 21
2.4.1 PROFIT BASED METHODS ... 22
2.4.2 CASH BASED METHODS ... 23
2.4.3 DISCOUNTED CASH BASED METHODS ... 24
2.5 THE DRIVE FOR PERFORMANCE MEASUREMENT IN COMPANIES ... 44
2.6 APPLICATION OF PERFORMANCE MEASUREMENTS ... 46
iv
CHAPTER 3: VALUE, VALUE DRIVERS AND EVALUATION ... 56
3.0 INTRODUCTION ... 57
3.1 CONCEPTUALISATION OF VALUE CREATION ... 57
3.1.1VALUE CREATION AND ORGANISATION OBJECTIVES ... 64
3.2 VALUE EVALUATION WITHIN COMPANIES ... 66
3.2.1FINANCE THEORY AND ECONOMIC PROFIT... 68
3.2.2ECONOMIC PROFIT ... 69
3.3 EVALUATION OF VALUE ... 71
3.3.1ECONOMIC VALUE ADDED® ... 71
3.3.2THE EVA®PERFORMANCE METRIC ... 77
3.3.3DISSECTING THE METRIC ... 79
3.3.4ILLUSTRATION OF EVA®CALCULATION... 95
3.4 EVA® IN PRACTICE ... 100
3.4.1EVA® AT GCPL ... 101
3.5 EMPIRICAL EVIDENCE ON EVA® ... 103
3.5.1EVA® VS.OTHER VALUE BASED MEASURES ... 117
3.6 SUPPORT FOR EVA® ... 118
3.7 CRITIQUE OF EVA® ... 120
3.8 SUMMARY ... 126
CHAPTER 4: SMALL BUSINESS ENTERPRISE DEVELOPMENT ... 129
4.0 INTRODUCTION ... 130
4.1 THE DEVELOPMENT OF SMALL AND MEDIUM-SIZE ENTERPRISE (SME) ... 133
4.2 CHARACTERISTICS OF SMES ... 139
4.3 USE OF FINANCIAL INFORMATION AND DECISION-MAKING IN SMES ... 143
4.4 FINANCING OF SMES ... 145
4.5 THE SOCIAL CONTRIBUTION OF SMES ... 152
4.5.1INFLUENCES FOR GROWTH OF SMES ... 153
4.5.2BARRIERS FACED BY SMES ... 155
v
4.7 PERFORMANCE MANAGEMENT IN SMES ... 160
4.8 EVA® IN SMES ... 161
4.9 SUMMARY ... 164
CHAPTER 5: METHODOLOGY ... 166
5.0 INTRODUCTION ... 168
5.1 THE RESEARCH PROBLEM AND RATIONALE ... 168
5.2 RESEARCH METHODOLOGY ... 173
5.2.1POSITIVISTIC RESEARCH &APPLICATION WITHIN BUSINESS RESEARCH ... 175
5.2.2INTERPRETIVIST RESEARCH &APPLICATION WITHIN BUSINESS RESEARCH ... 176
5.3 MIXED METHODOLOGY ... 177
5.4 THE NATURE OF THE RESEARCH ... 183
5.4.1OBJECTIVITY,VALIDITY,GENERALISABILITY AND TRIANGULATION IN MIXED METHOD RESEARCH ... 187
5.5 METHODS ... 189
5.5.1SELECTING THE CASE STUDIES ... 190
5.5.2THE INTERVIEWS ... 194
5.5.3VALUE INDICATOR EXERCISE... 195
5.5.4DOCUMENT ANALYSIS ... 197
5.5.5APPLYING THE DELPHI TECHNIQUE FOR DATA COLLECTION ... 197
5.5.6LONGITUDINAL STUDY ... 203
5.5.7DATA ANALYSIS ... 204
5.6 RESEARCH ETHICS ... 206
5.7 LIMITATIONS OF THE RESEARCH ... 209
5.8 SUMMARY ... 210
CHAPTER 6: PRESENTATION OF PRACTITIONER INTERVIEWS & CASE STUDIES ... 213
6.0 INTRODUCTION ... 216
6.1 AIMS AND JUSTIFICATION OF SOLICITING EXPERT OPINION ... 219
vi
6.2 FINDINGS FROM THE CASE STUDIES ... 227
6.2.1PRESENTATION OF THE VALUE INDICATOR EXERCISE ... 227
6.3 CASE 1–ABCLIMITED... 228
6.3.1COMPANY BACKGROUND ... 228
6.3.2FINDINGS FROM THE INTERVIEWS ... 230
6.3.2.1 Management, Structure & Culture ...230
6.3.2.2 Financial Information ...239
6.3.2.3 Decision-making ...246
6.3.2.4 Performance and use of Information ...249
6.3.2.5 Identifying Value within the Company ...252
6.3.3SUMMARY OF KEY FINDINGS FROM CASE 1 ... 259
6.4CASE 2–DGELIMITED ... 261
6.4.1COMPANY BACKGROUND ... 261
6.4.2FINDINGS FROM THE INTERVIEWS ... 262
6.4.2.1 Management, Structure & Culture ...262
6.4.2.2 Financial Information ...268
6.4.2.3 Decision-making ...270
6.4.2.4. Performance and use of Information ...273
6.4.2.5 Identifying Value within the Company ...275
6.4.3SUMMARY OF THE KEY FINDINGS FROM CASE 2 ... 286
6.5 CASE 3–SPLLIMITED... 288
6.5.1COMPANY BACKGROUND ... 288
6.5.2FINDINGS FROM THE INTERVIEWS ... 289
6.5.2.1 Management, Structure & Culture ...289
6.5.2.2 Financial Information ...293
6.5.2.3 Decision-making ...297
6.5.2.4. Performance and use of Information ...299
6.5.2.5 Identifying Value within the Company ...301
6.5.3SUMMARY OF THE KEY FINDINGS FROM CASE 3 ... 312
6.6 CASE 4–WICLIMITED ... 314
6.6.1COMPANY BACKGROUND ... 314
6.6.2FINDINGS FROM THE INTERVIEWS ... 315
6.6.2.1 Management, Structure & Culture ...315
6.6.2.2 Financial Information ...321
6.6.2.3 Decision-making ...325
vii
6.6.2.5 Identifying Value within the Company ...328
6.6.3SUMMARY OF THE KEY FINDINGS FROM CASE 4 ... 339
6.7 SUMMARY ... 339
CHAPTER 7: ANALYSIS OF INTERVIEWS ... 342
7.0INTRODUCTION ... 344
7.0.1 ANALYSIS OF THE QUALITATIVE DATA IN PRACTICE ... 344
7.1THEMATIC ANALYSIS OF PRACTITIONERS INTERVIEWS ... 346
7.1.1DETERMINANTS OF VALUE, VALUE DRIVERS AND EVA® ... 346
7.1.2STRATEGY FOR VALUE CREATION ... 347
7.1.3BARRIERS TO CREATING VALUE ... 349
7.1.4EVA®ADJUSTMENTS ... 350
7.1.5SUITABILITY OF EVA® IN SMALL VERSUS LARGE ORGANISATIONS ... 351
7.1.6DETERMINATION OF EVA® FOR NON-TRADED COMPANY ... 352
7.1.7MEASUREMENT OF VALUE ... 353
7.1.8EVA® VERSUS OTHER MEASURES ... 354
7.1.9PROBLEMS AND ISSUES WITH EVA® ... 355
7.1.10DESTROYERS OF VALUE ... 356
7.2THEMATIC ANALYSIS OF INTERVIEWS FROM THE CASE STUDIES ... 357
7.2.1MANAGEMENT,STRUCTURE &CULTURE ... 357
7.2.2FINANCIAL INFORMATION ... 359
7.2.3DECISION-MAKING ... 361
7.2.4PERFORMANCE AND USE OF INFORMATION ... 362
7.2.5IDENTIFYING VALUE WITHIN THE COMPANY ... 364
7.3 VALUE INDICATORS FROM THE LITERATURE ... 366
7.4 VALUE INDICATORS FROM THE CASE STUDIES ... 373
7.5 GROWTH &VALUE CREATION WITHIN THE CONTEXT OF EVA® ... 400
7.6 SUMMARY ... 401
CHAPTER 8: FINDINGS FROM THE FINANCIAL ANALYSIS ... 404
viii
8.0.1METHODOLOGY AND ASSUMPTIONS FOR EVA®ANALYSIS ... 407
8.0.2USING CAPM... 408
8.0.2.1 Limitations to CAPM ...415
8.1 ABCLIMITED ... 418
8.1.1DOCUMENT ANALYSIS ... 418
8.1.2EVA®ANALYSIS ... 419
8.1.2.1 Making Adjustments for NOPAT ...419
8.1.2.2 Making Adjustments for the Capital Invested ...421
8.1.2.3 Estimating the Cost of Equity (ke) ...422
8.1.2.4 Estimating the Cost of Debt (kd) ...426
8.1.2.5 Estimating WACC and EVA® ...426
8.2 DGELIMITED ... 429
8.2.1DOCUMENT ANALYSIS ... 429
8.2.2EVA®ANALYSIS ... 430
8.2.2.1 Making Adjustments for NOPAT ...430
8.2.2.2 Making Adjustments for the Capital Invested ...431
8.2.2.3 Estimating the Cost of Equity (ke) ...432
8.2.2.4 Estimating the Cost of Debt (kd) ...435
8.2.2.5 Estimating WACC and EVA® ...436
8.3 SPLLIMITED ... 438
8.3.1DOCUMENT ANALYSIS ... 438
8.3.2EVA®ANALYSIS ... 438
8.3.2.1 Making Adjustments for NOPAT ...438
8.3.2.2 Making Adjustments for the Capital Invested ...439
8.3.2.3 Estimating the Cost of Equity (ke) ...440
8.3.2.4 Estimating the Cost of Debt (kd) ...442
8.3.2.5 Estimating WACC and EVA® ...444
8.4 WICLIMITED ... 446
8.4.1DOCUMENT ANALYSIS ... 446
8.4.2EVA®ANALYSIS ... 446
8.4.2.1 Making Adjustments for NOPAT ...446
8.4.2.2 Making Adjustments for the Capital Invested ...448
8.4.2.3 Estimating the Cost of Equity (ke) ...449
8.4.2.4 Estimating the Cost of Debt (kd) ...452
8.4.2.5 Estimating WACC and EVA® ...453
ix
CHAPTER 9: CONCLUSION AND RECOMMENDATIONS ... 457
9.0 INTRODUCTION ... 458
9.1 DISCUSSION ... 459
9.2 RECOMMENDATIONS ... 471
9.3 CONTRIBUTION TO KNOWLEDGE AND PRACTICE ... 473
9.3.1CONTRIBUTION TO SMES ... 474
9.4 GENERALISABILITY AND LIMITATIONS ... 475
9.4.1REFLECTION ON THE PROCESS OF THE RESEARCH ... 476
9.5 CONCLUDING COMMENTS ... 478
APPENDICES ... 479
x
List of Abbreviations
ACCA – Association of Chartered Certified Accountants AIM – Alternative Investment Market
APT - Arbitrage Pricing Theory APT – Arbitrage pricing Theory ARR – Accounting Rate of Return ASB – Accounting Standards Board BBM – BlackBerry Messenger BIS – Business Innovation and Skills CAPM – Capital Asset Pricing Model CFROI – Cash Flow Return on Investment COC – Cost of Capital
CRM – Customer Relationship Management CSR – Corporate Social Responsibility CST – Cost, Schedule and Time DCF – Discounted Cash Flow
DVA – Dividend Valuation Approach EBIT – Earnings before Interest and Taxes EC – European Commission
ECB – European Central Bank ENPV – Expected Net Present Value EPS – Earnings per share
xi
EPS – Earnings per Share EU – European Union
EVA – Economic Value Added
FASB – Financial Accounting Standards Board FIFO – First in First out
FMCG – Fast Moving Consumer Goods FTSE – Financial Times Stock Exchange
GAAP – Generally Accepted Accounting Principles GCPL – Godrej Consumer Products Limited GDP – Gross Domestic Product
GDP – Gross Domestic Product
HEFCE – Higher Education Funding Council for England HEIs – Higher Education Institutions
HMRC – Her Majesty’s Revenue & Customs IASB – International Accounting Standards Board IC – Investment Capital
ICT – Information and Communication Technologies IFRS – International Financial Reporting Standards IPO – Initial Public Offering
IRR – Internal Rate of Return kd – Cost of Debt
xii
KTP – Knowledge Transfer Partnership KTP – Knowledge Transfer Partnership LIFO – Last in First Out
MRP – Manufacturing Resource Planning MVA – Market Value Added
NCV – Net Contribution to Value NOA – Net Operating Assets
NOPAT – Net Operating Profit after Tax NPV – Net Present Value
PBP – Payback Period PE – Price Equity PI – Profitability Index
R&D – Research and Development RI – Residual Income
ROCE – Return on Capital Employed ROE – Return on equity
ROI – Return on Investment RONA – Return on Net Assets RV – Residual Value
SMEs – Small and Medium-Sized Enterprises SVA – Shareholder Value Analysis
xiii
TCS – Tata Consultancy Services UK – United Kingdom
UREC – University Research Ethics Committee USA/US – United States of America
WACC – Weighted Average Cost of Capital WEV – Warranted Equity Value
xiv
List of Tables
Table 2.1: Rappaport SVA Spreadsheet ... 38
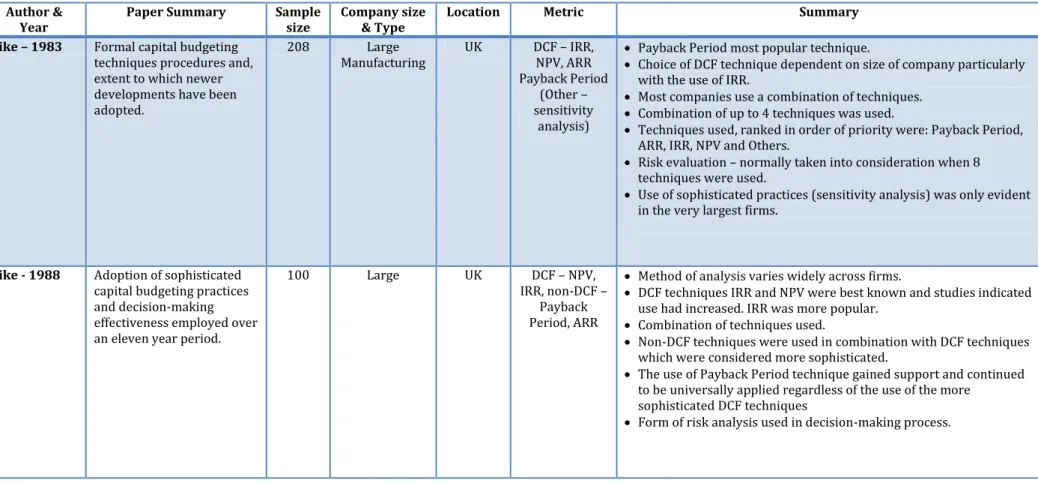
Table 2.2: Synopsis of Performance Measures Practices in Companies between 1993-2011 ... 48
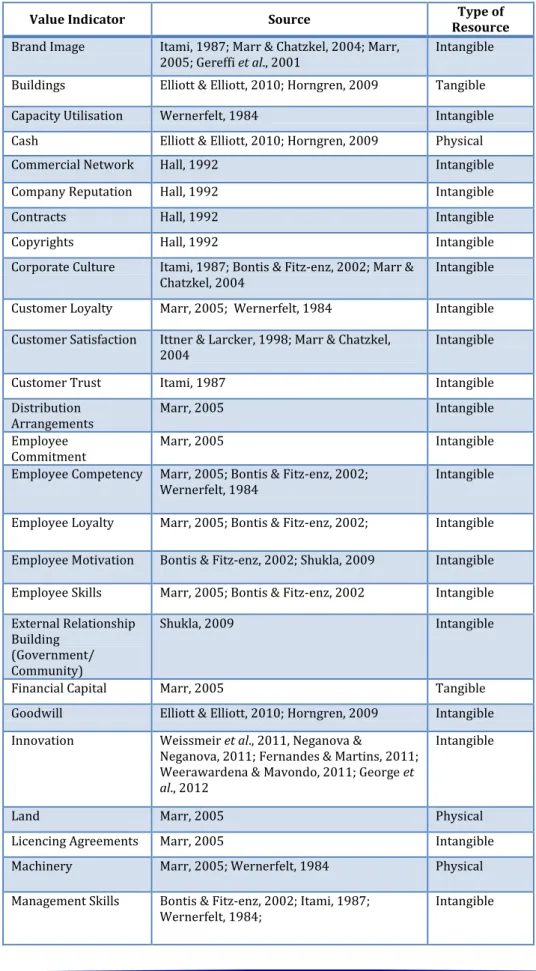
Table 3.1: Value Indicators within Businesses (in alphabetical order)... 62
Table 3.2: Example of Calculating EVA® ... 98
Table 3.3: Empirical Studies on EVA® as reported by Sharma and Kumar (2010) ... 104
Table 3.4: Summary of the Empirical Analysis of Sharma and Kumar (2010) ... 105
Table 3.5: Some Empirical Studies Comparing EVA® with other Performance Measures ... 111
Table 4.1: Listing of Prominent Small Business Journals ... 131
Table 4.2: Bolton Committee (1971) Definitions of a Small Firm ... 134
Table 4.3: EC Definition of SMEs – January 2005 ... 135
Table 4.4: Number of Enterprises, Employment and Turnover by Size of Enterprise, UK Private Sector at the beginning of 2011. ... 138
Table 4.5: Bootstrap Techniques used in Small Businesses ... 147
Table 4.6: Summary - Roztocki and Needy (1998) - EVA® for Small Manufacturing Companies in the USA ... 163
xv
Table 5.2: Company Code and Description ... 194
Table 5.3: Interview Schedule ... 194
Table 5.4: List of Indicators used for the Value Indicator Exercise ... 196
Table 5.5: Practitioners Response Rate ... 203
Table 6.1: Practitioner Views following Iterations 1,2 & 3 ... 221
Table 6.2: Financial Overview of ABC Limited ... 229
Table 6.3: Respondent Code for ABC Limited ... 230
Table 6.4: Financial Overview of DGE Limited ... 262
Table 6.5: Respondent Code for DGE Limited ... 262
Table 6.6: Financial Overview of SPL Limited ... 289
Table 6.7: Respondent Code for SPL Limited ... 289
Table 6.8: Financial Overview of WIC Limited ... 314
Table 6.9: Respondent Code for DGE Limited ... 315
Table 7.1: Companies Gearing Data from Morningstar ... 361
Table 7.2: Value Indicators from the Academic Literature and Value Creation in Alphabetical Order ... 367
Table 7.3: Case Study 1 – ABC Limited Value Indicators ... 375
Table 7.4: Case Study 2 – DGE Limited Value Indicators ... 376
xvi
Table 7.6: Case Study 4 – WIC Limited Value Indicators ... 378
Table 7.7: Overall Value Indicators of Participating Companies... 379
Table 7.8: Indicators of Value Inferred by Participants during Interviews ... 380
Table 7.9: Mapping Value Indicators from Case Studies with that of the Literature ... 381
Table 7.10: Result from the Mapping Value Indicators from Case Studies and the Literature ... 385
Table 7.11: Indicators of Value and how they are or could be included in the accounting figures ... 388
Table 8.1: The Historic Return of the Stock Market ... 409
Table 8.2: The Risk Free Rate of Return... 410
Table 8.3: Annual Interest Rate used by Commercial Banks to SMEs ... 412
Table 8.4: UK Corporation Tax Rate 2007-2011 ... 412
Table 8.5: Summary of Beta Values used in Calculations ... 414
Table 8.6: Calculating NOPAT for ABC Limited ... 420
Table 8.7: Determining the Total Capital Invested by ABC Limited ... 421
Table 8.8: Proxy Betas using FTSE 100 Companies ... 423
Table 8.9: Proxy Betas using FTSE 250 Companies ... 423
xvii
Table 8.11: Proxy Betas using FTSE AIM Companies ... 424
Table 8.12: Determining the cost of equity for ABC Limited ... 425
Table 8.13: The Cost of Debt for ABC Limited ... 426
Table 8.14: Estimating WACC and Calculating EVA® for ABC Limited ... 427
Table 8.15: Calculating NOPAT for DGE Limited ... 430
Table 8.16: Estimating the Capital Invested in DGE Limited ... 431
Table 8.17: Proxy Betas using FTSE 100 Companies ... 433
Table 8.18: Proxy Betas using FTSE 250 Companies ... 433
Table 8.19: Proxy Betas using FTSE All-Share Companies ... 433
Table 8.20: Proxy Betas using FTSE Aim Companies ... 434
Table 8.21: Determining the cost of equity for DGE Limited ... 434
Table 8.22: The Cost of Debt for DGE Limited ... 435
Table 8.23: Estimating WACC and Calculating EVA® for DGE Limited ... 436
Table 8.24: Estimated NOPAT for SPL Limited ... 439
Table 8.25: Estimating the Total Capital Invested by SPL Limited ... 439
Table 8.26: Proxy Betas using FTSE 100 Companies ... 440
Table 8.27: Proxy Betas using FTSE 250 Companies ... 440
Table 8.28: Proxy Betas using FTSE All-Share Companies ... 441
xviii
Table 8.30: Determining the cost of equity for SPL Limited ... 442
Table 8.31: The Cost of Debt for SPL Limited ... 443
Table 8.32: Estimating WACC and Calculating EVA® for SPL Limited ... 444
Table 8.33: Calculating NOPAT for WIC Limited ... 447
Table 8.34: Estimating the Capital Invested in WIC Limited... 449
Table 8.35: Proxy Betas using FTSE 100 Companies for WIC Limited ... 450
Table 8.36: Proxy Betas using FTSE 250 Companies for WIC Limited ... 450
Table 8.37: Proxy Betas using FTSE All-Share Companies for WIC Limited ... 450
Table 8.38: Proxy Betas using FTSE AIM Companies for WIC Limited ... 451
Table 8.39: Determining the cost of equity for WIC Limited ... 452
Table 8.40: The Cost of Debt for WIC Limited ... 452
xix
List of Figures
Figure 2.1: Valuation Techniques ... 19 Figure 2.2: The Relationship Curve – NPV of a conventional project and the discount rate ... 32 Figure 3.1: Components of a Business Model ... 64 Figure 3.2: Modigliani & Miller Effect of Leveraging on the Cost of Capital
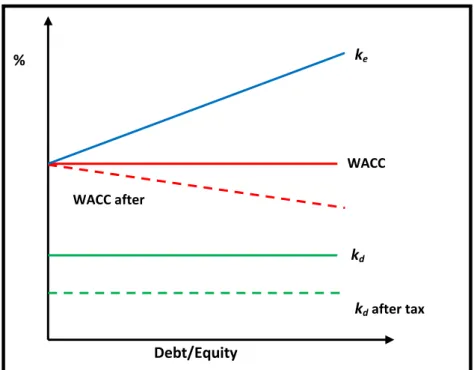
without Tax ... 86 Figure 3.3: The Effect of Taxes on the Cost of Capital ... 87 Figure 3.4: The Effect of Taxes on the Cost of Capital showing point of
Optimal Gearing... 87 Figure 5.1: Elements of the Research Framework ... 185 Figure 5.2: Illustration of the Delphi Technique ... 200 Figure 6.1: ABC Limited Operations Functionality Organisation Chart ... 231 Figure 6.2: ABC Limited Hierarchical Organisation Chart ... 233 Figure 6.3: Value Indicator Exercise – ABC-R1 ... 256 Figure 6.4: DGE Limited Functional Organisation Chart ... 265 Figure 6.5: Outcome of Value Exercise for DGE-R1 ... 277 Figure 6.6: Outcome of Value Exercise for DGE-R2 ... 280 Figure 6.7: Outcome of Value Exercise for DGE-R3 ... 283 Figure 6.8: Outcome of Value Exercise for DGE-R4 ... 285
xx
Figure 6.9: Outcome of Value Exercise for SPL-R1 ... 305 Figure 6.10: Remodelled Outcome of Value Exercise for SPL-R1 ... 307 Figure 6.11: Outcome of Value Exercise for SPL-R2 ... 309 Figure 6.12: Remodelled Outcome of Value Exercise for SPL-R2 ... 310 Figure 6.13: WIC Limited Organisation Chart ... 317 Figure 6.14: Outcome of Value Exercise for WIC–R1 ... 334 Figure 6.15: Outcome of Value Exercise for WIC–R2 ... 335 Figure 6.16: Outcome of Value Exercise for WIC–R3 ... 337 Figure 6.17: Remodelled Outcome of Value Exercise for WIC–R3 ... 338 Figure 7.1: Value Chart – Value Indicators from the Literature ... 370 Figure 7.2: Value Indicator Relationship Diagram ... 387 Figure 7.3: Interaction between Company and its Value Streams ... 399
xxi
List of Appendices
Appendix 1: Research Flyer ... 480 Appendix 2: Participant Information Sheet ... 481 Appendix 3: Sample Letter to Companies ... 484 Appendix 4: Consent Sheet ... 485 Appendix 5: Transcripts from Case Studies ... 486 Appendix 6: Sample Letter to Practitioners ... 683 Appendix 7: Transcripts of Practitioner Interviews ... 684 Appendix 8: Sample Company Reports ... 700 Appendix 9: Sample Bloomberg FTSE Data (Beta) ... 721 Appendix 10: Description of Proxy Companies ... 723
1
Chapter 1:
INTRODUCTION
1.0 Research Area 1.1 Research Rationale
1.2 Interest and Justification for the Research 1.3 Research Problem
2
1.0 Research Area
This research centres on small and medium sized enterprises (SMEs) and their performance for sustained development and future growth. Performance however is being considered within the context of the drivers of value within companies and understanding how that translates into overall performance and subsequently, how that performance can be measured. The study seeks to examine these factors within the context of Economic Value Added (EVA®) theory; the Stern Stewart & Company mechanism which gained prominence in the 1980s.
EVA® is a framework which was developed to effectively measure, manage and monitor periodic performance of a company. It consists of a performance measurement metric and a management and incentive scheme. From its introduction, EVA® has been implemented mainly within large organisations. The theory behind the EVA® framework states that it is best to be applied in divisions or projects within large organisations (Young and O’Byrne, 2001; Stewart III, 1999; Ehrbar, 1998). However, very little was found with respect to the applicability of EVA® to SMEs. Hence, this study investigates the applicability of EVA® in SMEs as an indicator of growth and value creation in order to explore this knowledge gap. In doing so, understanding value is integral to the study: what it means to small businesses and also identifying value indicators and determining how they translate into the value variables for use in the EVA® performance metric.
In summary, the topic of the research is value drivers within SMEs: growth and value creation within the context of the EVA® framework.
3
1.1 Research Rationale
For decades, there has been widespread concern regarding the applicability of traditional measures of performance to measure true performance (ArabSalehi and Mahmoodi, 2012 and 2011). These measures have been long regarded as inadequate as they fail to show the creation or destruction of shareholder value arising from the actions of management. Since its introduction, the EVA® framework has gained popularity all over the world, particularly in the United States, Europe and Asia. The EVA® framework has been used within companies in search of a consistent way of assessing the performance of the organisation in realising its objective of creating value for shareholders.
Academics studying EVA® have proven the theoretical significance of EVA® (Lehn & Makhija, 1996; Uyemura et al., 1996; Feltham et al., 2004; Worthington & Tracey, 2004; Kumar & Pal, 2008;) – although not all studies were supportive of the claim that EVA® was superior to traditional measures of performance (Worthington and West, 2004; Milunovich and Tsuei, 1996; Uyemura et al., 1996). A review of the various papers on EVA® also points to EVA® implementation in many large multi-national companies (Myers, 1996) or large companies across various industries including the banking sector (Costa, 2012; Uyemura et al., 1996), service sectors (Spinner, 1995; Tully, 1995; Cleverley, 1993) and not-for-profit organisations (Gapenski, 1996). In identifying gaps in the existing literature it was found that very few researchers had looked at the practicality of implementation of EVA® in SMEs. Instead the studies such as Roztocki and Needy (1999) investigated the linear implementation on EVA® within SMEs without investigating the adaptability or suitability of the model for SMEs. This study aims to address this gap: to look at the suitability for adapting EVA® to SMEs in measuring the performance of the company in light of investment decisions, growth potential and general company performance.
4
1.2 Interest and Justification for the Research
SMEs account for the majority of companies in the UK and are significant contributors in terms of employment, tax and Gross Domestic Product (GDP). Unlike their larger counterparts, SMEs usually operate under strict conditions of capital rationing (restricted funds), and so it is paramount that they are able to make informed investment decisions to maximise the use of funds. However, investment decision-making in SMEs is highly informal (Mäkeläinen and Roztocki, 1998), with a lack of evaluation techniques actively used. This project aims to fill this gap, at least in part, by identifying what constitutes value within SMEs and by examining how; if possible, the growth and value creation can be enhanced within SMEs.
1.3 Research Problem
The purpose of this study is to examine the applicability of EVA® as a performance measure to evaluate the growth potential and measure the performance of SMEs. The overarching aim of this research is to identify the value drivers within SMEs, and to determine the applicability of the EVA® framework for growth and the creation of value within SMEs. This was achieved by investigation with the context of the EVA® framework by taking into consideration:
A. What are the indicators and drivers of value with SMEs?
B. In applying the EVA® framework to SMEs what can be deduced?
A number of key research questions have been developed. These are: 1. How do managers determine the value drivers within a SME?
a. To what extent are value drivers considered when management within SMEs make investment decisions?
5 2. If value drivers are determined, how are these value drivers used?
a. How is value measured within the organisation?
b. Does this inform the strategic planning process within the business?
3. Can EVA® be used or adapted within SMEs?
a. What would be the variables and the value drivers in the EVA® model?
b. How are these variables and value drivers determined?
c. What other factors needs to be considered in modelling EVA® for SMEs?
4. How useful is the EVA® framework for SMEs?
1.4 Overview of the Thesis
The traditional methods of measuring performance (appraisal techniques) have been open to much scrutiny by modern financial theorists. The explanation is that there is a need to find a way of measuring the performance of companies which are now competing within a much more complex global environment. With this growing need, there has been a rise in the number of consultancy firms developing and marketing their own performance metrics. The reception to these metrics has been varied, but there have been such fierce competition that articles have been written making reference to the “Metric Wars” (Biddle et al., 1999; Myers, 1996).
One of the most popular metrics is the Stern Stewart’s Economic Value Added. Its popularity was mainly because of the marketing strategy employed by Stern Stewart & Co. Their strategy was to work with academics and their students and by contributing to the publication of texts which claimed to pull together ‘modern day thinking’ in corporate finance. Most importantly, their marketing
6
ploy was consolidated with the publication of their work in the Journal of Applied Corporate Finance1 which was founded by the company and later acquired by Morgan Stanley. Nonetheless, there has also been harsh critique of EVA®, not so much on its foundation in economic profit but more so on the proclamation of what the metric can do and the evidence of its performance (Chen and Dodd, 2001; Paulo, 2002).
To put the key research questions into context, the traditional methods of performance appraisal techniques and their application within companies is examined. A brief examination of the more popular modern methods of performance evaluation is also presented. This was followed up with a closer look at value, and accounting for value, within the EVA® framework for its application within SMEs.
By using a mixed research methodology, case studies were conducted with four SMEs. Information was also solicited from EVA® practitioners to establish expert opinion. Companies and practitioners were selected using critical case sampling which is a type of purposive sampling. Companies were identified and screened from various information sources such as Business Park Listings and online data sources for SMEs. By definition, each had to meet the size requirement of an SME. Other criteria used for selecting companies included their level of maturity/history of establishment to ensure sufficient historical data was available and that they must have filed annual reports on an annual basis. As SMEs are known to be less organised/structured than larger companies, the selection criteria was implemented to ensure that the necessary data required was produced by the company. In each case, members from the management team were interviewed, and the financial reports over the last five years were collected. The decision was made to interview only the management team because they are likely to be the key decision makers within the organisation. In soliciting expert opinion, practitioners from academia were
7 selected mainly on the basis of their published work on EVA® and value creation.
Data was collected using structured interviews for all participants. A modified Delphi technique was adapted to refine the interview questions from previous interviews for both the companies and the practitioners. An interpretative approach using thematic analysis was used. This was then integrated into performing the quantitative analysis of the data required in examining the value and value drivers in proposing a way forward for EVA® for SMEs.
Chapters 2, 3 and 4 cover the extensive review of the literature as follows:
Chapter 2, Performance Appraisal and Valuation Techniques, starts out with a general overview of the development of accounting standards, issues and the way forward. This is then followed by a critical review of the more commonly used performance and valuation techniques in practice.
Chapter 3, Value, Value Drivers and Evaluation, introduces the concept of value creation and its importance in the development of business strategy. The chapter covers the evaluation of value and the move from traditional accounting measures to the inclusion of value based measures as in line with the development of finance and economic theory. As the value based metric EVA® is a main feature of this study it is covered in detail within this chapter. This includes a presentation of the theory, dissection of the metric, an illustration of EVA® calculation, its application and an empirical review including a critique of the EVA® framework.
Chapter 4, Small Business Enterprise Development, covers the development of SME. SMEs are major economic contributors in any economy. The development in thought regarding the definition of an SME was covered starting with the Bolton’s (1971) definition to the one currently in use which was put forward by the European Commission (EC Report, 2006). This follows a closer examination of the characteristics of SMEs, their financing and a brief look at the use of
8
financial information in decision making. As they are recognised as contributors to economic development, influences for growth and barriers to their development are also covered. In line with the objectives of this study, value and performance management within SMEs is explored. The chapter concludes with a summary of the literature on the application of the value based metric EVA® in SMEs practice.
The Research Methodology is covered in Chapter 5. The chapter begins with an overview of research methods before presenting the stance of the researcher in undertaking this study. The research framework is presented followed by details on the implementation of the research. The implementation of the research includes using critical case sampling for all participants, the application of a modified Delphi Technique to refine all the interview questions and use of a cognitive exercise using flash cards during the interviews with companies to extract additional data. All issues faced during implementation are covered including changes made during the course of the research and the reasons for the changes. Thematic Analysis was used for analysis of the data and theory, and a reason behind this approach is also presented.
In undertaking this research, approval was granted by the University Research Ethics Committee and the process of obtaining this approval is also documented (See also Appendix 2 & 4). The chapter conclude with a brief summary of the limitations of the research.
Chapter 6, Presentation of Practitioner’s Views and Case Studies, pulls from the transcripts the highlights from interview participants in relation to the key research questions. Interviews were structured using open ended questions giving participants the opportunity to express their thoughts and experience on each question in their own words. Hence the statements made in response to the questions were extracted from the transcripts and presented in this chapter. For ease of presentation and to facilitate the pending analysis, the extracts are presented under the themes arising from both the interviews and the literature.
9
Chapter 7, Analysis & Interpretation of Findings, focuses on the primary research finding related to the key research questions. The analysis began with an examination of Practitioners views and Respondents from the participating companies. This was done under themes arising from the interviews and the literature. This analysis enabled triangulation of the study findings in relation to the applicability of EVA® within SMEs as it relates to two key features of EVA®:
i. A management system to guide managers to function effectively; and
ii. A system to support reward incentives for staff at all levels.
An analysis of value and value indicators ensued for each company and this was triangulated against the findings from the literature. The chapter concludes with a discussion of the interpretation of the value indicators identified from the studies and how it could then be integrated into the EVA® performance metric within SMEs.
Chapter 8, Findings from the Financial Analysis, commences with a detailed synopsis of methodology and assumptions made in conducting the analysis of the financial reports from the companies. A brief discussion of the limitations in the financial model for calculating EVA® is also covered. The EVA® analysis of each of the participating companies followed, beginning with an overview of the financial data collected from each company.
And finally, Chapter 9, Conclusion & Recommendation. The chapter provides conclusions on the in-depth discussion of the Case Studies in relation to the findings of the study. Through this discussion, the arguments for the reliability, validity and generalisation of the study are also summarised. This is followed by discussion on how the findings from the study can be practically transferred within SMEs. It also provides the restatement of the contribution to knowledge and practice. Recommendations are also made for future studies.
10
Chapter 2:
PERFORMANCE APPRAISAL and VALUATION
TECHNIQUES
2.0 Introduction2.1 Accounting Practices, Profit Measurement and Investment Decisions 2.2 Performance and Valuation Techniques
2.3 Single Period Methods
2.3.1 Profit Based Methods 2.4 Multi-period Methods
2.4.1 Profit Based Methods 2.4.2 Cash Based Methods
2.4.3 Discounted Cash Based Methods
2.5 The Drive for Performance Measurement in Companies 2.6 Application of Performance Measurements
11
2.0 Introduction
In this chapter, the application of the most popular appraisal and performance measurement techniques employed by managers to guide investment decisions and to evaluate company performance has been examined. This spans the use of the traditional measures of performance to modern measures based on economic theory which includes elements of a value variable.
2.1 Accounting Practices, Profit Measurement and Investment
Decisions
Since its inception, the Financial Accounting Standards Board (FASB) in the USA have issued more that 100 new rules aimed to make income statements and statements of financial position more accurately reflect the performance and financial conditions of corporations (Ehrbar, 1998). A similar, although less prolific story relates to the Accounting Standards Board (ASB) in the UK and the International Accounting Standards Board (IASB) which governs the accounting practices of listed companies internationally. However, Ehrbar (1998) states these attempts created more distortions and have resulted in Generally Accepted Accounting Principles (GAAP) moving further away from, rather than reflecting, economic reality. This view was also expressed by Lev (1998) in “that the association between accounting data and market values was not only weak but it also appears that the usefulness of financial reports were rather limited” (cited in Ehrbar, 1998: pp. 161). The resulting gap from this distortion; that is between GAAP and reality, increased over time because of the extreme conservative bias in the accounting profession, and the political nature of accounting standard setting, as how one accounts for items has real economic consequences. Invariably, when faced with the several ways of treating an item, political lobbying dictates that the option which would have the least impact on the income statement or statement of financial position was likely to be the
12
option of choice (Ehrbar 1998). The conservative nature of the Anglo-American accounting systems was clearly different from that in Continental Europe in which accounting professionals prepare statements primarily for lenders whose interest would be different from the shareholders of the company. However the IASB/FASB has since undertaken the joint conceptual framework convergence project which recognised these issues. The convergence project moved away from the traditional objective of financial reporting, stewardship, to economic decision-making:
‘The objective of general purpose external financial reporting is to provide information that is useful to present and potential investors and creditors and others in making investment, credit, and similar resource allocation decisions.’ (IASB/FASB, 2006: paragraph OB2); and
‘to help achieve its objective, financial reporting should provide information to help present and potential investors and creditors and others to assess the amounts, timing, and uncertainty of the entity’s future cash inflows and outflows (the entity’s future cash flows). That information is essential in assessing an entity’s ability to generate net cash inflows and thus to provide returns to investors and creditors.’ (IASB/FASB, 2006: paragraph OB3)
Consequently there is recognition that financial reporting needs to be more decision-useful and this marks the first moves to try to address this evaluative gap. One would therefore expect future accounting standards to be drawn up on this basis. However, there is still conflict, as for example, fair value accounting is highly relevant for economic decision making, but suffers from a lack of reliability and can lead to excessive distributions of unrealised profit in boom times (Whittington, 2008). The debate is still on-going.
Today, accounting information is used widely in a number of market transactions irrespective of any geographic boundary. With this comes the
13 challenge once more of providing data which, not only translates across boundaries, but also provides the basis on which singular analysis can be undertaken. Nonetheless significant advances have been made in harmonising accounting practices of listed companies, non-listed companies and private companies following national regulations. Accounting practices between the Anglo-American group and Continental Europe are significantly different. Whereas advances were made with the advent of modern communication, accounting systems remained an integral part of the markets and politics of each country and presents the need for a unified approach (Diaconu and Coman, 2006; Ball, 1995). Accountants are working to provide intelligent data which can be translated across national boundaries. For listed companies in most of the world’s stock markets it is now compulsory to adopt international financial reporting standards (IFRS) (Diaconu and Coman, 2006). Whilst these are more closely aligned to provide information for economic decision-making compared to the Continental European/Japanese model, they still have some way to go before they measure value created.
Investment decisions are financially driven and inadequate corporate performance will mean shareholder expectations will not be realized. This results in increased pressure on management to identify alternative projects which are more profitable. One problem related to the application by accountants of the prudence concept is that along with appearing on the statement of financial position as a fixed asset, ‘investments’ may also appear on the income statement as expenses in terms of public relations, staff training or research and development. The IASB conceptual framework definition of assets is “a resource controlled by the enterprise as a result of a past event and from which future economic benefits are expected to flow to the enterprise” (IASB, 2005). The cost of the investment is only recognised as an asset if, and only if, it is probable that future economic benefits associated with the item will flow to the entity; and the cost of the item can be reliably measured. Consequently, investments may be recognised in different ways because the associated
14
expenditure cannot be separately identifiable, or that the expected future benefits are too uncertain to meet this strict definition for an asset. In some instances the amount of money gained as a result of making an investment is relatively easy to measure such as tangible cost savings or capacity increases.In other instances they may be difficult to measure in terms of improved company image or increased staff education. Amounts to be spent may be relatively easily forecasted, for example the cost of computerisation of a process to reduce the production of non-quality products. However, in many instances, such as internally generated goodwill, the costs can be uncertain or intangible, and very difficult to measure, leading to a write-off of the cost as an expense to the income statement because of the prudence concept.
With the decision to make investments comes the expectation of some tangible or intangible outcome for the business. For non-commercial entities the primary goal may not be for profit maximization from the investment but rather for providing some satisfaction of fulfilling a socially desirable need. Whereas for commercial entities, the general expectations are that from investments, profit would be increased thereby maximizing shareholders’ wealth. A profitable investment may be defined as one in which the gains outweigh the costs incurred. The notion of profit was developed by accountants to assist in the process of auditing and reporting. This is achieved by taking a business’ continuous process and subdividing it into periods of 6 months or a year (Arnold, 2007). As with other researchers, Arnold described such action as artificial and fraught with problems and concludes that accounting profit may not be a good proxy for shareholder wealth. He further highlights the following reasons to support his conclusion (Arnold, 2007).
1. Prospects: The stock market will give a higher share value to the company that shows greater future potential, regardless of reported profit. For example, a lower value would be assigned to firms where managers chose a short term approach to raise profit by sacrificing long
15 term prospects. This is on the assumption that the stock market is efficient.
2. Risks: Risks are evaluated on historical performance and future projections over time. The volatility of the company is correlated to price as shareholders will place higher value on a more stable company.
3. Accounting problems: Accounting has scope for judgement, guess work and even cynical manipulation.
4. Communication: Investors are likely to avoid purchasing shares in companies which fail to report on the origins of profits. Hence senior executives of large companies spend much time communicating their strategies, sources of income and future investment plans to shareholders for them to be aware of the firm and its prospects.
5. Additional Capital: A simple way of increasing profit is by making use of more shareholders’ money. However, unless the rate of return on shareholders’ money is maintained (risk adjusted) continued use of this strategy over time destroys shareholder wealth (Groth and Anderson, 1997).
Due to the accruals principle, profit is not reflective of the actual cash flow of a company and is of little use in decision-making as it only shows relationships between accounting data, which is historic and subject to accounting allocations and distortions (Arnold, 2007; Chen and Shimerda, 1981). Nevertheless, profit is the main language of business and managers need to know the impact of the investments they make, not only on value creation, but on profit, as they are judged on both accounts. This chapter now explores the extant tools and techniques that are available to managers to help in investment decision-making.
16
2.2 Performance and Valuation Techniques
While it is good practice to keep a watchful eye on things like market measures and financial measures, these are by no means sufficient measures to understand why a business performs the way it does. Prone to manipulation and most appropriate for evaluation within the short-term, financial measures can be especially misleading (Copeland et al., 2000). The major concern for business managers should be how to achieve desired financial results and whether functional targets are met. A manager who understands the concept of, and can identify value drivers, has the foundation on which the performance of the business can be measured. Having the knowledge of what the value drivers are will assist in understanding the reasons behind how the performance of the business can be achieved and can give an insight into how performance is likely to progress in the future. Most significantly, value drivers can serve as leading indicators of performance.
In order to maximize shareholder wealth, a company must invest in wealth creating activities in order to renew, extend or replenish the means by which it carries out operations on a daily basis. Generally speaking, in making investment decisions, a company will always seek to invest in projects which it sees as profitable and would result in maximizing the return to the shareholders, and try to refrain from making poor investment decisions which would impact negatively on the wealth generation capability of the company (Watson and Head, 2007).
The decision to invest is driven by how much the future cash flow from the investment is worth today. The value of any investment decision becomes reliant on three main factors:
i. The size of the gain: If considered and all the conditions (such as risk) are equal, the greater the expected cash flow the more attractive the investment.
17 ii. The timing: Embedded with cash is an element of time. Knowing just the size of the expected cash flow provides very little information if the time for the maturity of the investment is not considered. The value of the cash decreases over time; hence the cash flow received today is worth more than the same amount of cash received in the future. This is due to a combination of the inflationary erosion of the purchasing power of the money and the lost opportunity cost of foregoing alternative investments, and the uncertainty or risk involved in the collection of the cash flow.
iii. Degree of uncertainty: This depicts the element of risk associated with investment decisions. When a decision is made to invest, there is no guarantee that the size of the expected cash flow will actually materialise, as estimates are frequently inaccurate and incomplete. The need to understand the process of value creation and to link them with the company strategy and value creation to facilitate both decision-making and performance measurement is apparent to management (Chari, 2009). The traditional accounting measures of value such as earnings per share and profit margins have been deemed to be no longer relevant as performance measures within the dynamics of a global economy, as they fail to take into account the factors that drive shareholder value (Chari, 2009). Therefore in making investment decisions management need to have at their disposal tools with which to correctly evaluate the financial performance of the firm and its wealth creation capability (Artikis, 2008). Thus, practitioners in the field over the years have proposed other techniques as doubt continues to rise over the traditional accounting measures for performance evaluation. These proposed approaches use economic profit over the traditional measures thereby avoiding the dysfunctional consequences of these measures (Burkšaitienė and Juozapavičienė, 2008).
18
From the perspective of a modern day investor, a company that reports accounting profit may not be maximizing the value of shareholders (Artikis, 2008; Drucker, 1998). The foundation work on the theory of shareholder value can be traced back to the 1950s and 1960s by various economists, for which some have been honoured with the Nobel Prize for Economics (Jan Tinbergen, and Ragnar Frisch, 1969; William F. Sharpe, Henry M. Markowitz and Merton H. Miller, 1990). The Capital Asset Pricing Model (CAPM) is based on the reasoning that the received and expected returns of investors are affiliated to the risk incurred by owning specific financial assets. Shareholder Value Added, an alternative metric in the late 1980s rose to prominence with the publication of “Creating Shareholder Value” in 1986 by Alfred Rappaport (Petravičius and Tamošiūnienė, 2008).
With these concerns there is also the likelihood that a company may not have at its disposal, or wish to raise the finance required, to exploit all opportunities which could realise a positive return to shareholders. Hence management resort to formal ways of rationalising their actions. Depending on the life of the project, either single period or multi-period methods of capital expenditure appraisal are available.
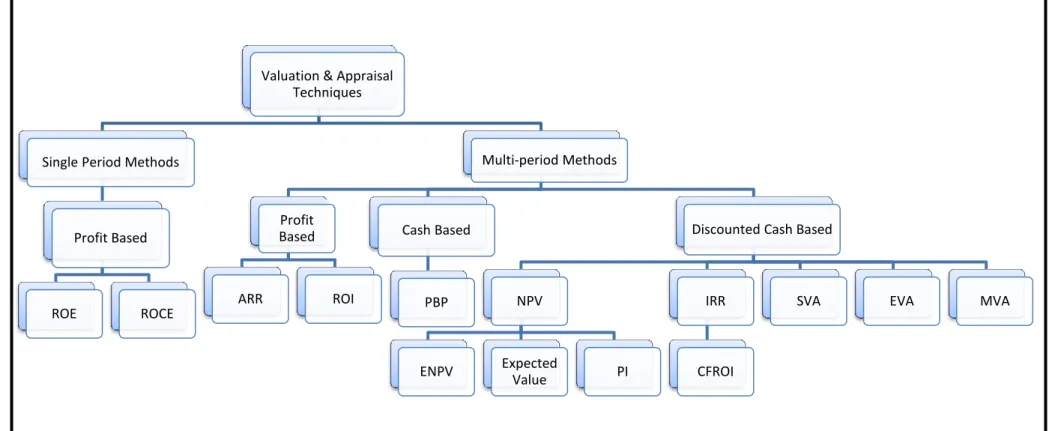
Figure 2.1 below is a representation of the performance appraisal and valuation techniques identified from the literature. As shown, these techniques focus on the main concerns of the business manager; cash and profit. The type of technique used is dependent on the task under examination.
19
Figure 2.1: Valuation Techniques
Valuation & Appraisal Techniques
Single Period Methods
Profit Based ROE ROCE Multi-period Methods Profit Based ARR ROI Cash Based PBP
Discounted Cash Based
NPV
ENPV Expected Value PI
IRR
CFROI
SVA EVA MVA
20
2.3 Single Period Methods
2.3.1 Profit Based MethodReturn on Equity (ROE)
This is a popular measure of the profitability rate; that is how much is earned per £1 of the common shareholders’ investment in the company (Horngren et al., 2009). It is therefore a representation of the return on common shareholder’s equity and is an indication of the relationship between net income and common shareholder’ average equity and is expressed as:
A company with return on assets which is higher than the ROE is indicative that interest expenses are greater than the ROE; which would be unattractive for potential investors. A major disadvantage of ROE is because it uses financial statement data, it is sensitive to the choice of accounting methods used. Hence it would not present a level playing field for comparison amongst other companies without performing some adjustment (Peterson and Peterson, 1996).
Return on Capital Employed (ROCE)
This is a simplistic return on investment which relates accounting profit to a measure of the capital employed (Watson and Head, 2007). Return on capital employed (ROCE) is a measure of profitability against the volume of resources invested. These resources usually include shareholders’ funds, net debt and other provisions.
21 It is generally expressed as:
This method is used internally when selecting projects and as a measure of performance for projects and subsidiaries within organisations. As it uses publicly available information it is also used to benchmark performance with competitors.
Although ROCE has little theoretical credibility as a method of making decisions, it has great popularity within companies. Along with its simplicity, its popularity is attributed to the fact that it gives a value in percentage terms to a project which can be compared with the existing ROCE for the company, or division (Watson and Head, 2007) or to mutually exclusive projects. It can also be compared to the company’s cost of capital, which must be exceeded to create value. A drawback of using accounting profit is that it is open to manipulation (Peterson and Peterson, 1996). It is also not linked to the fundamental objective of maximizing shareholder wealth (Watson and Head, 2007) as it tends to favour higher risk decisions, it favours leasing and low capital intensive investments. ROCE makes no adjustments for the greater risk for longer term forecasts (Watts, 2006) as it is only concerned with current period returns.
2.4 Multi-period Methods
McLaney (2011) noted the use of multi-period methods of valuation have increased over time; however companies may use more than one valuation technique in practice.
22
2.4.1 Profit Based Methods
The Average Rate of Return (ARR)
This is another simple method of analysing capital investment which focuses on the operating income an asset generates, compared to the average amount invested. It is expressed as:
According to Fritsche and Dugan (2009), although easy to calculate, ARR has been shown to be sensitive to accounting valuation bases and allocation methods, inflation, cash flow patterns, growth rate and the length of an asset’s life in some models. It is not always consistent with value maximization but is popular due to similarities with ROCE.
Return on Investment (ROI)
This is one of the most commonly used performance valuation tool used by companies (Horngren et al., 2009). ROI is a measure of the amount of income employed relative to the company assets and is expressed as:
Although ROI use has been widespread, it has also gained much criticism. The main concern was that it is viewed as a poor indicator of the economic rate of return (Jacobson, 1987). This was because of varying views on the information contained within ROI. However investigation by Jacobson (1987) found that ROI
23 contains some information about economic rate of return, albeit small. He also found that it correlates significantly with stock return.
2.4.2 Cash Based Methods
The Payback Period (PBP)
This method of performance measure is the most popular (Watson and Head, 2007; Lefley, 1996; Pike 1983) and gives an estimate of how long it would take before the initial cost of an investment is made. It is expressed as:
Simply, it is the time period an investment would take to generate the initial outlay (Dyson, 2004; Watson and Head, 2007; Lefley, 1996). That is, it is a reflection of the number of years it would take to recover the original investment from the net cash flow from a capital investment project. The shorter the payback period, the more attractive the investment (Horngren et al., 2009).
Along with being simple and easy to understand, the payback period is also quite easy to apply. Determination of the payback period is dependent on whether the expected net cash flow would be equal or would be different for each year. Given the net cash flow varies, the payback time could then become the number of years (n) over which the accumulated net cash flow nears the initial outlay plus the time (n + 1) needed to reach the initial outlay (Horngren
et al., 2009: p. 1073). The equation then becomes:
24
Its main advantage is that it is not open to manipulation by managerial preferences for particular accounting practices as it is calculated using cash flows and not accounting profit. Under the payback method of analysis, a shorter payback period is less uncertain than a longer one. With a shorter payback period, it is less likely for external factors like market conditions and interest rate to drastically cause significant change (Watson and Head, 2007). However, one of the main drawbacks with PBP is the determination of the hurdle rate for project acceptance. Unlike IRR and NPV, there is little evidence to show how the hurdle rate for PBP is determined. Lefley, (1996) stated that the hurdle rate for PBP calculations appears to be a subjective judgement which is based on past experience and the perceived level of risk. From reviewing the literature Lefley (1996), found that a period of 1 – 5 years; and on average 2.9 years, is normally used as the expected time to recover the initial cost of most projects. As a result, the PBP method is said to be bias against accepting long term project which may offer greater benefits. Another serious disadvantage of the payback method is that it ignores cash flows outside of the payback period. Also, it gives no indication of total profitability as it only focuses on how quickly the initial investment can be recovered (Lefley, 1996). For that very reason the payback period should not be used as the only evaluation technique when considering an investment decision. By modifying the payback method, the time value of money can be taken into account by discounting the expected cash flows from the investment, which are detailed in the next section.
2.4.3 Discounted Cash Based Methods
Performance valuation methods for investment decision-making have been advanced in relation to the theory and concept of discounted cash flow (DCF). Described as a truly rigorous technique, its origins can be traced back to the Old Babylonian period of 1800 – 1600BC (Shrieves and Wachowicz, 2001) and has
25 widespread application in modern day finance in capital budgeting, security valuation and performance management.
With DCF, expected cash flows are ‘discounted’ at the rate of interest or discount rate which reflects the time value of money and the risks investors take of not having the cash today. For an investment of P made today, the future value (F) at a rate of interest of i for n years is:
Therefore the present value of a future cash flow can be stated as:
Hence for a company with a cost of capital of 8%, £1m received in 5 years’ time would only be worth £680,583 in today’s terms. The greater the discount factor, the smaller the present value of future cash flows, for example, at 20% £1m received in 5 years would only be equivalent to £401,877.
Net Present Value (NPV)
NPV is the financial gain from an investment over a period taking into consideration the opportunity cost of choosing that investment (Arnold, 2007: p. 40). This process uses the difference between present value (PV) of the future cash flows and the amount of the investment (Watt, 2006). The weighted average cost of capital, should be used to discount all cash flows. If the net present value is positive, it gives an indication that the return expected from project would be in excess of the weighted average cost of capital which would lead to an increase in shareholders’ wealth. NPV is represented as:
26
where: I0 represents the initial investment
C1, C2 ,..., Cn are the net cash flow in the project for years 1, 2,..., n, and;
r represents the cost of capital or the required rate of return (Watson and Head, 2007)
Cash flows are assumed to occur at the end of a period to avoid the mathematics of continuously discounting with the initial investment occurring at the beginning of the first time period, although advancement in computerised spreadsheets would make this feasible.
It uses cash flows rather than accounting profit, takes account of both the amount and timing of cash flows along with the relevant cash flows over the life of the investment (Watson and Head, 2007). The more positive the NPV, the better the return; a zero NPV indicates the project repays the initial investment whereas a negative NPV indicates shareholder wealth has diminished (Watts, 2006).
While a decision made on NPV offers sound advice, the uncertainties in using this technique lies with the difficulties in estimating the values of the cash inflows and outflows over the life of the project (Watson and Head, 2007). Calculation of the NPV is based on the assumption that the cost of capital is known and remains constant over the life of the project (Watson and Head 2007), although it is possible to model variables in a spreadsheet.
However studies have shown that even within an apparent range or distribution of possible outcomes, the errors within NPV remains even when risks are recognised (Brookfield, 1995). NPV is based on the assumption that investment capital is unrestrictive. Such assumption gives the illusion that the
27 company may invest in all positive NPV projects (Lefley and Morgan, 1999). Normally the cost of capital is likely to change over the life of the project as a result of influences within the dynamic economic environment (Lefley and Morgan, 1999; Booth 1999, Brookfield, 1995). NPV pinpoints an investment decision at a particular moment in time, on the information that is available and is applied over the life of the project. On that basis, NPV fails because it doesn’t take into account the true amount of the capital expenditure to realise that additional value. Should there be a shortage of capital, it fails to identify the combination of projects which would offer greater benefits (Lefley and Morgan, 1999). However, it can be modified to a probability index to rank projects (see page