DETECTION OF GREENBUG INFESTATION ON WHEAT USING GROUND-BASED RADIOMETRY
By ZHIMING YANG Bachelor of Science Jilin University Changchun, P.R.China 1986 Master of Science Ohio State University
Columbus, OH 2000
Submitted to the Faculty of the Graduate College of the Oklahoma State University in partial fulfillment of
the requirements for the Degree of DOCTOR OF PHILOSOPHY
DETECTION OF GREENBUG INFESTATION ON WHEAT USING GROUND-BASED RADIOMETRY
Thesis Approved: Dr. Mahesh Rao Thesis Advisor Dr. Dale Lightfoot Dr. Norman Elliott Dr. Dean Kindler Dr. Kristopher Giles Dr. A.Gordon Emsile
ACKNOWLEDGMENTS
I am greatly indebted to numerous individuals without whom this work would not be accomplished. I want to express my deep gratitude to my thesis advisor Dr. Mahesh Rao, for his invaluable guidance, support, patience, and constructive criticism. I would like to extend my special thanks to my graduate committee members: Dr. Dale Lightfoot, Dr. Normal C. Elliott, Dr. Dean Kindler and Dr. Kristopher L. Giles for their contributions and encouragements. I am deeply grateful to Tim D. Johnson and Keith A. Mirkes from the Wheat, Peanut and Other Field Crops Research Unit, ARS (Agricultural Research Service), USDA (U.S. Department of Agriculture) for their great help and advice. I truly appreciate the statistical guidance and support of Thomas W. Popham, Biometrics (Statistician) from SPA (Southern Plains Area Statistical Support), ARS, USDA, I owe my family for their support and encouragement lifelong. Appreciation and much love go to my parents. Great thanks go to my beloved wife Bingxue Yang. Lastly, my thanks extend to every individual who helped me in successfully completing this work.
Table of Contents
CHAPTER 1 Introduction... 1
1.1 Greenbug infestation and its problems... 1
1.2 Current research on detecting greenbug infestation... 4
1.3 Challenges for studies on detecting greenbug infestation... 6
1.4 Significance of this research... 8
1.5 Research goal and objectives... 10
1.5.1 Identifying wavelengths most sensitive to greenbug infestation ... 10
1.5.2 Identifying vegetation indices most sensitive to greenbug infestation ... 10
1.5.3 Differentiating greenbug infestation from water stress ... 11
1.5.4 Examming the impact of growth stage on the detection of greenbug infestation 11 1.5.5 Distinguishing greenbug infestation and infestation by Russian wheat aphid .... 11
CHAPTER 2 Literature Review ... 12
2.1 Introduction... 12
2.1.1 Leaf responses to plant stress... 12
2.1.2 Principles of crop stress detection... 14
2.1.3 Status of current research on crop stress detection by remote sensing ... 16
2.2 Crop stress detection using ground-based radiometry... 17
2.2.1 Ground-based radiometry ... 17 2.2.2 Nitrogen deficiency... 17 2.2.3 Water stress... 19 2.2.4 Plant diseases ... 22 2.2.5 Ozone injury... 23 2.2.6 Heat stress ... 25 2.2.7 Salinity stress ... 25 2.2.8 Pest infestation... 26 2.3 Vegetation indices... 28
2.4 Factors influencing reflectance measurements... 32
2.4.1 Viewing angle ... 32 2.4.2 Solar angle ... 32 2.4.3 Soil background ... 33 2.4.4 Atmosphere ... 33 2.4.5 Wind... 34 2.5 Conclusions... 35
CHAPTER 3 Materials and Methods ... 37
3.1 Experiment facilities and materials... 37
3.2 Experiment methods... 40
3.2.2 Sensitivity experiments... 41
3.2.3 Differentiating experiments ... 42
3.2.4 Growth stage experiment ... 43
3.2.5 Comparing experiment... 44
3.3 Data processing and analysis... 45
3.3.1 Selection of SAS programs... 45
3.3.2 Threshold Day and Maximum Day... 46
3.3.3 Correlation analysis ... 47
3.3.4 Relative Sensitivity analysis ... 48
3.3.5 Testing impact of growth stages and differentiating various stresses... 49
CHAPTER 4 Results and Discussions... 51
4.1 Bands and vegetation indices sensitive to greenbug infestation... 51
4.1.1 Impact of pesticides on reflectance of wheat plants ... 51
4.1.2 Temporal changes in greenbug density... 52
4.1.3 Band sensitivity to greenbug infestation... 55
4.1.4 Vegetation indices sensitive to greenbug infestation... 59
4.1.5 Temporal changes in sensitive bands and vegetation indices... 66
4.1.6 Discussion and Conclusions ... 66
4.2 Differentiating water stress and greenbug infestation on wheat... 79
4.2.1 Sensitive bands... 79
4.2.2 Sensitive vegetation indices... 83
4.3 Impact of plant growth stage on detection of greenbug infestation... 87
4.3.1 Temporal changes in densities of greenbugs ... 87
4.3.2 Sensitive bands... 88
4.4. Distinguishing greenbug infestation and infestation by RWA... 94
4.4.1 Sensitive bands... 94
4.4.2 Sensitive vegetation indices... 96
4.5 Limitations... 102
4.6 Conclusions... 103
CHAPTER 5 Summary and Recommendations ... 104
5.1 Summary... 104 5.2 Recommendations... 107 References... 109 Appendix... 122 A. Excel VB scripts... 122 B. SAS programs ... 127
C. SAS PROC MIXED outputs ... 130
List of Tables
Table 2-1 Sensitive bands to various stresses ... 28
Table 2-2. Various vegetation indices compiled from literature. ... 31
Table 3-1. Band distribution of a Cropscan radiometer... 39
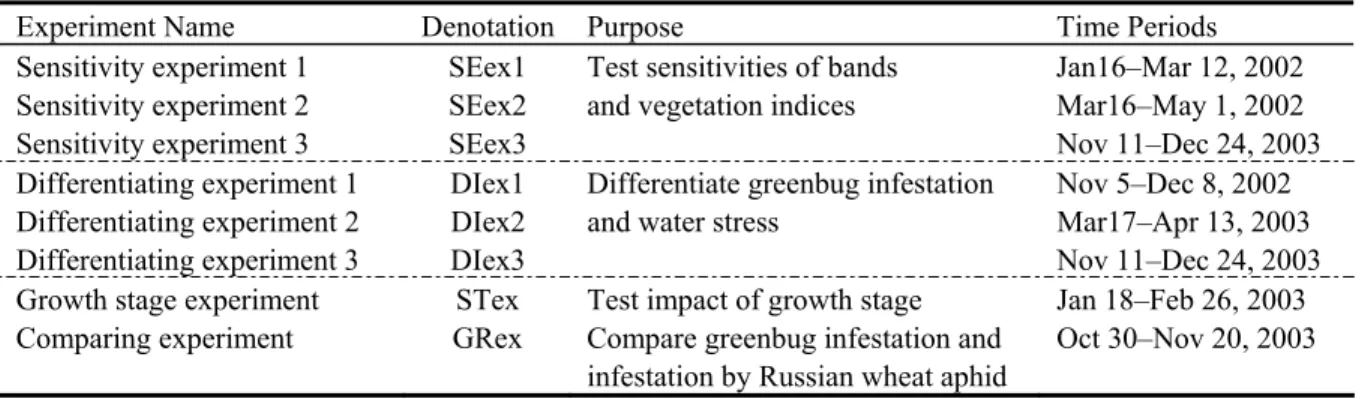
Table 3-2. Experiments conducted in this study... 45
Table 4-1. Threshold Days for differences between controland pesticide-treated plants52 Table 4-2. Band sensitivities and correlation coefficients ... 58
Table 4-3. Threshold Days of NDVI, RVI, and SAVI for three sensitivity experiments. 60 Table 4-4. Sensitivities and correlation coefficients for NDVI, RVI and SAVI ... 62
Table 4-5. Sensitivities of special vegetation indices for sensitivity experiments ... 64
Table 4-6 Sensitive band and vegetation indices determined from ... 77
sensitivity experiments Table 4-7. Threshold Days of sensitive bands to differentiate water stress ... 81
and greenbug infestation Table 4-8. Threshold Days of sensitive vegetation indices for differentiating ... 84
greenbug infestation and water stress Table 4-9. Band sensitivities and correlation coefficients in growth stageexperiment... 90
Table 4-10. Threshold Days for sensitive vegetation indices ingrowth stage experiment ... 91
Table 4-11. Correlation coefficient for plants at the two-leaf and the tilleringstages... 92
Table 4-12. Threshold Days of sensitive bands to compare aphid infestations... 95
Table 4-13. Comparisons of Threshold Days of sensitive vegetation ... 97
indices for different aphid infestations
List of Figures
Fig 1-1. Photographs showing greenbug infestation on wheat leaves... 2
Fig 3-1. Experiment facilities ... 38
Fig 3-2. Experiment layout. ... 41
Fig 4-1. Photographs showing different treatment effects at the end of sensitivity experiment (SEex1). ... 53
Fig 4-2. Densities of greenbug over time for three sensitivity experiments... 54
Fig 4-3. Average daily temperatures (oC) over time for three sensitivity experiments. ... 55
Fig 4-4. Threshold Days of bands for three sensitivity experiments. ... 56
Fig 4-5. Threshold Days of special vegetation indices for three sensitivityexperiments. 64 Fig 4-6. Temporal changes in reflectance at 630 nm for three sensitivity experiments. .. 68
Fig 4-7. Temporal changes in reflectance at 694 nm for three sensitivity experiments. .. 69
Fig 4-8. Temporal changes in NDVI_830_560 for three sensitivity experiments... 70
Fig 4-9. Temporal changes in RVI_800_694 for three sensitivity experiments... 71
Fig 4-10. Temporal changes in RVI_900_694 for three sensitivity experiments... 72
Fig 4-11. Temporal changes in RVI_950_694 for three sensitivity experiments... 73
Fig 4-12.Temporal changes in VI1_830_560 for three sensitivity experiments ... 74
Fig 4-13. Temporal changes in VI2_800_694 for three sensitivity experiments. ... 75
Fig 4-14. Photographs showing four treatment effects on plants at the end of experiment (DIex1)... 80
Fig 4-15. Densities of greenbug over time for three differentiating experiments. ... 81
Fig 4-17. Densities of greenbug over time in growth stage experiment... 87 Fig 4-18. Threshold Days of sensitive bands in growth stage experiment. ... 89 Fig 4-19. Temporal changes in densities of GB and RWA in comparing experiment. .... 94 Fig 4-20. Temporal changes in RVI_800_450 for three treatments in comparing
experiment... 100 Fig 4-21. Temporal changes in RVI_900_450 for three treatments in comparing
experiment... 100 Fig 4-22. Temporal changes in YI for three treatments in comparing experiment... 101 Fig 4-23. Temporal changes in NPCI for three treatments in comparing
CHAPTER 1
Introduction
This chapter aims to give background information about greenbug (Schizaphis graminum (Rondani)) infestation and significance of this research. Research goal and objectives for this study are also defined.
1.1 Greenbug infestation and its problems
The greenbug belongs to a group of insects known as aphids, which are small, soft-bodied, sucking insects (Brooks, 1991). The greenbug is a green to yellow-green aphid with a dark green stripe down the middle of its back. It is a vector of barley yellow dwarf virus (University of California, 2002). Greenbugs are important pests of major crops, such as wheat, barley and sorghum. They usually feed in colonies on the undersides of leaves and suck sap and during feeding inject a toxic substance into the plant (Knutson and Ree, 1998). Infestation symptoms initially appear as groups of small, reddish, pinpoint spots on infested leaves. Later, as feeding continues, leaves turn yellow and begin to die (Brooks, 1991). Figure 1-1 shows the photos of greenbug infestation. Crop damage by greenbug infestation is related to the number of greenbugs and the length of time they persist on the plants. It also depends on plant size, vigor and growth stage and moisture conditions. Plants infested by greenbugs also show some physiological and metabolic changes, such as decrease of water potential and chlorophyll, and lower rates
Fig 1-1. Photographs showing greenbug infestation on wheat leaves (a) at the beginning stage; (b) at the middle stage. (b)
of CO2 assimilation (Cabrera et al., 1995). If greenbug infestation could not be controlled in time, yield losses become inevitable. In addition, heavy feeding by greenbugs causes typical "greenbug spots" in a field (Elliot and Kieckhefer, 1987). The centers of the spot are made up of dead plants and skins of greenbugs, surrounded by living plants which are heavily infested and beginning to turn yellow.
In the Central Great Plains area, greenbug outbreak have caused significant economic loss to many farmers (Brooks, 1991). In 1976-77, a severe outbreak of greenbugs, combined loses of growers from reduced yields and insecticide applications exceeded $135 million in Oklahoma (Starks and Burton 1977). During 1992-93, an extremely low greenbug year, the pest caused $321,000 in losses in Oklahoma (Webster, 1995). During a major outbreak of greenbugs on wheat and extreme drought in the spring of 1996 wheat growers in Oklahoma experienced the lowest per-acre yield since 1967 (Peters et al., 1997). During the 1997-1998 growing season in Kansas and Oklahoma, yield losses due to greenbug infestation were 2.5% and 0.18 % respectively (Webster et al., 2000). The severe damage to wheat, sorghum, and barley caused by the greenbug makes it the key insect pest of these crops in much of Oklahoma, Texas, and Kansas. Chemical insecticides are used almost exclusively for controlling the greenbug and losses are closely tied to insecticide costs for control (Patrick and Boring, 1990; Webster, 1995). The more commonly used insecticides for treating greenbug infestation
(chlorpyrifos, dimethoate, disulfoton, ethyl parathion, and methyl parathion) are among the most toxic chemicals currently used for insect control. During widespread severe greenbug outbreaks millions of acres are sprayed with these compounds in Oklahoma in an effort to save wheat crops (Browning et al., 1982). This high insecticide use poses
problems to the environment, especially as it relates to conservation of migratory waterfowl on prairie potholes, playas, and other wetlands in the Great Plains that
frequently become contaminated with insecticides in run-off from agricultural fields and from improper application (Flickinger et al., 1991; Grue et al., 1988; Klass, 1982). Currently, many fields are treated without sufficient knowledge of greenbug density or plant injury. Insecticides are often applied when greenbug populations are too low to cause sufficient yield loss, or they are treated so late in the growing season that most yield loss has already occurred (Wratten et al., 1995). Widespread greenbug outbreaks occur every 5-7 years and result in heavy insecticide use and greatly reduced yields. These losses present an impediment not only to the economic viability of wheat production, but also to environmental integrity and sustainability. Integrated pest management (IPM) has emerged as the dominant paradigm for managing pests and diseases in agriculture (Pedigo, 1995). The main goal of IPM goes beyond that of simply eradicating pests, but includes reducing pests to densities below which appreciable damage occurs, thereby maintaining environmental quality and increasing grower’s profits. IPM involves a holistic approach that integrates multiple tactics to manage pest populations. A critical component of IPM is monitoring fields to determine whether there is a pest problem. To minimize economic and environmental loss and conduct timely and effective control, early detection of greenbug infestation is desirable for farmers.
1.2 Current research on detecting greenbug infestation
Although many research projects related to greenbug infestation are being conducted, few researchers focus on the detection of crop stress induced by greenbug
infestation. Currently, field scouting is a major method to identify if there is a need to apply greenbug control in a field. The performance of field scouting mainly depends on correct identification of the pests. Crop pests can be identified through a combination of direct recognition, knowing where and when the insect is likely to be found, and
recognizing injury symptoms on the plant. It is normal that greenbug scouting is time and labor consuming because it needs to provide enough information to make an
economically sensible decision.
In the United States, there are many scouting and decision-making methods for greenbug IPM. In Oklahoma, there is a greenbug scouting and decision-making system called “The Cereal Aphid Pest Management Expert System”. It was developed through the cooperative efforts of the USDA Agricultural Research Service, Site Specific Technology Development Group of Stillwater (SST), and Oklahoma State University. This system consists of a set of computer programs designed to help the user manage cereal aphids in winter wheat. It can help farmers identify cereal aphids and determine the economic threshold for greenbugs in wheat using a new scouting technique called Glance ‘n Go, which was developed from data collected in over 120 wheat fields in Oklahoma over 3 years (Elliott et al., 2001). Glance ‘n Go does not need to count actual numbers of greenbugs but only keep track of the number of infested tillers. Thus, it saves time and money on scouting. With this system, a grower can quickly detect greenbug infestations and make control decisions based upon the value of the crop and the costs associated with production. This system is a big step forward for controlling greenbugs in winter wheat.
Remote Sensing techniques began to show the potential to be used for detection of greenbug infestation. It was found that remote sensing can identify pest infestations in agricultural fields (Hatfield and Pinter, 1993). Such techniques rely on the indirect indication of the pest through visual manifestation of the plant injury because pest-induced crop stress can be visualized using some wavelengths such as red ® and near infrared (NIR) bands (Riley, 1989). Deol et al. (1997) and Ma et al. (1998) demonstrated that damage caused by greenbug infestation could be detected by some techniques that can indirectly measure the content of chlorophyll of leaves infested by greenbugs. Riedell et al. (1999) reported that at leaf level, bands ranging 625-635 nm and 680-696 nm were most sensitive to greenbug infestation through a greenhouse study. Michels et al. (1999) found that it is possible to use IRT (Infrared thermometer) to detect greenbug infestation if it is sure that wheat plants are not under water stress. But none of the previous research results could be directly applied to detection of greenbug infestation. Because the
detection of greenbug infestation requires knowledge on sensitive bands at canopy level. Also, it is difficult to know whether wheat plants are under water stress or not before conducting detection of greenbug infestation.
1.3 Challenges for studies on detecting greenbug infestation
Greenbug outbreaks often appear at times when the wheat crop is under water stress (Michels and Undersander, 1986; Michels and Behle, 1998; Ortman and Painter, 1960). Michels and Undersander (1986) reported that the number and distribution of greenbugs on host plants were strongly affected by water stress. Thus plants under water stress are more sensitive to greenbug infestation and water stress affects the level of greenbug
infestation. In addition, the combination of water stress and greenbug stress did not cause more changes on host plants than water stress alone (Ryan et al., 1987). Cabrera et al. (1995) also reported that greenbug infestation of barley produced changes similar to those observed in plants subjected to water stress. So it is hard to separate and differentiate water stress and greenbug infestation, considering their coexistence under field conditions. Therefore, the key problem for detecting greenbug infestation is how to differentiate these two kinds of stresses under the field conditions.
It is well known that the greenbug (GB) is a major pest of wheat plants in Great Plains. However, Russian wheat aphid (RWA), Diuraphis noxia (Mordvilko), is also a serious threat to wheat production throughout the western United States west of the 100th meridian (Hein et al., 1990). The economic impact from this pest can be devastating and has been estimated at $893 million for 1987-1993 (Morrison and Peairs, 1998). Besides, two kinds of infestations may coexist in the same field. Therefore, how to differentiate wheat damage caused by these two kinds of aphids is also important and necessary. Riddell and Blackmer (1999) identified wavelengths sensitive to greenbug infestation at leaf level but it is necessary and important to identify wavelengths that are most
sensitive to greenbug infestation at canopy level. It is likely that different stresses such as water stress and greenbug infestation coexist under the field conditions. It will be useful to differentiate water stress and greenbug infestation. In addition, vegetation indices such as Normalized Difference Vegetation Index (NDVI) need to be examined for their potential to detect greenbug infestation.
Plant damage symptoms caused by greenbug infestation are closely related to the growth stage of host plants, the infestation levels, such as abundance level of greenbugs
and infestation length (Brooks, 1991). More research needs to be done to define the reflectance profile of plants under different growth stages and infestation levels.
Environmental conditions, such as air temperature, humidity and wind, are important
factors that influence greenbug infestation (Brooks, 1991). It is necessary to study the relationship between canopy reflectance and greenbug infestation under different
environmental conditions. In addition, the special spatial patterns of greenbug infestation, “greenbug spots”, might also be useful for detecting greenbug infestation. Field research needs to be done to examine differences of spatial patterns among different stresses. Therefore, the purpose of this study is to identify bands and vegetation indices sensitive to greenbug infestation at canopy level by observing the change in spectral characteristics of greenbug-induced stress on wheat plants using hand-held radiometers under greenhouse conditions. This will provide useful information for detecting wheat stress induced by greenbug infestation and lay the groundwork for field studies to develop airborne remote sensing methods for identifying fields threatened by Greenbug infestation, thereby obtaining both economic and environmental benefits.
1.4 Significance of this research
Research findings from this study will help develop a directed scouting approach used for greenbug scouting and control in IPM. For traditional field scouting methods, it is difficult to cover the entire field area given economic and time constraints. It may not be possible to estimate the full extent of damage through visual methods of identification. Since there is a certain spatial pattern -greenbug spot in the infested field, if greenbug spots could be detected using sensitive band or vegetation indices determined in this
study by satellite images or aerial photos, it will be possible to identify these areas as targets for intensive sampling and initiate directed scouting. Targeted scouting of greenbug spots will help reduce the number of samples required and thus save time and labor for scouting. It also allows site-specific pesticide applications to targeted areas of greenbug outbreaks and protect non-infested and lightly infested crop before infestation spreads across the whole field or to adjacent fields. Thus it could reduce the amount of pesticide applied and decrease the damage to beneficial insects in order to obtain the goal of IPM. In this case, it is likely that natural enemies would suppress the greenbug
populations in the rest of the untreated areas of the field. Adopting a directed scouting approach will lower costs to the farmer and benefit the environment. In this way, this study will help build a new approach to greenbug IPM.
Until now the spectral responses of wheat plants to greenbug infestation were poorly studied. This research will provide detailed and dynamic data on canopy reflectance of wheat under greenbug infestation. It intends to address both the onset of greenbug infestation and the spectral patterns associated with the greenbug infestation. This could benefit NASA and various private enterprises in their endeavors to deploy sensors with specific applications on future satellite payloads.
Finally, this research study has the potential to initiate and integrate other studies involving detection of other crop stresses such as water, nutrient, and pathogen stress. In return, the detection of crop stress will be greatly improved and developed.
1.5 Research goal and objectives
The overall goal of this study is to characterize wheat stress caused by greenbug infestation using ground-based radiometry. Specific objectives include:
1.5.1 Identifying wavelengths most sensitive to greenbug infestation
It is rare that there is only a single crop stress and different stresses may often coexist under field conditions. Riedell and Blackmer (1999) identified some wavelengths that were sensitive to greenbug infestation on wheat. However, the reflectance
measurements of their study were at leaf level not canopy level. To conduct field detection of greenbug infestation, it is necessary to identify wavelengths that are most sensitive to greenbug infestation at canopy level.
1.5.2 Identifying vegetation indices most sensitive to greenbug infestation Currently, various vegetation indices, e.g. NDVI and NPCI (Normalized total Pigment to Chlorophyll Index), are being used for crop stress detection but no vegetation indices specially used for greenbug infestation at canopy level have been reported. Riedell and Blackmer (1999) found that NPCI was significantly correlated with total chlorophyll concentration in infested leaves. Adams et al. (1999) reported that the Yellowness Index (YI) was a good measure of leaf chlorosis, which is typical symptom of greenbug infestation, in stressed plants. But their study is only at the leaf level. Thus, it is important to examine sensitivities of various vegetation indices to greenbug infestation at canopy level.
1.5.3 Differentiating greenbug infestation from water stress
Due to co-existence of greenbug infestation and water stress on wheat, it is hard to separate and differentiate water stress and greenbug infestation. Thus, an important issue for detecting greenbug infestation on wheat is how to differentiate these two kinds of stresses. Therefore, it will be important to test if sensitive bands and vegetation indices can be used to differentiate greenbug infestation from water stress.
1.5.4 Examming the impact of growth stage on the detection of greenbug infestation Plant damage symptoms caused by greenbug infestation are closely related to the growth stage of host plants (Brooks, 1991). However, there is no study involving monitoring change of canopy reflectance of infested plants at different growth stages. Also, plant coverage on the soil varies at different stages. Plant cover differences due to growth stages may have impact on reflectance measurements. Thus, it is not clear that sensitive band/vegetation indices determined at one stage can be used for detection of infestation at another stage. Research needs to be done to define the reflectance profile of plants at different growth stages.
1.5.5 Distinguishing greenbug infestation and infestation by Russian wheat aphid As mentioned before, two kinds of infestations may coexist in the same field. Also, chlorosis and necrosis are typical symptoms for aphid infestation in small grains and there is a similarity of the spectral responses of plants between these two kinds of infestation (Riedell and Kieckhefer, 1995). Thus, how to differentiate wheat damage caused by these two kinds of aphids is also important and necessary. Therefore, it will be necessary to examine if sensitive band and vegetation indices could be used to distinguish
CHAPTER 2
Literature Review
The main purpose of this chapter is to review the application of ground-based radiometry on crop stress detection and examine some ways for detecting wheat stress induced by greenbugs.
2.1 Introduction
2.1.1 Leaf responses to plant stress
Plant stress is considered to be a significant deviation from the conditions optimal for plant growth and thus could cause harmful effects when the limit of a plant’s ability to adjust is reached (Larcher, 1995). Plant stress can affect almost every part of a plant although normally one or some parts of a plant are influenced at the beginning. Leaf responses to different stresses are very important when considering remote sensing techniques used to detect crop stress.
When water content of plant cells is lower than optimum and causes some degree of metabolic disturbance, a plant is said to be suffering water stress (Fitter and Hay, 1981). Leaf curling, wilt or drastic decreases of leaf area expansion are general symptoms of water stress (Alscher et al., 1990). The extent of stress impact on plant leaves depends on the occurrence of the water stress relative to the phenological stage of the plant and severity of the water deficit (Chaney, 2000).
Nitrogen deficiency is the most common and widespread nutrient deficiency. When the required amount of nitrogen is not available, plants are said to be under nitrogen deficiency or nitrogen stress (Larcher, 1995). Plant leaves generally turn yellow (overall chlorosis) under N stress. In young plants the whole plant turns yellow while in older plants the deficiency is more pronounced in older leaves (Reid, 1999).
A plant disease is a continuous harmful process that is usually caused by a
microorganism and is characterized by visible morphological changes (Nyvall, 1979). Many diseased plants show symptoms on leaves, such as leaf discoloration or yellowing in localized or distinct patterns caused by virus, and small rusty-red, brown or black spots and stripes caused by fungi (Mikkelson, 1999).
Pest infestation refers to the presence of unusually large numbers of pests on the surface of plants and the damage to plants caused by these insects (British Society for Plant Pathology, 1973). Change in leaf color is a common symptom of pest infestation, and some changes involve cellular and tissue deterioration leading to leaf aging and death (Fogal et al., 1997).
Ozone (O3) injury refers to injury or damage to plants due to high concentration of
ozone in the atmosphere. The injury caused by ozone is characterized by the appearance of chlorotic to pale tan or whitish lesions on the affected leaf. Extent of damage is related to the degree of leaf maturation and older leaves are more easily damaged by ozone (Treshow and Anderson, 1989).
Heat and cold, depending on their intensity and duration, could impair the metabolic activity, growth and variability of plants and thus limits the distribution of a species. Thus there are threshold temperatures for most crops. When critical temperature threshold is
crossed, cell structures and cellular functions may be damaged (Larcher, 1995). Heat stress refers to harmful effects caused by high temperature. Plants under heat stress are darker when compared to non-stressed plants and damaged plants have dry or yellow-dry spots on the leaves (Staub, 1990). Chilling injury is the physical and/or physiological changes that are induced by exposure to very low temperatures (Saltveit and Morris, 1990). During chilling, the loss of chlorophyll, apparent as leaf yellowing or purpling, may occur as a consequence of photo-oxidation.
When salt content in soil exceeds the capacity of plants to cope, plants are under salinity stress (Larcher, 1995). Plants suffering from salinity stress show reduced leaf size, scorching of leaf tips or margins, and premature discoloration and abscission of the leaves. Salt stress may have been the first chemical stress factor encountered during the evolution of life on earth.
2.1.2 Principles of crop stress detection
Remote sensing is “the science and art of obtaining information about objects through the analysis of data acquired by a device that is not in contact with the object” (Lillesand and Kiefer, 2000).Detection of crop stress by remote sensing is based on the assumption that stress factors that interfere with photosynthesis process or the physical structure of the plant affect the absorption of light energy and thus alter the reflectance spectrum, by reliably measuring the reflectance of spectrum the health state of a plant can be determined. Leaf reflectance is governed by leaf surface properties, internal structure,
the concentration and distribution of biochemical components, such as chlorophyll and water content, and thus remote sensing analysis of reflectance has been used to assess both biomass and physiological status of a plant (Penuelas et al., 1997). Generally, leaf
chlorophyll content is the primary factor affecting leaf reflectance in the visible and near infrared wavelengths from roughly 500 to 900 nm and leaf water content is the primary factor from 1300 to 2500 nm (Carter, 1991). Many researchers (Carter, 1993; Malthus and Madeira, 1993; Shibayama et al., 1993) reported that plants under stress have a decrease in reflectance of the near infrared band (750-1300 nm), a reduced red absorption in the chlorophyll active band (680 nm), and a consequent shift of the red edge.
Therefore, leaf reflectance can be used to derive indicators that are representative of crop conditions and to assess different stresses (Fernandez et al., 1994). Furthermore,
vegetation indices such as NDVI combining the R and NIR information are also useful for characterizing crop stress (Hatfield and Pinter, 1993).
Since a major role of transpiration is leaf cooling, canopy temperature and its
reduction relative to ambient air temperature is an indication of how capable transpiration is in cooling the leaves under a demanding environmental load. It was reported that plants subjected to water stress have higher leaf temperature than normal plants and other types of crop stress related to water uptake by plant roots or translocation of water to the leaves for evaporation also have similar symptoms (Michels, et al., 1999; Moran et al., 1994; Pinter, 1979). The use of canopy temperatures to detect water-related stress in plants is based upon the assumption that, as water becomes limited, transpiration is reduced and plant temperature increases. The “Crop Water Stress Index” (CWSI) that was based on infra-red thermometry has often been used to quantify water-related crop stress. So crop stress can also be detected by using infrared thermometry. It is clear that remote sensing techniques can detect crop stress due to such factors as insect infestation, disease,
2.1.3 Status of current research on crop stress detection by remote sensing
Image-based remote sensing, such as airborne systems and satellites, has been successfully used in detection of crop stresses, such as pest infestation and nitrogen stress (Bell, 1995, Hugh-Jones et al., 1992; Maas et al, 1999; Royle and Lathrop, 1994). For example, Landsat satellite images were used to map the western tarnished plant bug (Lygus hesperus (Knight)) that is a key pest in many crops (including cotton, dry beans, seed alfalfa, and various fruits and vegetables) in the San Joaquin Valley (Goodell et al., 2002). They also identified areas of senescing natural vegetation that were in close proximity to cultivated areas. GopalaPillai et al. (1998) used high-resolution color infrared (CIR) aerial images to detect in-field spatial patterns of nitrogen stress in a corn field and found that the canopy reflectance was well correlated to the applied nitrogen and the yield from 75 days after sowing. There are, however, still a lot of technical limitations that affect image-based application on crop stress detection. Currently, no satellite sensor that has both sufficient spectral resolution and spatial resolution for with-in field analysis is available. Lower temporal resolution for satellites is also a big obstacle for satellite-based detection of crop stress. For aircraft-based sensors, calibration and geometric correction are often difficult for large area coverage (Moran et al., 1997). On the contrary, by using ground-based radiometry techniques, such as hand-held radiometers, people can control monitoring conditions and measurements can be easily quantified and repeated under the same or similar conditions. It also allows more precise analysis and interpretation because the crop can be sampled directly to measure
Srivastava, 1985). These are very useful for site-specific crop stress detection. Therefore, ground-based radiometry has been widely used in crop stress detection (Hatfield, 1990).
2.2 Crop stress detection using ground-based radiometry
2.2.1 Ground-based radiometryGround-based radiometry is a quantitative measurement of radiance, irradiance, reflectance or transmission of objects by using hand-held spectroradiometers, radiometers or infrared thermometers (IRT) in a field and greenhouse, or a laboratory. It measures both irradiance and radiance of an object and correlates them to the biological, chemical and physical attributes of the object. Ground-based sensors are often hand-held or mounted on a tripod, ladder, scaffolding, tall building, tower, etc. Compared to image-based remote sensing, field spectra of target materials are collected to allow for more precise image analysis and interpretation (Goetz and Srivastava, 1985). Ground-based radiometry sensors can be used to record detailed information about the surface that is compared with information collected from aircraft or satellite sensors. They also can be used to better characterize the target that is being imaged by these sensors.
2.2.2 Nitrogen deficiency
Although a chlorophyll meter is often used for assessing crop N status, there is a lot of research that involves the use of hand-held radiometers or spectcroradiometers to detect nitrogen deficiency. Vouillot et al. (1998) used a field radiometer to conduct field measurement of N deficiency of wheat and spectral bands: 500-590 nm (green), 610- 680 nm (red), 790-890 nm (near infrared) were used. They found that ratio of near infrared to red was closely related to nitrogen concentration. Schepers et al. (1998) utilized Li-Cor
canopy sensors designed to measure reflectance of green and NIR portions of the spectra and a chlorophyll meter to monitor the N status of irrigated corn in the field. They found that green NDVI = (NIR-green)/ (NIR+green) was a good indicator of yield potential because it theoretically integrates crop N status (greenness) and biomass.
To increase spectral resolution, Blackmer et al. (1994) conducted reflectance measurements of corn leaves cut from corn planted in research plots by using a Hunter tristimulus colorimeter from 400-700 nm in 10 nm bandwidths in the lab and found that 550 nm was the best wavelength to differentiate different N treatments. They concluded that the measurement of light reflectance near 550 nm was promising to detect N
deficiencies in corn leaves. Sembiring et al. (1999) used a PSD 1000 Ocean Optics fiber optic spectrometer (345-145 nm) to detect winter wheat stress due to N and P deficiency at Tipton and Perkins, Oklahoma. It was found that NDVI and the ratio index = NIR/red were good indices to predict biomass, and N and P uptake.
Wavelengths that are most sensitive to nitrogen deficiency might be crop-type dependent because red band and near infrared band were used for winter wheat but the band centered at 550 nm or infrared portion were used for corn. These differences could be explained by many factors, including differences in water content, plant anatomy, and the concentration of cell constituents. NDVI and VI (Vegetation Index) are often used and green NDVI might be a good indicator of yield potential. Compared to other sensors, the Li-Cor sensor can detect cumulative effects of plant vigor and monitor immature leaves that might indicate current N status better than more mature leaves (Schepers et al., 1998). All above studies except the study of Blackmer et al. (1994) were conducted
under field conditions. Detection of N deficiency by ground-based radiometry holds increased potential in the near future.
2.2.3 Water stress
Compared to other stresses, water stress has been most widely studied using ground-based spectroscopy/radiometry, and hand-held multi-spectral radiometers were usually used. There are also numerous studies involving the use of hyperspectral spectroscopy by spectroradiometers to detect crop water stress.
Ripple (1986) measured reflectance of snapbean leaves collected from one
greenhouse at three spectral regions: 630-690, 760-900, and 2080-2350 nm. The results showed that the red and middle infrared bands are sensitive to changes in both leaf cover and relative water content of leaves while the near infrared was sensitive to only changes in leaf cover. Mahey et al. (1991) monitored radiance of wheat canopies in the field at two bands: 625-689 nm and 760-897 nm and found that NDVI was a good indicator for water stress. Fernandez et al. (1994) studied radiometric characteristics (ranging from 400 to 2200 nm) of wheat under water and nitrogen stress in the field. The results
revealed that except for LAI (Leaf Area Index), relations between canopy reflectance and most physiological parameters were dependent on plant treatment, and NDVI was the most powerful index for water stress.
To get detailed information about spectral response of crop water stress, some researchers used field spectroradiometers to do numerous experiments. Shibayama et al. (1993) observed radiometric characteristics of rice canopy in the wavelength range 400-1900 nm in the field. Based on analysis of spectral reflectances and calculation of NDVI, it was concluded that reflectance measurements and their first derivatives in near infrared
and mid-infrared ranges are better ways to detect water stress in rice canopies. Penuelas et al. (1993) conducted measurements of spectral reflectance and water status variables, such as RWC (Relative Water Content), on three experimental objects: irrigated gerbera in one greenhouse, pepper and bean in a chamber, detached bean leaves at bands from 390 to 1100 nm. The results illustrated that reflectance in the 950-970 nm region is a good indicator of plant water status. Field radiometric measurements of two deep-rooted shrubs (Quercus coccifera and Arbutus unedo), two shallow-rooted shrubs (Cistus albidus and Cistus monspeliensis), and a grass (Brachypodium retusum) were made by Penuelas et al. (1997) and it was found that indices: WI (Water Index = R900 nm/R970 nm) and NDVI were closely related to plant water concentration. Penuelas and Inoue (1999) conducted measurement of reflectance on detached leaves of two plants, peanut and wheat in the spectral range from 400 to 2500 nm and computed several indices: WI, NDVI, WI/NDVI, SIPI (Structural Independent Pigment Index = R445)/ (R800-R680)). The results showed that the ratio of WI to NDVI was a best indicator of RWC. Based on field radiometric/ polarimetric data of wheat canopies measured using one spectropolarimeter, Manjul (2000) described new spectral vegetation indices calculated from spectral reflectance and spectral degree of polarization. Spectral ranges from 650 to 1000 nm and 650 to 800 nm were found very useful for crop water stress detection. Based on the above-mentioned literature, spectral wavelengths that are most
sensitive to water stress depend on species. Because red and middle infrared bands were used for snapbean, red and near infrared bands were used for wheat, and near infrared (960 nm) band was used for rice. Carter (1991) reported that visible reflectance was most sensitive to water stress at 535-640 nm and 685-700 nm but Penuelas et al. (1993 and
1997) found that change in reflectance at 950-970 nm was more effective for detection of water stress at canopy levels. All the differences described above may be caused by differences in the anatomical structure and water content of leaves from different crop species.
Different indices were also used for detecting water stress. Among them, NDVI has been widely used (Fernandez et al., 1994; Mahey et al., 1991; Shibayama et al., 1993), although specific wavelengths used for calculation of NDVI differ among studies. New Spectral Vegetation Indices (SVI) may eliminate the effects of soil background (Manjul, 2000). In addition, WI (Water Index) is also helpful to characterize crop water stress (Penuelas et al., 1993, 1997; Penuelas and Inoue 1999; Riedell and Blackmer, 1999). Foliage temperature can be incorporated into crop water stress indices that have been related to soil water availability and leaf water potential (Hatfield, 1990). Plant water stress in the energy balance method can be quantified by one of two methods: an
empirical approach developed by Idso et al. (1981) and a theoretical approach by Jackson et al. (1983). Both methods are based on comparison between foliage and air temperature. Infrared thermometers (IRT) are often used to detect water stress. Stark and Wright (1985) conducted field studies to detect soil water deficits in potato. Concurrent measurements of foliage – air temperature differences, leaf water potential and vapor pressure deficit- were obtained from differentially irrigated potato during the growing season. The results showed that Plant Water Stress Index (PWSI) was linearly related to water potential caused by moderate to severe water deficits. Yazar et al. (1999) evaluated the Crop Water Stress Index (CWSI) for irrigated corn in the field and found that CWSI was a useful tool to measure water stress in corn. Carcova et al. (1998) conducted two
field measurements on maize. It was found that there was a good relationship between CWSI and available soil water. Based on field measurement of iceberg lettuce, Alves and Pereira (2000) provided a new approach for non-water-stressed baselines for irrigation scheduling using IRT. Compared to water stress detection by measuring leaf reflectance, IRT and CWSI seem more likely to be used in practice, considering degrees of maturity of techniques and cost.
2.2.4 Plant diseases
There are a number of studies in which hand-held multispectral radiometers were used to detect plant diseases. Nutter (1989) reported that plant disease gradients in a peanut crop could be quantified by measuring percent leaflet defoliation with respect to distance from the sources of leaf spot and by measuring percent canopy reflectance at the 800 nm wavelength in the field. It was also found that the relationship between leafspot defoliation, canopy reflectance and pod yield in field peanut (Nutter et al., 1990; Nutter and Littrell, 1996). Nilsson (1991) measured reflectance of cereal leaves, such as barley infected by net blotch, wheat infected by Glume blotch Septoria nodorum, in different seasons and varying weather conditions. They found that there were good correlations between spectral reflectance and disease incidence, plant height and weight.
Malthus and Madeira (1993) used a spectroradiometer to detect the fungus Bortrytis Fabae (chocolate spot) infection of beans in the field by scanning at 2 nm intervals over the 400-1100 nm range. The results showed that the most significant change of
reflectance was a flattening of the response in the visible region and a decrease in the near infrared reflectance shoulder at 800 nm.
It was found that band at 800 nm was often selected to detect plant stress due to diseases. Since canopy reflectance at 800 nm was closely related to plant disease gradients and plant biomass and in near infrared wavelengths, there was significant decline in reflectance at about 800 nm (Malthus et al., 1993; Nutter, 1989; Nutter et al., 1990; Nutter and Littrell, 1996). However, no stress index was used in the above studies.
Since higher leaf temperature or change of foliage reflectance usually appears when plants are infested with disease, many researchers adopted IRT to detect plant disease (Mengistu et al., 1987). Pinter (1979) studied biological stresses in sugar beets infected with Pythium aphanidermatum (Pythium root rot) and cotton infected with
Phymatotrichum (Cotton root rot) in the field. The results showed that green leaves of infected plants had midday radiant leaf temperatures 3-5o C warmer than adjacent plants with no sign of disease. Nilsson (1991) measured leaf temperature of different infected plants, such as barley infected by net blotch, wheat infected by Glume blotch, and roses infected by rust, under various weather conditions. It was found that leaf temperature of the infected host plants could increase by infectious disease, in some cases up to 100 C. These findings illustrate that plant diseases can be detected by using IRT.
2.2.5 Ozone injury
With the increase in ozone pollution, a lot of research was done to measure crop
damage caused by ozone injury. Most researchers used spectrophotometers,
monochromators or spectroradiometer with hyper-spectral bands to detect leaf injury caused by ozone. Runeckles and Resh (1975) used a spectrophotometer at band 550-650 nm to monitor damage caused by ozone on bean plants grown in pots in a greenhouse and found a significant increase of reflectance in bean leaves exposed to sub-acute levels of
ozone. Cure et al. (1998) conducted an open-top chamber study to measure ozone injury to soybean using a scanning monochromator (400-1100 nm). The results showed that O3
treatments were closely related with changes in reflectance at visible wavelengths and at near infrared wavelengths up to 720 nm. Similar studies were conducted by Cure and Heagle (1985) using a spectroradiometer to measure the leaf response of soybean to ozone. It was found that wavelengths at 560 and 620 nm were promising to assess the response of soybean to ozonestress. Penuelas et al. (1995) also used a spectroradiometer
to measure ozone damage on white pine seedlings in the field and calculated spectral reflectance indices: NDVI = (R900-R680)/(R900+R680), SIPI (Structural Independent Pigment Index), and SIXI (Structural Independent Xanthopyll Index). They found that the
biological parameters including chlorophyll concentration correlated well with spectral reflectance indices. There are greater chlorophyll degradation and lower photosynthetic and growth rates in the summer, compared to winter and spring.
To estimate ozone stress on wheat and corn, Rudorff et al. (1996) conducted an open-top chamber study using a radiometer with Landsat TM bands in the field under controlled atmospheric environments. It was found that the Normalized Difference (ND) index had lower values for plants grown under the high-O3 level and reduced ND values were related to the appearance of visual O3 damage symptoms on wheat leaves.
Wavelengths or spectra that are most sensitive to ozone stress might be also
dependent on crop types. Because green and red bands were used for bean plants such as soybean and blue, red and near infrared bands are used for wheat and corn (Cure and Heagle, 1985; Heagle et al., 1998; Penuelas et al., 1995; Rudorff et al., 1996; Runeckles and Resh, 1975). However, visible bands are mostly selected. Few researchers used
vegetation indices to study ozone stress. NDVI or ND was often selected to measure ozone injury on plants (Penuelas et al., 1995; Rudorff et al., 1996).
2.2.6 Heat stress
High temperature stress occurs in some countries such as India and has caused some wheat yield loss (Maheswari et al., 1999). Very few researchers, however, use field spectroscopy/ radiometry techniques to detect heat stress. Blum et al. (1982) used an infrared thermometer to measure the wheat canopy under heat stress in the field. Within a given year and site, under conditions of water stress, the extreme difference among wheat selection in midday temperature reached 8o C, at a mean ambient temperature 26o C.
2.2.7 Salinity stress
High levels of soil and water salinity can inhibit plant growth and reduce crop yield in agricultural food production. Wang et al. (2003) did a study that was designed to measure canopy spectral reflectance of soybean plants under salinity and irrigation treatments (drip, sprinkler, and furrow), and to relate the reflectance characteristics to salinity-induced alterations in leaf chlorophyll, specific leaf mass, and above-ground biomass. The reflectance measurement was made with a hand-held spectral radiometer, which establishes the signature plant responses to salinity. Results from this study indicate that background salinity stress can be delineated from reflectance and
temperature measurements of soybean plants. Canopy reflectance in the NIR spectrum region (810 to 950 nm) was significantly lower for soybeans grown under salinity stress.
2.2.8 Pest infestation
Detection of pest infestation often involves the use of hand-held radiometers or thermometers. Nicolas et al. (1991) evaluated the potential of radiothermometry for the detection of infestations by the nematode Heterodera avenae Woll. in winter wheat (Triticum aestivum L.) and they found that cumulative canopy temperature difference was useful for detecting the presence of nematodes and thermal images allowed precise delimitation of infested areas, and thus should be extensively applied to the detection of nematode attacks by remote sensing in large wheat fields. Yang and Cheng (2001) studied spectral characteristics of rice plants at various levels of infestation by the brown planthopper, Nilaparvata lugens (Homoptera: Delphacidae) using a spectroradiometer. It was found that there were significant differences in reflectance among infestations at wavelengths of 755 and 890 nm and the normalized difference vegetation index (NDVI) and cumulative reflectance were also useful to discriminate levels of infestation.
Although a lot of research is being done on greenbug infestation, few researchers focus on how to detect crop stress induced by greenbug infestation. Deol et al. (1997) developed a rapid and nondestructive technique to estimate the loss of chlorophyll in sorghum leaves caused by greenbug feeding. By measuring chlorophyll content of uninfested and infested leaf areas using a chlorophyll meter it was found that chlorophyll loss increased as the feeding duration of the greenbugs increased (Deol et al., 1997). Similarly, using a chlorophyll meter, Ma et al. (1998) observed chlorophyll loss in sorghum infested by greenbugs. These experiments demonstrated that damage caused by greenbug infestation could be detected directly or indirectly by techniques that measure the chlorophyll content of leaves infested by greenbugs.
Riedell and Blackmer (1999) conducted a greenhouse study aiming to find wavelengths most sensitive to greenbug infestation measured using a portable ASD spectroradiometer. In this study reflectance of detached wheat leaves infested with greenbugs was measured across from 350-1075 nm at about 1.4 nm intervals. NPCI and Water Band Index (WBI) were calculated. Results showed that reflectance values at the 625-635 nm and 680-696 nm range and NPCI were significantly correlated with total chlorophyll concentrations in infested leaves. However, results of this study might be different under field conditions, since this research was done only at leaf level and not canopy level.
Michels et al. (1999) used IRT to monitor the temperature difference of leaves of wheat under four regimes: normally-watered and not infested, normally-watered and infested, water-stressed but not infested, and infested and water-stressed in a greenhouse. The experiment illustrated that there was a significant and distinguishable temperature difference between non-infested and infested wheat and the differences increased with the abundance of greenbugs. However, it was hard to use IRT alone to differentiate water stress and greenbug infestation because it was found that there was no significant
difference between normally-watered but infested plants and non-infested and water-stressed plants (Michels et al., 1999).
Sensitive bands to various crop stresses are summarized in Table 2-1. It can be seen that different stresses on the same plants have been measured using different bands. For different crops under the same stress, sensitive bands are also different. This variance indicated that the most sensitive wavelengths used to detect crop stress might be crop-dependent.
Table 2-1 Sensitive bands to various stresses
Stress type Sensitive band (nm) Crop References Nitrogen deficiency 550 wheat Blackmer et al.(1994) Water stress 950-970 gerbera, pepper, bean Penueles et al.(1993)
650-800, 1000 wheat Manjul (2000) 535-640 wheat Carter (1993) Plant disease 800 peanut Nutter et al.(1990) Ozone injury 560-620 soybean Cure and Heagle (1985) Heat stress Thermal band wheat Blum et al.(1992) Salinity stress 810-950 soybean Wang et al.(2003) Pest infestation 755-890 wheat Yang and Cheng (2001) 625-635 wheat Riedell and Blackmer(1999)
680-696 wheat Riedell and Blackmer(1999)
2.3 Vegetation indices
Numerous vegetation indices were involved in the study of crop stress detection. A Vegetation Index (VI) is a quantitative characterization of remotely sensed temporal and spatial data. To enhance the plant stress signal, the measured spectral reflectance data from two or more spectral wavelengths are combined into vegetation indices based on different mathematical formulae. Spectral vegetation indices are mainly designed to improve vegetation sensitivity by reducing “noise” from soil and atmosphere and could be used as quantitative indicators of vegetation amount. They reduce the
multidimensional spectral space of the vegetated scene to one dimension in order to sense variability in such properties as biomass, (LAI) Leaf Area Index, and fractional cover and types. During the past decades, most vegetation indices were derived using visible bands and near-infrared (NIR) spectral region. The main purpose using these vegetation indices is to capture i) the relatively high radiation absorption of red light by leaves due to the presence of chlorophyll and ii) the high reflectance of NIR light due to scattering in the
leaf internal structure (Curran, 1980). Jordan (1969) developed the first RVI (Ratio-Based Index), which is the ratio of near infrared (NIR) and red bands. Later, the NDVI was widely used for crop stress detection because of its high correlation with vegetation parameters such as biomass and green leaf area (Curran, 1980). While NDVI seemed promising, soil background and BRDF (Bidirectional Reflectance Difference Factor) limited its application (Huete, 1988). To minimize the impact of soil background, Huete (1988) developed the soil-adjusted vegetation index (SAVI) and Qi et al. (1994) created the Modified Soil Adjusted Vegetation Index (MSAVI). The Atmospherically Resistant Vegetation Index (ARVI) of Kaufman and Tanre (1996) and the Global Environmental Monitoring Index (GEMI) of Pinty and Verstraete (1991) were reported to be less sensitive to the atmosphere. Penuelas et al. (1993 and 1997) developed the Water Band Index (WBI) to quantify water stress on crops. Adams et al. (1999) suggested the Yellowness Index (YI) as a good measure (at leaf level) for chlorosis in stressed plants. In addition, vegetation indices derived from the chlorophyll-centered bands, such as the NPCI = (R680-R430) / (R680+R430), are becoming valuable tools in the evaluation of plant status both in agricultural and natural plant communities (Penuelas et al., 1993). Comparisons of sensitivities and abilities for stress detection among various vegetation indices were conducted by several researchers. Jackson et al. (1983) did a study on discrimination of growth and water stress in wheat using various vegetation indices. It was found that sensitivity of the various indices to vegetation depended on plant growth stage and atmospheric path radiance. Wanjura and Hatfield (1987) reported that among three commonly used vegetation indices - RVI, NDVI and GVI (Greenness Vegetation Index) - RVI was more sensitive to high levels of biomass and LAI (Leaf
Area Index) but NDVI and GVI were best estimators of LAI and ground cover when crops were at early growth stage. Mickelson et al. (1998) studied the impact of variations in soil texture and moisture on the green vegetation index (GVI) and the NDVI for targets with specific vegetation cover amounts and varying soil backgrounds. They found that GVIvalues were much less influenced by soil background variation than NDVI. After examining the use of seven types of vegetation indices in field studies, Lawrence and Ripple (1998) found that among the ratio-based vegetation indices, the simple ratio (RVI) and NDVI are best indicators for vegetation cover under conditions of high substrate and vegetation heterogeneity. Thenkabail et al. (2000) examined three types of vegetation indices (NDVI, Optimum Multiple Narrow Band Reflectance (OMNBR), and soil-adjusted vegetation indices such as SAVI. They found that OMNBR had the “over fitting” problem and twelve types of narrow band NDVI were better predicators for crop variables.
All studies above suggest that the performance of vegetation indices was highly associated with crop variables examined, the plant species, the atmospheric condition and optical properties of the soil background. Different vegetation indices should be chosen for specific studies on crop stress detection. However, it is not known whether any band or vegetation index could be used to detect greenbug-induced crop stress. Various vegetation indices from relevant literature were summarized in Table 2-2.
Vegetation Index Formula
1. Atmospheric Resistant Vegetation Index, ARVI (Kaufman and Tanre, 1996) ARVI = (NIR – (2red – blue))/(NIR + (2red – blue)) 2. Difference Vegetation Index, DVI (Tucker, 1979) DVI = NIR-Red
3. Enhanced Vegetation Index, EVI (Verstraete and Pinty, 1996) EVI = (1+L) (NIR-red)/(NIR+C1*red -C2*blue+L) C1=6.0, C2=7.5, L=1.0
4. Global Environmental Monitoring Index, GEMI (Pinty and Verstraete, 1991) GEMI = η(1-0.25η)-(red - 0.125)/(1-red)
η = [2(NIR2-red2)+1.5NIR-0.5red] /(NIR+red+0.5)
5. Leaf Moisture Index, LMI (Parkes, 1997) LMI = R1650/R830
6. Modified Soil Adjusted Vegetation Index Two, MSAVI2 (Qi et al., 1994) MSAVI2 = 1/2 * [(2*(NIR+1)) - (((2*NIR)+1)
2 – 8
(NIR-red))1/2 ]
7. Optimized Soil Adjusted Vegetation Index, OSAVI (Rondeaux et al., 1996) OSAVI = ((NIR-red)/(NIR+red+L))*(1+L); L = 0.16 8. Normalized Difference Vegetation Index, NDVI (Rouse et al., 1973) NDVI = (band1-band2)/(band1+band2)
9. Normalized total Pigment to Chlorophyll Index, NPCI
(Riedell and Blackmer, 1999) NPCI = (R680-R430) / (R680+R430))
10. Ratio Vegetation Index, RVI (Jordan, 1969) RVI = band1/band2
11. Soil-Adjusted Vegetation Index, SAVI (Huete, 1988) SAVI = (1+L)* (band1-band2) /(band1+band2+L); L = 0.5 12. Structural Independent Pigment Index, SIPI (Penuelas and Inoue, 1999) SIPI = (R800-R450)(R800-R680)
13. Specific Leaf Area Vegetation Index, SLAVI (Lymburner et al., 2000) SLAVI = NIR/ (Red + MIR) 14. Visible Atmospherically Resistant Index, VARI (Gitelson, 2002) VARI = (green-red)/(green+red-blue) 15. Vegetation Index One, VI1 (Viña, 2002) VI1 = NIR/green -1
16. Vegetation Index Two, VI2 (Viña, 2002) VI2 = R800/R694 -1
17. Yellowness Index, YI (Adams et al., 1999) YI = (R580 – 2R630+R680)/∆2, ∆ = 50 nm
18. Water Band Index, WBI (Riedell and Blackmer, 1999) WBI = R950/R900 Table 2-2. Various vegetation indices compiled from literature
2.4 Factors influencing reflectance measurements
2.4.1 Viewing angleIt is well recognized that viewing angle affects on reflectance measurements.
Shibayama and Wiegand (1985) studied view azimuth and zenith effects on wheat canopy reflectance. They found that the ratio of off-nadir to nadir radiance increases or decreases as view zenith angle increases depending on view azimuth angle. Ranson et al. (1985) stated that position of the sensor relative to the sun was an important factor for determining the angular reflectance characteristics of crop canopies. Pinter et al. (1987) reported that off-nadir viewing significantly influenced spectral band ratios. Thus, the nadir is a very popular viewing angle selected for reflectance measurements across relevant literatures.
2.4.2 Solar angle
The effect of solar angle on reflectance measurements has been studied for many years. Shibayama and Wiegand (1985) observed that the rate of change in the radiance ratio increased with increasing solar zenith angle. Pinter et al. (1987) found that the NIR/red ratio of winter wheat was significantly influenced by changes in solar angles. They reported that the NIR/red ratio was highest in mid-morning and mid-afternoon, and lowest with the high solar position near midday. Lord (1988) studied the relationships between daily variations in sun angles and red and near infrared reflectance measured throughout a growing season over different types of crop canopies. It was found that for wheat canopies visible reflectance is roughly constant throughout the day and infrared reflectance increases when angle from solar azimuth increases. Therefore, reflectance measurements are often performed near the solar zenith (at noon) to decrease the effects
of solar angle on canopy reflectance (Asrar et al., 1985; Ranson et al., 1985; Serrano et al., 2000).
2.4.3 Soil background
It is well known that soil background has big impact on the measurement of canopy reflectance. This is especially evident at early stages of growth because the soil
constitutes a large portion of canopy reflectance. Thus, some vegetation indices such as NDVI are sensitive to soil background because ground cover affects red and NIR reflectance. Elvidge and Lyon (1985) found that the NIR and red based indices have pronounced soil background influences at low vegetation cover. Mickelson et al. (1998) reported that GVI(green vegetation index) values were much less influenced by soil background variation than NDVI. Huete et al. (1984 and 1985) found that spectral differences between soils may be closely associated with variations in surface moisture, particle size distribution, soil mineralogy, soil structure, and surface roughness. Different soils may have different impact on canopy reflectance. Dark, low-reflecting soils
influence vegetation indices less than high reflecting, light-colored soils (Jackson et al., 1983). Jackson et al. (1983) observed that there were little changes in soil reflectance ratios as soil moisture changed because a change in soil reflectance due to water concentration is about the same in the visible and near-infrared (NIR) regions of the spectrum. This fact shows soil moisture might not have a big effect on some derived vegetation indices.
2.4.4 Atmosphere
molecules in the atmosphere. Among absorbing molecules, water vapor has the biggest impact on the incoming solar spectrum (Gao and Goetz, 1990). Its absorption could extend the solar reflected region of the spectrum and varies both spatially and temporally (Goetz, 1992b). During reflectance measurements, if a reference panel is used and atmospheric conditions are unstable, variability of atmospheric water vapor between the time when the reference panel and target measurements are made may induce significant errors in the resultant spectrum Thus, Gao and Goetz (1992) pointed that it is important to minimize the length of time between the measurement of the reference panel and the target in order to reduce the error due to water vapor variability. Lord et al. (1985a) studied the possibility of using reflectance data collected under both cloudy and sunny conditions. They found that the reflectance measured under cloudy conditions with relatively constant irradiance values was constant and approximately 10% larger than the ones measured at similar sun angles during sunny conditions. This result indicated that it would be better to take all reflectance measurements under the similar cloud conditions to minimize the impact of atmosphere.
2.4.5 Wind
Wind can be a source of error if the material being measured moves during the time the reflectance is measured. Vegetation canopies are especially susceptible to wind induced errors, due to their large proportion of shadow (Analytical Spectral Devices, Inc., 2004). Lord et al. (1985b) did a study was to quantify and minimize the variability from wind on spectral reflectance. They found that within the windy and calm periods, extreme values of spectral reflectance differed by 60% and 12%, respectively, in the red, and by 40% and 8% in the far-red for the barley canopy. The plant canopy architecture, the wind
conditions, and the spectral regions all affected the magnitude of the influence of wind on crop canopy spectral reflectance.
2.5 Conclusions
Crop stress, such as nitrogen deficiency, water stress, plant disease, and ozone injury, can be detected using ground-based radiometry techniques at specific wavelengths using vegetation indices such as NDVI. NDVI is the most widely used vegetation index and some new spectral vegetation indices, such as YI, seem more promising in the near future. Different stresses on the same plants have been measured using different wavelengths or spectra. The most sensitive wavelengths used to calculate vegetation indices are crop-dependent. For different crops under the same stress, different wavelengths might be chosen for calculating vegetation indices. Ground-based sensors, such as radiometers, spectroradiometers and IRT, have been widely used to detect crop stress, such as water stress and plant diseases. There are a large number of vegetation indices that were used in crop stress detection. More research needs to be done to test their application for detecting greenbug-induced wheat stress.
Some progress has been made on the detection of greenbug infestation on crops because the spectroradiometer or IRT can be used to detect greenbug infestation with some limitations (Riedell and Blackmer, 1999; Michels et al, 1999). None of these studies, however, can be directly applied to detect greenbug infestation in the field without further testing. Sensitive band and vegetation indices to greenbug infestation at canopy levels need to be identified. Also, those sensitive bands and vegetation indices must have the capabilities to differentiate greenbug infestation with water stress and
infestation by Russian wheat aphid. In addition, sensitivities of sensitive band and vegetation indices at different growth stages have to be examined.
It is noted that very few stress studies involved continuous monitoring of canopy reflectance of plants under different stresses. Thus, it is difficult to identify the onset time at which there is significant difference in band reflectance/vegetation indices between stressed and control plants. However, this onset time is very necessary and important to determine the time to initiate greenbug control measures such as the use of pesticides. Continuous monitoring of canopy reflectance of wheat under greenbug infestation might help to provide sufficient information for decision-making.
In addition, since many factors such as viewing angle, soil and cloud cover have impacts on reflectance measurements, these factors have to be taken into consideration when designing and conducting reflectance measurements.