GEOGRAPHIES OF IDENTITY THEFT IN THE U.S.:
UNDERSTANDING SPATIAL AND DEMOGRAPHIC PATTERNS, 2002-2006
A Thesis by
GINA W. LANE
Submitted to the Office of Graduate Studies of Texas A&M University
in partial fulfillment of the requirements for the degree of MASTER OF SCIENCE
December 2008
GEOGRAPHIES OF IDENTITY THEFT IN THE U.S.:
UNDERSTANDING SPATIAL AND DEMOGRAPHIC PATTERNS, 2002-2006
A Thesis by
GINA W. LANE
Submitted to the Office of Graduate Studies of Texas A&M University
in partial fulfillment of the requirements for the degree of MASTER OF SCIENCE
Approved by:
Chair of Committee, Daniel Sui Committee Members, Robert Bednarz
Jim Olson Head of Department, Doug Sherman
December 2008
ABSTRACT
Geographies of Identity Theft in the U.S.:
Understanding Spatial and Demographic Patterns, 2002-2006. (December 2008)
Gina W. Lane, B.S., Texas A&M University Chair of Advisory Committee: Dr. Daniel Sui
Criminal justice researchers and crime geographers have long recognized the importance of understanding where crimes happen as well as to whom and by whom. Although past research often focused on violent crimes, calls for research into non-lethal white-collar crimes emerged in the 1970s. Today, identity theft is among the fastest growing white-collar crimes in the United States, although official recognition of it as a criminal act is a relatively recent development. Remaining largely unmet, the need for white-collar crime research has greatly intensified considering the escalating identity theft problem. Furthermore, many studies conclude that identity theft will continue to rise due to increasing technology-driven offenses via the Internet and widespread use of digital consumer databases. Utilizing theoretical framework established in crime
geography, GIS mapping and spatial statistics are employed to produce a spatial analysis of identity theft in the U.S. from 2002-2006.
Distinct regional variations, such as high rates in the western and southwestern states, and low rates in New England and the central plains states, are identified for identity theft as reported by the FTC. Significant spatial patterns of identity theft victims
alongside social demographic variables are also revealed in order to better understand the regional patterns that may indicate underlying social indicators contributing to identity theft. Potential social variables, such as race/ethnicity and urban-rural
populations, are shown to have similar patterns that may be directly associated with U.S. identity theft victims.
To date, no in-depth geographic studies exist on the geographic patterns of identity theft, although numerous existing studies attempt basic spatial pattern
recognition and propose the need for better spatial interpretation. This thesis is the first empirical study on the geographies of identity theft. It fills in a void in the literature by revealing significant geographical patterns of identity theft in the digital age, attempts at understanding the social factors driving the patterns, and examines some of the social implications of identity theft.
DEDICATION
To my daughters, Noelle and Michelle, for all that we have endured together, my parents, Wilmer and Lovelle Walterscheid, for their unconditional love and support
throughout the years,
Sarah Bednarz, for truly inspiring me towards higher education, and for my beloved husband, Mitch, who, in his sacrifice to our nation,
ACKNOWLEDGEMENTS
I want to kindly thank my committee chair, Dr. Daniel Sui, to whom I especially express gratitude for welcoming me as his student and offering exceptional guidance and advice throughout. It has been a true honor to work with him. I also thank my
committee members, Dr. Robert Bednarz, and Prof. Jim Olson, for their guidance, instruction, support, patience, and belief in my abilities throughout this research. I could not have succeeded without all of you. Your teachings brought me to where I am today.
Many thanks, also, to all of my friends and faculty at Texas A&M, who have welcomed and supported me throughout the years. Thank you, to everyone who offered support, advice, and friendship as a fellow student and friend. In particular, I graciously thank Nikki Williams and Adriana Martinez for their enduring friendship, support, and encouragement over the years. People like you make anything possible.
NOMENCLATURE
ESDA Exploratory spatial data analysis
FTC Federal Trade Commission
GIS Geographic information system
IDW Inverse distance weighting
LISA Local indicators of spatial association MAUP Modifiable areal unit problem
MSA Metropolitan statistical area
TABLE OF CONTENTS Page ABSTRACT ... iii DEDICATION... v ACKNOWLEDGEMENTS ... vi NOMENCLATURE ... vii
TABLE OF CONTENTS... viii
LIST OF FIGURES ... x
LIST OF TABLES... xi
1. INTRODUCTION ... 1
2. BACKGROUND AND LITERATURE REVIEW ... 5
2.1 Defining identity theft... 5
2.2 Crime geography and criminology literature ... 7
2.3 Identity theft and white-collar crime literature ... 11
2.3.1 Identity theft literature ... 11
2.3.2 Demographic observations in white-collar crime literature ... 16
2.3.3 Demographic observations in identity theft literature ... 19
3. DATA AND METHODOLOGY... 23
3.1 Data... 23
3.1.1 Data issues and challenges ... 24
3.1.2 Identity theft data ... 27
3.1.3 Demographic data ... 29
3.2 Methodology ... 30
3.2.1 Selection of significant demographic variables... 31
3.2.2 GIS mapping... 33
3.2.3 Spatial statistics analysis ... 35
Page
4.1 Results... 38
4.1.1 Identifying unique spatial and temporal patterns... 38
4.1.2 Exploring demographic factors that may shape regional patterns 43 4.2 Discussions... 47
4.2.1 Significance of the observed regional patterns of identity theft .. 47
4.2.2 Identity theft, terrorism, and homeland security... 51
5. SUMMARY, CONCLUSIONS, AND FUTURE STUDIES... 55
5.1 Summary ... 55 5.2 Conclusions ... 56 5.3 Future studies ... 57 REFERENCES ... 59 APPENDIX A ... 66 APPENDIX B... 68 VITA ... 72
LIST OF FIGURES
FIGURE Page
1 Rook vs. Queen Contiguity... 36
2 Comparison Maps of Identity Theft Per Capita Rates ... 39
3 Spatial Patterns of Some FTC Identity Theft Categories in 2002... 40
4 Spatial Patterns of Some FTC Identity Theft Categories in 2006... 41
5 LISA Spatial Statistics Cluster Maps, Using Per Capita Data... 43
6 Spatial Patterns of Some Demographic Variables ... 47
LIST OF TABLES
TABLE Page
1 Federal Trade Commission Annual Identity Theft Complaints ... 3
2 FTC Categories and Sub-Categories of Identity Theft... 7
3 Frequency of Identity Theft within Age Cohorts... 20
4 The Demography of Identity Theft in a Florida Metropolitan Area ... 21
5 Demographic Variables Correlated with Identity Theft Categories... 32
6 Known Uses of Identity Theft and Fraud by Terrorists ... 52
1. INTRODUCTION
It is every type of crime but with a component placing it in the digital environment. It is able to operate instantaneously, remotely, and with disregard for sovereignty and geography.
(Len Hynds 2003, pg. 4)
Identity theft disrupts the lives of thousands of people each year. Unfortunately, no one, either alive or deceased, is immune from the threat (O’Brien 2004, DPS 2008). Overall, identity theft has become one of the fastest growing crimes in the United States, and has been the top consumer complaint in the U.S. since the year 2000 (Computer Fraud & Security 2008; Welborn 2004). Furthermore, when considering the known links between identity theft, terrorism, and homeland security, the potential victims of identity theft may indirectly extend towards the entire U.S. population.
Despite the seemingly ubiquitous prevalence of identity theft in the digital age, distinct regional patterns exist, which this study further examines (Mulrean 2006). Historically, many crime studies rely on crime mapping and a social ecology approach towards explaining the local physical and social conditions at high crime hotspots. Generally speaking, place-based crime theories seek to identify the local conditions that facilitate the confluence of victims and offenders in time and space (Anselin et al 2000). Interestingly, regional variations and hotspots for identity theft also persist, even though identity theft is unique in that victim-offender relationships can be, and often are, geographically decoupled. This is possible because unlike traditional theft, identity ________
thieves often surreptitiously employ hi-tech technologies such as computers and the Internet to inflict damage on unsuspecting individuals. Although not all identity theft incidences occur via cyberspace, significant amounts do. Therefore, alongside many other changes brought about by onset of the digital age, cyber crimes, such as identity theft conducted over the Internet, have the potential to break down traditional spatial barriers for crime, such as locational opportunity and victim-offender proximity. This phenomenon is indicative of crimes conducted over the Internet, as traditional theft crimes are spatially dependent. Overall, cyber crimes (although not limited to identity theft) have the ability to transcend physical spatial limitations potentially creating virtually limitless and anonymous links between victims and offenders. Theoretically, cyberspace could eliminate the importance of place for crimes such as identity theft, yet the persistence of clear regional patterns indicates that place (e.g. local populations) remains important.
Regardless of the growing prevalence of identity theft, official recognition of it as a criminal act is a relatively recent development, and academic researchers have been slow to respond to the growing threat. In 1998, the federal government passed the Identity Theft and Assumption Deterrence Act (H.R.4151 and S.512, henceforth referred to as The Identity Theft Act), which officially defined and established identity theft as a criminal act punishable by law. The Identity Theft Act also established the Federal Trade Commission (FTC) as the lead agency to monitor, track, analyze complaints, and
(United States 105th Congress 1998). Since 2001, the FTC has logged increasing identity theft complaints, publishing the figures in annual clearinghouse reports (Table 1). By the year 2006, over 1 million complaints had been cumulatively logged (Conkey 2006).
Table 1: Federal Trade Commission Annual Identity Theft Complaints
Year Total Complaints Annual Change Percent
Change 2002 161,896 -- -- 2003 215,093 53,197 +32.85% 2004 246,570 31,477 +14.63% 2005 255,565 8,995 +3.65% 2006 246,035 -9,530 -3.73%
Although scholarly publications regarding identity theft are limited, much of the literature that exists comes from governmental studies, criminological research, or popular media (Cheney 2003; FTC 2003; Mulrean 2006; Newman & McNally 2005; Synovate 2003). To date, no known spatial identity theft studies have been published in any geographic journals, although publications from other disciplines and in the popular media often exhibit geographic observations, attempt some degree of spatial
interpretation, or propose the need for better spatial analysis. For example, Mulrean (2006) states that identity theft is typically more urban than rural, has regionally high per-capita levels in the southwestern United States and low per-capita levels in the Central Plains, and may be affected by age. Newman and McNally (2005) observe that
identity theft rates vary internationally, and call for additional research into the
geographic and demographic trends that are outlined by the FTC and Synovate Reports (2003). Allison et al (2005) call for additional research to determine whether the demographic findings in their study are localized or nationally representative. This thesis, therefore, fits well into the literature as a response to these calls for taking a more explicitly geographic perspective on identity theft research. This information is vital in formulating generalizations that may aid in determining effective strategies to address the growing identity theft problem at broader levels.
This thesis fills a void in the literature by advancing our understanding of
significant geographical patterns of identity theft in the digital age. The specific goals of this research are:
1) Identify unique spatial and temporal patterns of identity theft in the U.S.;
2) Explore the social and demographic factors that may shape the regional patterns of identity theft in the U.S.;
3) Discuss the social implications of identity theft and its relationship towards terrorism and homeland security.
This thesis explores the geographic frontiers unique to identity theft, and will also establish identity theft spatial inquiry within geographic crime and identity theft
literature. Furthermore, the findings of this study will provide a basis from which further analysis into the social factors of identity theft can be explored, and facilitate effective policies of fighting and preventing this prevalent white-collar crime in the digital age.
2. BACKGROUND AND LITERATURE REVIEW
2.1. Defining identity theft
What exactly is identity theft? Many have attempted to address this essential question, and as a result, there are numerous attempts at defining what is (and is not) identity theft. Researchers generally agree that identity theft involves the fraudulent misuse of personal information for illegal activity and unauthorized personal gain, but some debate exists on where to ‘draw the line’ on what constitutes identity theft. For example, Cheney (2003) argues that the simple use of a person’s bank or credit card account for unauthorized transactions should not be considered identity theft, but rather should be considered the simpler crime of payment fraud. In another more
unconventional interpretation of the problem, Caeton (2007) presents the bold argument that identity theft is not the victim-offender phenomenon popularized in the media. Rather, he posits that identity theft is actually a cultural myth, created by the politics of fear, in which the long-standing white-collar crime of fraud has been bureaucratically re-codified as victim-offender ‘identity theft’ in order to shift the blame away from a lack of systematic safeguarding of personal data, which would solve the so-called identity theft problem. Although extreme, Caeton does exemplify the wide range of defining views regarding the position of identity theft as a stand-alone crime.
For the purpose of this research, however, the crime of identity theft is assumed to be real and prosecutable (Hynds, 2003), and the definitions established by federal law will
be used to ensure consistent and proper analysis of the FTC data. According to the Identity Theft Act:
[Identity theft occurs when someone] knowingly transfers or uses,
without lawful authority, a means of identification of another person with the intent to commit, or to aid or abet, any unlawful activity that
constitutes a violation of Federal law, or that constitutes a felony under any applicable State or local law (United States 105th Congress 1998, p. 2-3).
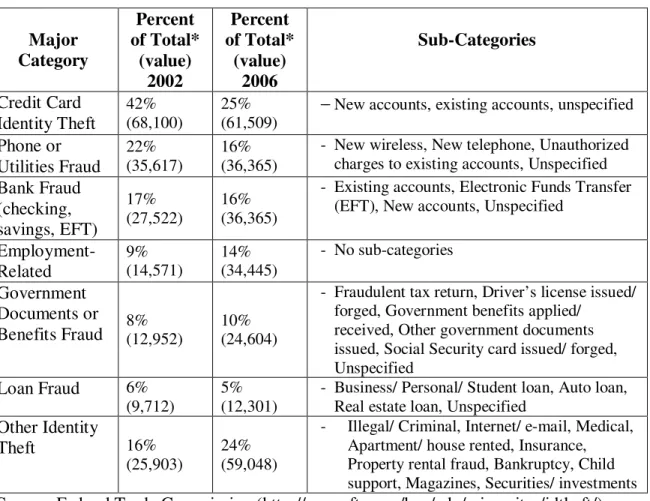
Table 2 lists the officially recognized FTC categories and sub-categories. The FTC data makes no distinction within the categories or sub-categories regarding the severity of the incidences or type of personal information that was used. Additionally, the sum of category complaint percentages may exceed 100% (thus also exceeding the number of actual victim complaints) due to some reports logging multiple categories of damages per incidence; however, each victim is only counted once per complaint, regardless of how many categories that were involved, thus providing an accurate overall victim complaint count. It is within this framework of the Identity Theft Act definition and the subsequent development of the categorized FTC database, that I conduct this research (Table 2).
Table 2: FTC Categories and Sub-Categories of Identity Theft Major Category Percent of Total* (value) 2002 Percent of Total* (value) 2006 Sub-Categories Credit Card Identity Theft 42% (68,100) 25% (61,509)
−New accounts, existing accounts, unspecified
Phone or Utilities Fraud 22% (35,617) 16% (36,365)
- New wireless, New telephone, Unauthorized
charges to existing accounts, Unspecified
Bank Fraud (checking, savings, EFT) 17% (27,522) 16% (36,365)
- Existing accounts, Electronic Funds Transfer
(EFT), New accounts, Unspecified
Employment-Related 9% (14,571) 14% (34,445) - No sub-categories Government Documents or Benefits Fraud 8% (12,952) 10% (24,604)
- Fraudulent tax return, Driver’s license issued/
forged, Government benefits applied/ received, Other government documents issued, Social Security card issued/ forged, Unspecified
Loan Fraud 6% (9,712)
5% (12,301)
- Business/ Personal/ Student loan, Auto loan,
Real estate loan, Unspecified
Other Identity
Theft 16%
(25,903)
24% (59,048)
- Illegal/ Criminal, Internet/ e-mail, Medical,
Apartment/ house rented, Insurance, Property rental fraud, Bankruptcy, Child support, Magazines, Securities/ investments
Source: Federal Trade Commission (http://www.ftc.gov/bcp/edu/microsites/idtheft/) *Percentage sums exceed 100 due to individuals reporting multiple victimizations
2.2. Crime geography and criminology literature
Criminologists and geographers alike have long realized that understanding where crime happens is key to understanding why crime happens and to whom (Christens & Speer 2005; Roncek 1993). Therefore, criminal justice researchers and geographers have understood the analytical and predictive roles of crime mapping (Anselin et. al 2000; Harries 1974, 1999; Lottier 1938a, 1938b; Shannon 1954). In general, geographic crime studies and crime mapping seek to accomplish three main goals: description,
analysis, and prediction (Harries 1974). The main goal of descriptive mapping is to identify patterns, trends, and facts from the data. Initial assessment of the data via GIS mapping and analytical methods, often called exploratory spatial data analysis (ESDA), is the first step in geographic crime study, and is the main goal of this research. Second, analytical mapping accomplishes the goal of hypothesis testing in order to develop a base from which predictions are made. It is the theoretical bridge between description and prediction mapping. A secondary goal of this research is to establish enough geographic links between identity theft and demographic patterns to allow for future hypothesis formulation for further study in order to accomplish the ultimate goal of prediction, which is likely the most valuable product from a successful geographic crime study or model (Harries 1974).
Historically, crime geography theory has passed through several major periods. The earliest studies, mainly conducted in the 19th century, were mostly environmentally deterministic (Anselin 2000; Cohen 1941; Harries 1974). Geographers attempted to explain observable seasonal and regional crime patterns through variations in the physical environment, such as climate, topography, or latitude. Critics soon emerged, and after the turn of the 20th century, the era of environmental determinists waned. In its place emerged the social theorists, largely originating from the Chicago School.
Early social theorists incorporated the role of human conditions, such as urban environments, distance decay, and population characteristics, to explain local crime patterns (Cohen 1941). In general, social human phenomena were used to provide an ecological explanation of crime patterns by linking existent local conditions to
observable spatial patterns (Harries 1974; Cohen 1941). Later, detailed regional studies emerged which not only incorporated social conditions, but particularly emphasized regional spatial patterns of crime at multiple scales (Lottier 1938a, 1938b; Shannon 1954). Eventually, more radical geographic studies incorporated complex social science theories, such as the impact of social control systems, into geographic crime patterns (Lowman 1986). However, some debate exists on the effectiveness of applying social theory in crime study. Critics posit that it offers little new insight into violent crimes (Harries 1986) and does not explain differential responses (Herbert 1982). For example, if social factors such as race, income, or family structure, are determined to cause
criminal behavior, why are not all people with these characteristics criminals? According to Herbert (1982), this is a major shortcoming of using social theory in geographic crime studies.
Regardless, a renewed interest in spatial crime study based on social theory is currently underway. Anselin et al (2000) largely attributes the renewal to recent analytical and technological improvements. Better computing capabilities, powerful geographic information systems (GIS), and specialized spatial tools enable researchers to analyze large databases that were previously unmanageable, and reemphasize the
importance of place-based crime studies. As a result, Anselin et al (2000) states that geographic crime study is “… currently in the midst of a Chicago School
revival…Though not causally related, recent developments of widely accessible
in popularity of ecological explanations of crime” (p. 218). This thesis, therefore, will contribute towards this emerging body of renewed spatial crime analysis.
Throughout the evolving theoretical eras, most geographic crime research has focused on violent crimes (Christens and Speer 2005; Harries 1988; Snook et al 2005), with an emphasis on determining either treatment or causation (Herbert 1982).
Treatment research is usually an empirical criminology approach whereby mitigation strategies or actions are applied and analyzed for effectiveness through observed changes in the targeted criminal activity. Causation research, however, is much more ambiguous, and attempts to identify characteristics and causes of criminal activity from data
collected from known offenders, victims, and criminal behavior patterns. Herbert (1982) definitively states that researchers should keep offender and offense pattern analysis separate, and that analysis of offenses (e.g. victims) is particularly suited for geographic study (pp. 44, 101). This is because offense patterns lend themselves largely to local conditions facilitating vulnerable environments, opportunities for crime, access routes, and criminal methods, thus allowing for spatial insight towards broader societal problems that facilitate the formation of vulnerable populations. In other words, knowing where a certain crime is occurring is clue to discovering underlying social indicators facilitating the criminal behavior.
Despite that violent crime studies have dominated past research, calls for better spatial research into non-lethal white-collar crimes emerged as early as the 1970s (Peet 1975; Herbert 1982). Remaining largely unmet since then, the need for white-collar crime research has greatly intensified considering the escalating identity theft problem
(FTC 2007). The FTC data indicates that identity theft overall is steadily increasing; however, critics argue that increased public awareness is attributable to the rise in reporting frequency due to improved legislation, consumer education, and improved law enforcement reporting practices (Stana 2004). Although this may partially explain the longitudinal increase in reports, Allison et al (2005) acknowledged this possibility and found substantial evidence that “… suggested an increasing trend for identity theft cases relative to other types of theft offenses” (p. 24). Furthermore, many studies conclude that identity theft will likely continue to rise due to increasing technology-driven offenses via the Internet and illegal data mining of digital databases containing
consumers’ personal information (Cheney 2003; Liu, et al 2005; Norum and Weagley 2007; Slosarik 2002). Clearly, the need for research into the geographic trends and underlying driving mechanisms of identity theft are overdue.
2.3. Identity theft and white-collar crime literature 2.3.1. Identity theft literature
Identity theft is “[t]he quintessential crime of the information age…” (Kahn and Roberds 2008, p. 251). Increasing use of electronic transactions, over the Internet and through the direct use of credit and debit cards, generates millions of opportunities every day and has vastly increased the risk for breach and misuse of personal information by identity thieves (Anderson 2006). As a result, consumer reports of identity theft have increased dramatically, bringing much attention to the problem by the media,
government agencies, and general public. Until Slosarik (2002) published an overview, thus establishing identity theft as topic for academic research, scholarly publications
specific to identity theft were virtually non-existent. Since then, a growing body of identity theft literature has emerged, which includes (but is not limited to) offender and victim trends and demography (Allison et al 2005; Anderson 2006), systemic enabling factors and solutions (Bourne & Deaton 2004; LoPucki 2002; Willox and Regan 2002), preventative and protection efforts (Milne 2003; Milne et al 2004; Norum and Weagley 2007), financial system and consumer impacts (Cheney 2003), regional and behavioral patterns (Mulrean 2006), computer modelling (Kahn and Roberds 2008), and legislative efforts (Holt 2004; Moye 2006; Saunders & Zucker 1999). This thesis will contribute the first known empirically geographic study of identity theft to the growing body of identity theft literature.
Although many agree that the recent widespread growth of identity theft has been largely “E-enabled” (Pemble 2008, p. 7) by the advance of the digital age, identity theft itself is not new (Pemble 2008; Caslon Analytics 2008; Caeton 2007; Friedrichs 2007). History is riddled with accounts of identity imposters whereby individuals fraudulently assumed the literal identity of another for personal gain. What has changed, however, are the available methods used to commit the offense. Technological advances such as the Internet and computers have drastically increased the ease and efficiency by which offenders illegally obtain personal information (Slosarik 2002; Norum and Weagley 2006; Pemble 2006). Identity thieves digitally reach beyond political boundaries,
bypassing security measures in place to thwart illegal movements of people, information, and goods. These technological abilities contribute to the increase in identity theft, and are the enabling mechanisms for the decoupling of victims and offenders. No longer is it
necessary for an individual to literally assume the living identity of, or be in contact with, another person in order to benefit from the assumption of personal information.
A person’s identity involves social and personal associations such as nationality, ethnicity, gender, race, age, and socioeconomic status. Identity is also a legal issue. Legal identity is delineated by official documents, paperwork, activity files, etc. and is essentially unalterable. Legal identity takes precedence over social identity in the courts and is virtually inescapable, such as a criminal record or credit history. It is the targeting of the legal identity, increasingly becoming digitally obtainable, which enables identity theft activity (Finch 2003).
Identity theft involves the fraudulent use of base identifiers: birth name, race, birth date, etc. Base identifiers remain unchanged over an individual’s lifetime.
Secondary identifiers, such as drivers’ licenses, passports, visas, and green cards rely on base identifiers to connect to the individual. As the population has increased, base identifiers have become insufficient in uniquely identifying all individuals. Therefore, numerical identifiers were introduced as a means to uniquely classify individuals in large populations. In the U.S., the social security number (SSN) is the most important and ubiquitous numerical identifier. Although the initial intent of the SSN was not as a universal identifier, the current amount of personal information associated with it makes it the “linchpin in advancing identity theft” (May and Headley 2004, p. 13). Since all legal citizens in the U.S. have these numerical identifiers, yet identity theft does not appear to target victims randomly, a better understanding of the characteristics those experiencing higher rates is needed.
In general, offenders are known to utilize a wide array of techniques to illegally obtain personal information about their victims. Traditional, low-technology methods continue to persist and include mail fraud, ‘dumpster diving’ (retrieving discarded documents), stolen wallets/purses, and obtaining information through personal contacts (known as social engineering) (Javelin Strategy & Research 2006). High-technology methods using computers and the Internet (e.g. scams, malicious spyware, and illegal ‘data mining’ of digital databases, etc), have greatly expanded the ability for identity thieves to remotely access personal information (Allison et al 2005; Cheney 2003; Furnell 2007; Slosarik 2002), and are widely believed as the vehicles enabling the recent explosion of identity theft. In sum, the Internet has increased the speed, ease, and efficiency of identity theft. As the opportunity for high-technology offenses is expected to increase, the more tedious, low-technology methods are likely to become less
appealing.
Although identity theft is largely motivated by pecuniary want, the damages victims experience are both financial and non-monetary, such as false arrests, social denunciation, collection agency harassment, credit denials, and loan refusals (Kreuter 2003; Newman & McNally 2005; Slosarik 2002), not to mention time lost correcting the damage, and personal distress (Furnell 2007). Like many crimes, actual measurement of the extent of identity theft is difficult due to suspected low rates of reporting and the tendency for identity theft incidents to be multi-faceted, which may result in multiple reports per victim (FTC 2003; Hayward 2004; Newman & McNally 2005; Stana 2004). Besides financial motivation, there are other known motivating factors. Some identity
thieves have been known to desire a ‘fresh start’ from an undesirable past. Others are seeking alternative identities in order to clandestinely engage in illegal activity (Finch 2003). This last motivating factor is particularly important in understanding the role which identity theft plays in terrorism, a topic that will be discussed at length below (Sullivan 2004; Collins 2006; Willox & Regan 2002).
Better understanding of identity theft is critical in order to thwart the continued growth of the crime. Identity theft is expected to increase into the unforeseeable future largely because of a plethora of existing electronic databases that contain vital personal information. Many of these databases do not have adequate security for protection against either internal or external data thieves. International and inter-jurisdictional outsourcing of jobs also potentially increases the security threat (O’Brien 2004), and the tendency for identity theft to occur inter-jurisdictionally and in conjunction with other crimes often prevents the ability for lawmakers to specifically target it. The resulting low prosecution and clearance rates, coupled with lenient sentencing, have created an environment conducive to rampant identity theft (Collins 2006). In 2000, only one in 700 identity theft crimes were prosecuted, meaning that the potential rewards are very high while the risk remains incredibly low (Sullivan 2004). Since clearance rates are not rising at the same rate that reports of identity theft are, this figure is expected to worsen.
It is obvious that identity theft is a very real and rapidly expanding problem in the digital age. The broad range of disciplines producing studies and publications is indicative of its pervasive nature and broad extent, and clearly points toward the benefits of additional spatial and demographic inquiry.
2.3.2. Demographic observations in white-collar crime literature
The identification of demographic associations are commonplace in many white-collar crime studies in general, and identity theft studies in particular (Acohido 2007; Allison et al 2004; Anderson 2006; Ganzini et al 2001; Newman and McNally 2005; Synovate 2003; Weicher 2007; Willox and Regan 2002). Demographic variables of both victims and offenders exist in the literature, although it is unknown whether victim and offender patterns are related. Therefore, demographic subsets suggested in the literature for both victims and offenders are utilized in building the demographic database for this study, as known offender characteristics may indicate linked victim population subsets.
Because the majority of identity theft incidences are considered white-collar crimes, a review of white-collar crime literature is important and offers helpful insight towards a better understanding of identity theft in particular. The term ‘white-collar crime,’ first coined by Edwin Sutherland (1940), was initially defined by the social class of the criminals themselves. Challenging dominant philosophy, Sutherland proposed that criminal activity is not caused by poverty or the social woes of the lower classes, but exists among members of all social strata, including the middle and upper classes. Sutherland proposed a distinction between “…crime in the upper or white-collar class, composed of respectable or at least respected business and professional men, and crime in the lower class, composed of persons of low socioeconomic status” (1940, p. 1), and introduced the concept of non-violent, largely financial offenses to scholarly social and criminological research.
Since Sutherland’s introductory research, a concise definition of white-collar crime has proven elusive, but modern definitions focus not only on the social class of the offender, but also on the nature of the crime itself. Generally, white-collar crimes occur within a legitimate occupational environment, are economically motivated, and do not involve physical violence (Friedrich 2007). The majority of identity theft offenses certainly meet these criteria. Therefore, identity theft is considered a white-collar crime, although not all white-collar crimes involve identity theft.
Unfortunately, research into white-collar offender demographics has been hindered by a lack of comprehensive data. Low prosecution and conviction rates, coupled with low reporting rates of white-collar crimes by both victims and law
enforcement, have resulted in a virtual dearth of comprehensive data (Croall 2001). The available data is largely based on known offenders and consumer reports, may be
affected by prosecution, judicial, and law enforcement biases, and is consequently not randomly generated. For example, Green (1993) suggests that offender clearance rates for embezzlement may be affected by demographic factors of age, gender, and race.
Regardless of data shortcomings, researchers have revealed some demographic trends for white-collar criminals. Known characteristics of white-collar criminals differ from conventional ‘street’ and violent criminals. White-collar criminals are usually older, rarely have prior arrests, and are often highly educated. White-collar criminals are often members of higher socioeconomic groups, thus introducing social stratification associations (Friedrichs 2007). Although offenders are less likely to be drug addicts than street criminals, researchers recognize that drug addiction may increase the
likelihood of financially motivated crimes and identity theft (Croall 2001; NDIC 2007; Payne 2003).
Although a significant number of offenders are male members of ‘elite’ social classes, they do not comprise the entirety. Many are middle class females and are often employed in lower-level clerical positions. For example, bank embezzlers tend to be younger, female, and living in stable home environments (Croall 2001). Although the criminal male typecast persists, in reality more women commit fraud than men, and researchers have found that women are more likely than men to be motivated by personal reasons such as financial need (Croall 2001).
White-collar criminals also have different age and racial profiles than
conventional criminals (Croall 2001, Friedrich 2007). White-collar criminals are usually older with racial profiles similar to the general population. White offenders tend to be from higher socioeconomic groups, while black offenders are more often from lower socioeconomic groups. Most attribute the socioeconomic differences largely to
employment discrimination. Regarding the age of offenders, one U.S. study revealed the average age of all white-collar offenders to be forty years; however, mail fraud and embezzlement offenders tended to be younger (Croall 2001). It is possible then, that identity thieves may be slightly younger than other white-collar criminals.
Despite the fact that many white-collar offenses go unreported, victim data is more comprehensive than offender data. From existing data, researchers have
discovered that different white-collar crimes are known to target specific groups. For example, women have historically been victimized by financial fraud due to presumed
assumptions that women are not as knowledgeable about finance and investing as are men. Additionally, older cohorts have been targeted by financial fraud, largely because older citizens often have higher incomes and greater wealth, thus making them attractive targets (Croall 2001, p. 74). There is some concern that victim reporting may be biased towards higher educated individuals due to the fact that they are more likely to possess the knowledge and resources to report and prosecute the offense. Regardless, white-collar crime victims appear to be a population subset with identifiable demographic characteristics, which provides the basis for the creation of the demographic database for this thesis.
2.3.3. Demographic observations in identity theft literature
Identity theft is not an equal opportunity crime. Although the FTC clearinghouse reports reveal some associations between identity theft complaints and demographic trends, this thesis seeks to further investigate demographic links to identity theft. The literature suggests an abundance of demographic observations warranting further examination. For example, general trends in identity theft are known such as urban propensity, exceptionally low clearance rates, and localized demographic characteristics such as gender, age, and race (Allison et al 2005). Social indices such as level of
urbanization, socio-economic status, and family structure have been identified as
potentially related factors for criminal behavior in general (Glaeser and Sacerdote 1999). Studies have shown that some age groups are higher risk for identity theft (Table 3):1
1
These figures are approximate and may vary slightly depending on the data year. Other researchers have revealed similar figures for different years, e.g. May and Headley 2004.
Table 3: Frequency of Identity Theft within Age Cohorts
Age Group Percent of Victims Percent of Total Pop Representation
0-17 2 % 26.4 Under 18-29 26 % 15.8 Over 30-39 28 % 15.4% Over 40-49 22 % 15.1% Over 50-59 13% 11% Over 60+ 9% 16.3% Under
Sources: Stana 2004; U.S. Census Bureau, decennial census data 2000
College students have also been targets of identity theft because of widespread institutional use of social security numbers, plus students with clean credit records are often targeted by credit companies, and young students may be relatively naïve regarding financial decision-making (Weicher 2007). Certain occupations have also been found to carry a higher risk for identity theft. High-paying professions such as physicians and celebrities have been targeted, as well as professions that offer personal information more easily such as university professors and government employees (May and Headley 2004). Case studies of particular incidents illustrate this well. For
example, Abraham Abdallah, 32, stole the identities of over 200 celebrities listed in the “Forbes 400,” eventually accessing potential billions of dollars before being caught in 2001. In 2002, Linus Baptiste, 43, co-conspired with Philip Cummings, 32, to steal the identities of 33,000 victims by obtaining user names and passwords through employment at a credit-checking communications company. In 1998, Anthony Lamar Taylor, 30,
successfully posed as golf superstar Tiger Woods for a year before getting caught (Sullivan 2004).
Some studies specifically examine the demographics associated with identity theft (Table 4). Allison et al (2005) examined the demographic trends of both victim and offenders in a particular Florida metropolitan area with intriguing results:
Table 4: The Demography of Identity Theft in a Florida Metropolitan Area
Demographic
Variable Victims Offenders
White 72% 27% Black 20% 69% Hispanic 1% 1% Asian 6% 1% Female 46% 63% Male 54% 37% Mean Ages 40.56 32.23
The Hispanic population was especially recognized as underrepresented because 19-percent of the metro area population is Hispanic, yet there was a negligible Hispanic representation (only 1-percent of both victims and offenders) in the identity theft data. Whites were overrepresented as victims (72-percent), and blacks were overrepresented as offenders (69-percent) in this study. Lastly, the study also revealed that 53-percent of the offenders were unemployed, 3-percent retired, and another 3-percent were disabled. This suggests economic gain as a motivator for identity theft. (Allison et al 2005).
Anderson (2006) suggests that demographic variables (e.g. income and education level) are viable proxies to test for populations vulnerable to identity theft, such as the hypothesis that people who conduct more non-cash transactions and utilize numerous accounts are more at risk for identity theft. Anderson also suggests that single heads of households and households with children may also be more vulnerable. This is based on the idea that couples have double the eyes and attention to discover identity theft, and children create additional transactions, each of which, although minute, poses a new opportunity for a breach of personal information. Using probit regression, Anderson concluded that families with three or more children had a significantly higher risk for identity theft. Other social groups suggested in the literature as potential high-risk groups for identity theft include people living in close group quarters such as students (Newman and McNally 2005; Norum and Weagley 2007; Weicher 2007) and military members, (Acohido 2007; Newman and McNally 2005), medical patients (Ingram 2006), and even the deceased (CIFAS 2004; DPS 2008; O’Brien 2004).
In sum, victims of identity theft are members of a population subset which may be partly determined by certain underlying geographic and/or demographic characteristics. By identifying which demographic characteristics may be disproportionately associated with identity theft, researchers may be able to predetermine those most at risk. This may lead to potentially revealing more complex associations and insight beyond that of statistical and exploratory data analysis (EDA).
3. DATA AND METHODOLOGY
3.1. Data
This research is conducted with data from two primary sources: 1) Identity theft data from the FTC
2) Demographic data from the U.S. Census Bureau
The Federal Trade Commission releases annual identity theft clearinghouse reports (available from:
http://www.ftc.gov/bcp/edu/microsites/idtheft/reference-desk/index.html). The majority of complaints are logged via direct consumer input to the FTC, however other organizations also contribute, including the U.S. Postal
Inspection Service, Internet Crime Complaint Center (www.ic3.gov), plus others (FTC 2004, 2005). Preliminary examination of the data revealed visible regional variations, thus prompting the need for an in-depth spatial analysis to determine whether the visible patterns can be significantly explained through exploratory spatial data analysis (ESDA) and statistical analysis.
Demographic data was mostly obtained from the U.S. Census bureau website. The census data was acquired directly from the American Factfinder (factfinder.census.gov), and population estimates (www.census.gov/popest/estimates). Whenever possible, the demographic data was obtained for the corresponding year of FTC data; however, when estimates are not available, Census 2000 data was used.
The FTC identity theft data are aggregate, and the FTC clearinghouse releases identity theft figures at national, state, and MSA scaled levels. Because this study
analyzes the state-level identity theft data, the demographic data was amassed at the corresponding state-level scale.
3.1.1 Data issues and challenges
Because the data is aggregate, it is imperative to acknowledge potentially related problems. Certain challenges and concerns are endemic to aggregate data, and can be particularly troublesome for spatial analysis. First, aggregate data is secondary, meaning that it has undergone some processing of the raw data beforehand (Rafanelli et al 1996). The algorithms used in the pre-processing of the data is often unknown (i.e. the data sets are released without metadata), and it is possible that the methods used to create spatial aggregations (such as statewide counts, sums, averages, categorizations, etc), may affect the final aggregate values.
In regards to the spatial analysis of aggregate data, perhaps the greatest concerns stem from the Modifiable Areal Unit Problem (MAUP) (Openshaw & Taylor 1982). The MAUP exists because geographic space can be divided into potentially infinite arbitrary units. Since geographical space is continuous, the analysis of data collected within that space can be greatly affected by the scales and/or zones of the data
aggregation (Openshaw & Taylor 1982), which can potentially be manipulated by the analyst in order to produce favorable outcomes (Anselin 2006). Data aggregated by political units, such as the statewide FTC data, is confined to a priori boundaries, which cannot be manipulated by the analyst, but it is unlikely that these boundaries will have any direct relationship to the spatial phenomenon being observed.
For example, a spatial study conducted by a private industry fraud detection service, ID Analytics (2007a), illustrates the effects of the MAUP well. Using credit application data and fraud detection models, ID Analytics determined rates of
application fraud, thus producing a geography of offenders rather than victims. When analyzing the fraud rates at the statewide level, the results were very similar to the FTC victim patterns. States with high rates of fraudulent applications included the western states of WA, OR, CA, NV, AZ and TX, plus NY, IL, and MI. States with very low rates of fraudulent applications included the upper New England states of ME, NH, VT and the northern plains states of ID, MT, WY, SD, and IA. However, when analyzing the same raw data at smaller scales, (the 3- and 5-digit zip code levels) the results were quite different. As the scale becomes smaller, strong regional patterns became much less prevalent, to the point where at the smallest scale 5-digit zip code level, contradictory findings emerged. At the 5-digit zip code level, high fraudulent application rates
originated from states that were considered overwhelmingly low overall. In fact, the zip code with the second highest fraud risk in the U.S. from 2003-2006 was in South
Dakota, a state which is considered consistently low in identity theft risk. A second ID Analytics (2007b) report identifies the top ten 5-digit zip codes with the highest identity fraud increases in 2006. Six were in Montana, and three were in North Dakota, (also recognized in other studies as low-risk states), again showing that small-scale analysis of the same data can yield very different results than coarse scale. It is unknown if similar spatial trends could be found with the FTC identity theft data, as the FTC does not release it at selectable scales such as the Census Bureau.
Understanding the MAUP leads into another problem inherent to aggregate data: the ecological fallacy. The ecological fallacy problem states that “…conclusions
obtained at aggregate levels do not translate to meaningful behavioral interpretations at the micro scale” (Anselin 2006, p. 4). Researchers have long recognized problems in assuming characteristics of the individual from aggregated data of larger populations, and for this reason, the findings from this thesis cannot be used to infer information about small populations or individuals.
Certain problems inherently exist with most crime databases as well (Harries 1974; Herbert 1982). For example, recall that under-reporting and misreporting (by
individuals, victims, or authorities) are concerns for the data being under-representative of the true extent of identity theft. Also, differences in attitudes and classification methods across jurisdictions and/or agencies could affect the data, and could also impart spatial irregularities if these classification differences vary regionally. There also exists concern that changes in reporting practices, public awareness, and legislation could affect data collection, particularly data that is amassed temporally as in the FTC
Consumer Sentinel. Despite these challenges, official aggregated data, such as the FTC clearinghouse, is the only known data source publicly available, leaving no viable alternatives.
Regardless of the limitations of aggregate data, the FTC data is considered the most comprehensive identity theft data in existence (Newman & McNally 2005). To date no known comprehensive database of identity theft incidences with demographic data exists; therefore, aggregate data must be utilized, largely due to a dearth of
non-aggregated data and the difficulty or impossibility in obtaining such data. Regardless, the significant correlations revealed by this study between demographic groups and known identity theft incidences may provide opportunities for additional research or case studies to explore more specific associations.
3.1.2 Identity theft data
As per the requirements of the Identity Theft Act (United States 105th Congress 1998), the FTC established the Identity Theft Clearinghouse, and in 1999 began to amass consumer complaints into a large centralized database called Consumer Sentinel (FTC 2003). The majority of complaints are logged via direct consumer contacts with the FTC, however numerous other agencies also contribute (FTC 2003, 2004, 2005). The FTC then categorizes the data by different types and subtypes, separating identity theft related fraud from other types of fraud, and annually releasing the figures to the public via clearinghouse reports, which are available from the www.ftc.gov identity theft reference desk.
It is important to note that data included in the FTC identity theft categories and sub-categories, such as credit card, phone utilities, and bank fraud are amassed separately from fraud incidences that do not involve the misuse of personal information. For example, Consumer Sentinel logged in excess of 635,000 complaints in 2004, 39-percent of which were fraud by identity theft, with the remaining 61-percent being non-identity theft fraud complaints. In sum, not all fraud complaints involve the misuse of personal information, and are not included in the identity theft database; however, the FTC uses
the term “fraud” interchangeably within the identity theft and non-identity theft data, thus potentially causing some confusion in the category definitions.
Although the FTC data is the most complete central repository of identity theft data currently in existence, it is still believed to be under-representative of the true scope of identity theft incidences, and may have some reporting errors due to multiple-agency contributions (for example, if a consumer contacts multiple agencies, thus generating multiple counts per incident) (Newman &McNally 2005). Despite that the FTC data does not represent the actual scope of the identity theft problem2, researchers conclude that it is substantial for spatial analysis and the identification of geographic trends (Allison et al. 2003). To date, truly representative data are lacking due to a combination of hurdles. A lack of coordinated interagency cooperation exists, and white-collar crimes (identity theft in particular), are beset by low reporting and clearance rates, thus hindering capture of all incidences and posing difficulties in the creation of unbiased, comprehensive datasets (Allison et al 2005; Newman & McNally 2005; Slosarik 2002).
The aggregated identity theft database for this project was created by harvesting the annual figures from the FTC clearinghouse reports. Unfortunately, the report formats are not consistent, thus requiring some data extraction for 2002, 2005, and 2006. For these years, individual state data were released as linked state maps, whereby the data was obtained by manually selecting each state individually from the online base map.
2
Realizing that the scope of identity theft is likely much higher than the complaints logged by the Consumer Sentinel, the FTC commissioned Synovate, (a global market research firm under Aegis Group) to conduct a nationwide poll to determine a more accurate extent of identity theft. From this study, annual incidences of identity theft in the U.S. are estimated at over 9 million (Synovate 2003).
From 2002 through 2004, the state data and identity theft categories were reported as actual victim counts. However, for 2005 and 2006, the data was released as state victim totals with category percentages. Therefore, the derivations of actual victim counts by category for each state were calculated by multiplying the identity theft category percentages by the total victim counts. For example, in 2005, Arizona logged 9,320 victims, with 26-percent reporting credit card theft, or 2423.2 victims for the credit card category. Since the existence of a fraction of a victim is not feasible, the derived counts are rounded up to the next integer, thus introducing the existence of a small rounding error for the 2005 and 2006 data. Cumulatively, the rounding error is slight and is unlikely to affect the analysis results.
The final database encompasses annual FTC identity theft data from 2002 through 2006, reported as state-level figures broken down by FTC category (Table 2).
3.1.3 Demographic data
The demographic variables (or proxies) suggested in the identity theft literature acted as guidelines for the selection of potential demographic variables for this study (Appendix 2) from which an extensive database was built using data obtained from the U.S. Census Bureau and Progressive Policy Institute (PPI) (www.ppionline.org). The majority of demographic data for this study was obtained through the U.S. Census Bureau (http://www.census.gov/). Whenever possible, Census population estimates for the demographic variables are obtained to better correlate with the identity theft
reporting years. However, the Census Bureau does not produce estimates for all
Index scores (DigEcon) and online population (OnlinPop) were obtained from the Progressive Policy Institute (PPI), a governmental non-profit research and education organization that produces a State New Economy Index as a means of calculating U.S. states’ progression towards a digital economy (PPI online). The Digital Economy variables were obtained based on the literature which states that the Internet is a key element in the rise in identity theft.
3.2 Methodology
This study fits well and addresses research gaps within the literature of both crime geography and identity theft research. Overall, by utilizing theoretical framework established for crime geography (Harries 1974, 1999), addressing the calls for better spatial analysis of identity theft (Newman and McNally 2005; Allison et al 2005), and expanding research knowledge of existing identity theft/demographic studies (Allison et. al 2005; Anderson 2006), this project seeks to contribute a social ecology spatial
analysis to the nascent body of identity theft research. The goal is to identify significant spatial patterns of identity theft victims alongside social demographic variables in order to determine correlated spatial patterns that may reveal underlying social indicators contributing to this pervasive crime. By using spatial statistics techniques and GIS mapping, distinct regional variations are identified for identity theft as a whole, as well as for the FTC classification categories. Additionally, statistically significant correlations reveal potential social variables, such as race/ethnicity and urban-rural population
composition, that may be directly associated with identity theft victims in the U.S. from 2002 through 2006.
3.2.1 Selection of significant demographic variables
The purpose of this phase of the analysis is to determine correlations between the demographic data and the identity theft data. To accomplish this, traditional statistical tests were performed using the master database (containing both demographic and identity theft data) to determine which variables return significant correlations (see Appendix 2 for complete list of results). Using identity theft per capita rates (by category and by year) as the dependents (y), and demographic variables as the independents (x), SPSS software was employed to run both uni- and multi-variate regression analyses in order to narrow down the demographic variables to a more specific quantity. The null hypothesis being tested was that the slope of the regression line is zero (Ho: β1 = 0), thus indicating no correlation if the p-value is greater than α = .05 for a 95-percent confidence level. For the years 2002 and 2006, by holding the per capita identity theft dependent variable constant and repeatedly running regression analyses for each demographic variable, a concise list of correlated variables were
identified for overall identity theft per capita rates and also for each of the subcategories. These tests were repeated for both years in order to determine if the patterns are static or are temporally evolving.
The use of per capita rates in lieu of actual incident counts has been common
practice throughout crime mapping research (ID Analytics 2007a, 2007b; Lottier 1938a, 1938b; Shannon 1954). The method retains validity because per capita figures are normalized by current population counts, thus representing the rate of identity theft by an intensity ratio within each state for a specific year, regardless of state population
differences. For example, one would expect more occurrences of a phenomenon in a highly populated state such as California, than in a state with a low population, such as Vermont. By comparing ratios, a better representation is achieved which accounts for population differences. Therefore, per capita rates are a good indicator of the
pervasiveness of the crime within each state.
Linear regression is chosen as the appropriate and optimal statistical tool since all variables involved are continuous (e.g. categories such as race, urban/rural are measured as either actual population counts, or on a 100-scale percentage such as per-capita values). The variables were further tested for residual normality, constant variance, collinearity, extreme outliers, and extreme leverage values. The result was a concise, workable demographic database (Table 5) with all variables showing significance in relation to the identity theft data with particular attention paid to potential problematic issues, such as heteroscedascity or collinearity in the data.
Table 5: Demographic Variables Correlated with Identity Theft Categories
Variable Definition Highest Correlation R2
Value with Per Capita Identity Theft Rates CredIssu Number of businesses issuing credit .458
DigEcon Digital Economy Index score .344 HISP_pct Percent of population that is Hispanic .782 HspEst Hispanic Population Estimate .434 HspFamSz Average statewide family size, head of
household Hispanic
.333 MilBarak Population living in military group quarters .311
OnlinePop Online population .400
3.2.2 GIS mapping
GIS mapping was conducted in order to visualize regional patterns in the data. ArcGIS 9.0 was used to create the maps by joining the master database containing both identity theft and demographic data to appropriate shape files for each mapping
technique. For the identity theft data, a set of maps was produced for both 2002 and 2006 data. A set of maps was also produced for the selected demographic variables.
Choropleth maps were first created for both identity theft and demographic data by joining the master database to a polygon shape file of the 48 contiguous U.S. states. Alaska and Hawaii were omitted from the mapping as they are geographically detached from the mainland and therefore cannot be part of a regional cluster. The choropleth maps were produced using six classes (quintiles method), or eight states per
classification. The use of equal count classification quintiles is a commonly used method for regional crime mapping, dating as far back as Lottier (1938a, 1938b). The quintiles method is chosen here to reveal regional patterns as the classes are not based on an arbitrary value (which would vary by year), but are selected solely on the basis of state membership for each class based on the data for that year. The initial maps revealed that regional differences are most prominent for identity theft data when normalized with population values (producing per capita equivalent values).
Understanding, however, that information flows and identity theft patterns likely do not adhere to political boundaries, a secondary set of spatially interpreted maps is needed in order to reveal regional patterns independent of arbitrary state borders. Inverse
based on Tobler’s First Law of geography, which posits that things closer together in space are more related than things farther away (Tobler 1970). In IDW, values at known locations are used to interpolate expected values at points in-between. Values nearer to the point to be interpolated will have more influence than points farther away, and the weighted influence of points (or neighbors) is determined by the value of the weighting parameter. Specifically, IDW is defined as:
∑
∑
= = = ′ N i r i r i N i i d d z z 1 1 1 1 *Where d = distance between given and observed points; z = observation point; N = number of observations; i = iteration; z′ = weighted value at the given point; and r = weighting parameter.
Unlike choropleth mapping which requires polygon data, spatial interpolation
requires point data. To create the point file, state population centroids were extrapolated based on the populations of the top identity theft reporting cities in each state (according to the FTC). The master database was then joined to the state centroids shape file, thus providing for spatial interpolation via inverse distance weighting (IDW). The resulting maps are continuous raster surfaces showing regional patterns of identity theft intensities across states. As with the choropleth maps, six classes were designated using the
quintiles method in order to maintain comparability of the mapping techniques. Because the IDW method is unable to interpolate beyond the outermost point, the centroids in Washington, California, Maine, and Florida were manually nudged to prohibit mid-state
truncation of the interpolation raster surface. The resulting maps reveal distinct regional variations in the data similar to the comparable choropleth maps.
3.2.3 Spatial statistics analysis
The third level of analysis for this research employs spatially specific procedures in order to detect significant clustering and/or outliers within the data. This procedure is necessary to corroborate the findings of the GIS maps, and to further analyze the data with specialized spatial statistical tools in order to mathematically bolster the patterns and clusters identified with ArcGIS. LISA analysis is excellent for identifying hot spots, geographic clusters, and spatial outliers (Anselin 1995), which is particularly apropos to the patterns observed in the ArcGIS analysis.
GeoDa, a spatial statistics package developed by the Spatial Analysis Lab at the University of Illinois, was utilized to apply local indicators of spatial autocorrelation (LISA) to the data. LISA analysis specifically examines the spatial aspects of data by linking individual observations to global measures via spatial weighting matrices, and works well in both spatial pattern exploration and confirmation (Anselin 1995). LISA is often used to analyze the spatial characteristics of large spatially referenced data sets. However, Anselin (1995) shows that it is also effective in the analysis of smaller datasets (n < 50), by using LISA to successfully reveal spatial patterns of conflict amongst 42 African countries. Therefore, LISA is an appropriate tool for this project where n = 48, composed of state polygons. The LISA results corroborate the findings of the GIS mapping and the initial regression analyses to ensure that the regional patterns and
clusters revealed in the GIS mapping are true and mathematically supported, and not merely a product of cartographic manipulation.
LISA analysis can be executed on either original data, as in this thesis, or
standardizations. LISA incorporates neighborhood analysis and distance weighting in the calculations whereby the tests are specifically designed to determine significant regional clustering and/or outliers within the data.
Specifically, in GeoDa univariate LISA is defined as:
(
)
(
)
(
)
∑
∑
− − − = j x j x j ij x i i n x x w x I 2 µ µ µwhere xare observations, and wij is a spatial weights matrix equal to 1/dij in which dij represents the Cartesian distances between the ith and jth points. The spatial weights matrix for a polygon shape file can be either Rook (common boundary) or Queen
(common boundaries and vertices), or can be based on the distance between points, such as polygon centroids (Figure 1).
For this thesis, all three spatial weights methods were explored. Queen continuity produced the best results, capturing more accurate state neighborhoods because all states do not share common boundaries, yet are considered neighbors at one or more vertices (e.g. UT, AZ, CO, and NM).
In the results, a positive Ii value indicates a spatial clustering of similar values (similar high or similar low values), while a negative Ii value indicates a spatial clustering of dissimilar values, such as when a high value is surrounded by neighbors with low values, or vise versa. Thus, the LISA Ii value reveals clusters of either stability (similarities) or outliers of instability (dissimilarities) in the spatial data.
4. RESULTS AND DISCUSSIONS
4.1. Results
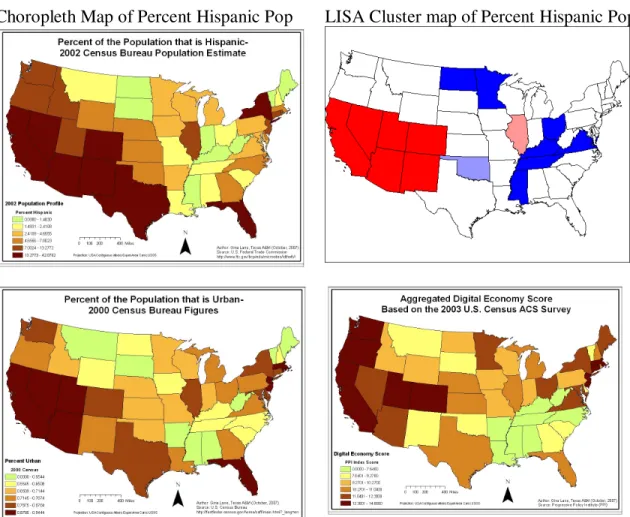
Overall, regional patterns were clearly identified. Consistent with the earlier media reports, the desert southwest states appear to maintain the highest per capita rates, while the plains states and upper New England have the lowest per capita rates. Some of the subcategories show unique patterns. For example, there was an eastern shift in identity theft in the form of government document fraud by 2006, which analysts believe is a result of a sharp increase in fraudulent government benefit claims after Hurricane Katrina (Conkey 2006). The highest demographic correlations were with states with higher Hispanic populations.
4.1.1. Identifying unique spatial and temporal patterns
The ArcGIS maps revealed existing regional patterns in the identity theft and demographic data. On the whole, identity theft patterns appear to be relatively static from 2002 through 2006, however, some categories do exhibit spatial changes.
When looking at actual identity theft counts, no clear regional patterns emerge. Rather, states with the highest populations, such as California, Texas, Florida, New York, Illinois, and New Jersey consistently and expectedly report high numbers of identity theft complaints. However, by normalizing the identity theft complaints by the population, a common long-term practice in past regional studies, per capita rates of identity theft are produced, which offer a better representation of the varying statewide intensities of the crime (ID Analytics 2007a; 2007b; Lottier 1938b). These maps
revealed that the per capita rates of identity theft do exhibit clear regional variations (Figure 2). The normalized data reveal two distinct regional patterns of identity theft. The desert southwest and western states exhibit much higher rates, and the middle and northern plains and upper New England states typically report much lower rates for both 2002 and 2006.
Actual Identity Theft Counts Per Capita Rates
Figure 2: Comparison Maps of Identity Theft Per Capita Rates
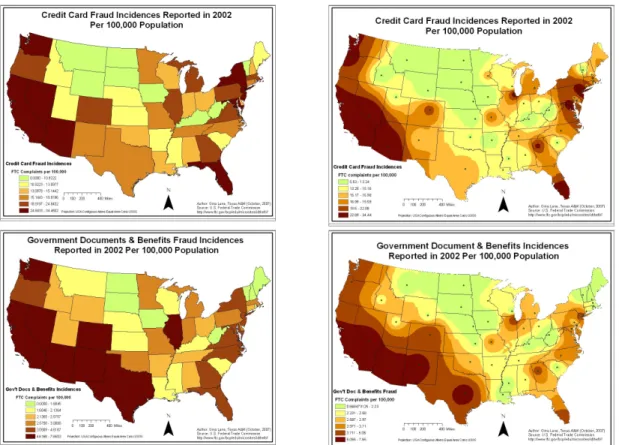
Although most of the FTC categories show similar patterns to the overall data (some more than others), there are some regional pattern differences. In 2002, most of the FTC
categories had similar per capita patterns. In particular, bank, loans, phone and utility, and credit card identity theft categories were most similar to overall 2002 per capita patterns, but employment related and government document identity theft had a more southern U.S./Mexico border concentration with much less clustering in the northern plains (Figure 3).
Figure 3: Spatial Patterns of Some FTC Identity Theft Categories in 2002
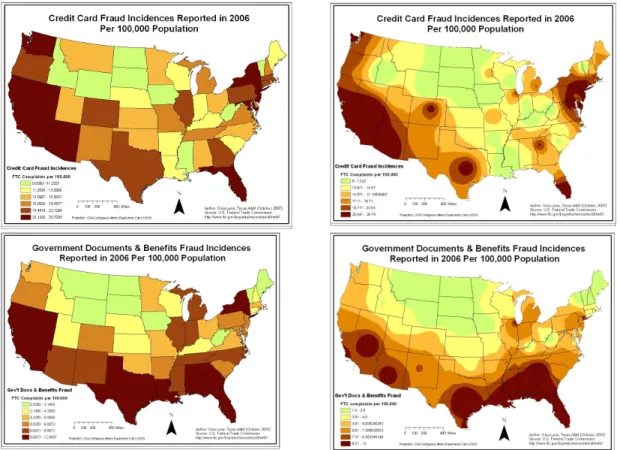
By 2006, the highest per capita identity theft states had shifted towards a more southern U.S./Mexico border clustering with perhaps the appearance of a southeastern cluster centered on Florida and Georgia (Figure 4). Loan, phone and utilities, and employment related identity theft patterns were remarkably similar to overall patterns,