Estimation and Decomposition of China’s Provincial Total Factor
Productivity: Based on DEA Malmquist Index Method
Xiao KONG*
School of Public Affairs, University of Science and Technology of China, 96 Jinzhai Road, Hefei 230026, China
Abstract
Total factor productivity is thought to be the key factor to economic development, while related empirical studies on China’s total factor productivity estimation is limited. This paper using a Malmquist index model, estimated China’s provincial total factor productivity during 2009-2015, and decomposed total factor productivity into technological progress, technological efficiency and scale efficiency to study its affecting factors. The main results show that China’s total factor productivity has a limited contribution to economic development compared with before and total factor productivity in China has been declining since 2011.We also found the growth rate of China’s total factor productivity in less developed areas was greater than that of more developed areas, in which technological progress contributed most. However, further analysis shows that although China’s past TFP growth depend on technological progress, its effect is fading. We believe this paper have important policy implications that China should pay more attention to improving TFP through promoting efficiency, and China should also further improve self-innovation to promote technological progress growth.
Keywords: economic growth, malmquist index model, total factor productivity
1. Introduction
Total factor productivity (TFP), also called the rate of technological progress, refer to the proportion of production output when all the production factors (including capital, labor, and land) remain constant. The early Neoclassicism attributed the growth of economy to the function of factor accumulation. After (Cobb & Douglas, 1928) put forward production function, Abramovitz (1956) based on that found that other factors may promote output other than the input of basic production factors. Solow (1957) attributed the growth of output that cannot be explained by production factor investment to technological progress, which is known as the Solow Residual. As a matter of fact, Solow Residual contains many factors including institutional factor, knowledge transfer and so on, which equals to total factor productivity (TFP). The Neoclassicism believed that TFP is an exogenous variable to economic growth, whereas the endogenous growth theory in the early 1990s (Lucas, 1988; Romer, 1990) endogenized technological progress and knowledge accumulation, believing that the economy can maintain constant growth without external force, endogenous technological progress is the decisive factor to ensure economic growth.
It is generally believed that, for countries that are still under the early stage of development, their economy can rely mainly on capital, land and labor input, because these countries have development advantage of resources input. However, for countries of the higher stage of economic development, their development must rely on the promotion of total factor productivity. China has achieved economic boom since 1978, however most studies believed this to be the consequences of resource input such as the benefit of huge populations and investment in real estates (Ke, 2016; Wu & Xiaowei, 2017; Yan & Yudong, 2003). With China’s economy gradually entering the top levels of the word’s economy, it is still unclear whether and to what extent the promotion of total factor productivity of China has contributed to economic growth. In particular, related empirical studies on the estimation of provincial total factor productivity of China is limited in recent years. Estimation of provincial total factor productivity of China is essential to understand China’s current economic growth pattern—to be resource dependent or efficiency dependent—. What’s more, further studies based on that may be carried out to explore how related factors such as technological progress, efficiency, degree of market openness and institutional factors may promote total factor productivity of China.
In this paper, we collected the latest provincial data of China from 2009 to 2015, and estimated total productivity factor of China’s 30 provinces based on a DEA-Malmquist index model. We also tried to decompose total factor productivity into technological progress, technological efficiency and scale efficiency, and further analysis based on the empirical results was conducted.
The rest of this paper is organized in the following manner. Section 2 is about the concept of total factor productivity. Section 3 introduces the methodology and data. Section 4 presents main results and discussions. Section 5 summarizes and gives the main conclusion.
2. Concept of Total Factor Productivity (TFP)
Total factor productivity (TFP) is a concept derived from the neoclassicism; it tries to estimate productivity in the premise of taking into consideration of all production factors. TFP is essentially a technological concept
which refers to the ratio of output and input, that is, the estimation to efficiency. The reduced form of formula to estimate TFP is A=Q/(αL+βK) or A=Q/(Lα Kβ ),where the former is the arithmetic type of formula and the latter is the geometric type of formula. In the reduced formula, A stands for efficiency, Q, L and K stand for output, labor and capital accumulation respectively. α and β is the weight of variable L and K. To determine the most appropriate weight for each variable, the neoclassicism links the total efficiency A with the concept of total production function, where the general form of total production function is:
Qt = F [Kt, Lt, t] (1)
Equation (1) regards total output Qt as the function of capital (K), labor (L) and time (t), in which t contains productive efficiency and technological progress. The subscript t also stands for time. Supposing that “t” stands for an independent factor that can be separated from K and L, that is,
Qt = AtF [Kt, Lt] (2) which equals to
At = Qt / (F [Kt, Lt]) (3)
Then At can be defined as an exogenous Hicks technological progress—the concept of total factor productivity (TFP)—which can be estimated by figuring out how output changes over time with input maintain constant. Total factor productivity (TFP) stands for all the factors that have contributed to productivity other than labor and capital, including management, research & development, technology diffusion and so on.
3. Methodology and Data
3.1 Estimation procedures
There are generally two kinds of methodologies to estimate TFP: parametric procedures and nonparametric technique. The parametric method includes using production function, cost function, and stochastic frontier analysis (SFA) and the nonparametric technique includes index method and Data Envelopment Analysis (DEA). We have employed the nonparametric DEA Malmquist index method with a higher accuracy. Malmquist index method was developed based on Data Envelopment Analysis (DEA), which uses the ratio of the distance function to calculate output/input efficiency. Caves, Christensen, and Diewert (1982) defined that for Malmquist index with one input variable and one output variable, the equations are as follows:
Mt 0= (Dt 0(xt+1, yt+1)/ (Dt 0(xt, yt) (4) Mt+1
0 = (Dt+1 0 (xt+1, yt+1)/ (Dt+1 0 (xt, yt) (5)
Fare, Grosskopf, and Norris (1997) based on that used the geometrical mean of equation (4) and equation (5) to calculate Malmquist index of total factor productivity, and decomposed total factor productivity into technological progress, technological efficiency and scale efficiency, which can be adapted to the following equation (6):
M0(xt,yt,xt+1,yt+1)=(St 0(xt,yt)/St 0(xt+1,yt+1))×(Dt 0(xt+1,yt+1/VRS)/Dt 0(xt,yt/VRS))×((Dt 0(xt+1,yt+1)/(Dt+1 0 (xt+1,yt+1))×(Dt 0 (xt,yt)/(Dt+1
0 (xt,yt)))1/2 (6)
M0 stands for Malmquist index of total factor productivity, the three polymerizations in the right side of equation (6) stand for scale efficiency, pure technical efficiency and technological change respectively.
3.2 Data
In this paper, we have employed the model of Fare et al. (1997) and select provincial capital (in the form of fixed capital stocks) and labors as the input variable, real provincial gross domestic product (GDP) as the output variable. A time frame from 2009 to 2015 was chosen due to the availability of high quality data. All related variables were pre-estimated in the following manner.
Fixed capital stocks (K): provincial fixed capital stocks were estimated according to erpetual inventory method proposed by Goldsmith (1951). The estimation model is Ki,t=Ki,t-1(1- δi,t)+ Ii,t/Pt, where Ki,t is regional real fixed capital stocks in year t, Ki,t-1 is real fixed capital stocks of each provinces in year t-1, δi,t is depreciation rate of fixed assets, Ii,t is nominal investment of each province in year t and Pt stands for the price index of fixed assets investment of year t. To determine the baseline fixed capital stocks (Ki,t), we adopted the widely used discount depreciation method (Cheng, Mao, & Wei, 2014; Hui & Ddlin, 2010), that is Kt=t/(gt~t+i+δt~t+i) the depreciation rate of fixed assets (δi,t) was calculated based on officially published provincial fixed assets depreciation (Cheng et al., 2014); nominal investment (Ii,t) was estimated based on the provincial gross fixed capital formation(Cheng et al., 2014) and the price index (Pt) was the officially published fixed assets investment price index by the State Statistical Bureau of China.
Labor (L): to estimate provincial labors, we used provincial economically active population of age 15-64, the data can be collected from the Population and Employment Statistics Yearbook of China (2010-2016).
GDP: Real provincial GDP was estimated based on provincial nominate gross domestic product and was then deflated based on the provincial consumer price index with 2009 as the base year, all the data can be found in the officially published year book of the State Statistical Bureau of China.
4. Results
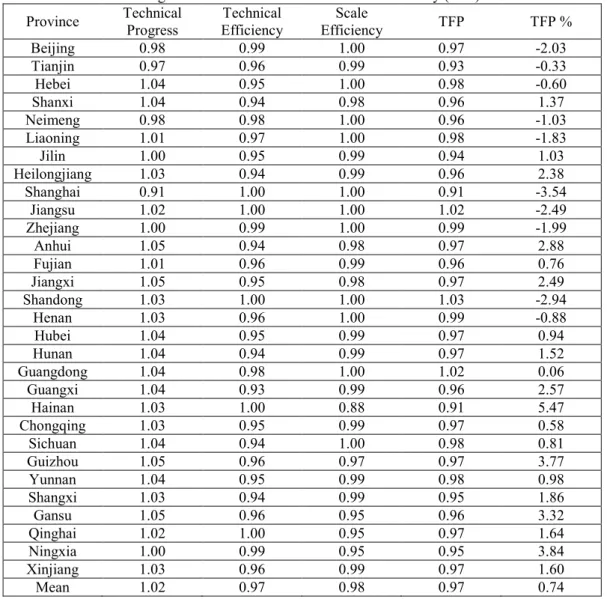
Table 1 shows the average annual provincial TFP of China. Generally, TFP of China’s most provinces are less than 1.00, as shown in the last but one column of Table 1, indicating that total factor productivity of China is degenerating. Nationally, the average annual growth rate of total factor productivity is 0.74%, the top five provinces that have a higher TFP growth rate are Hainan, Ningxia, Guizhou, Gansu and Anhui, as shown in the last column of Table 1. These provinces all belong to the less developed areas of China: Hainan, Guizhou, Ningxia and Gansu is the south west of China, Anhui belongs to the middle part of China. This demonstrates that China’s West Development Strategy and Midlands Rise Strategy are effective in recent years. While for some more developed coastal areas of China, such as Shanghai, Jiangsu and Beijing, their TFP growth rate are tailing off, this may be a consequence of innovation bottleneck and uneven resource distribution. From the Technical Progress column, we can see that in most areas, their technical progress is larger than 1.00, while the Technical Efficiency column shows that almost all province’s technical efficiency is less than 1.00. This indicates that during the past decades, the growth of total factor productivity of China mainly depends on technological progress rather than efficiency.
Table 1. Average Annual Provincial Total Factor Productivity (TFP) of China Province Technical Progress Efficiency Technical Efficiency Scale TFP TFP %
Beijing 0.98 0.99 1.00 0.97 -2.03 Tianjin 0.97 0.96 0.99 0.93 -0.33 Hebei 1.04 0.95 1.00 0.98 -0.60 Shanxi 1.04 0.94 0.98 0.96 1.37 Neimeng 0.98 0.98 1.00 0.96 -1.03 Liaoning 1.01 0.97 1.00 0.98 -1.83 Jilin 1.00 0.95 0.99 0.94 1.03 Heilongjiang 1.03 0.94 0.99 0.96 2.38 Shanghai 0.91 1.00 1.00 0.91 -3.54 Jiangsu 1.02 1.00 1.00 1.02 -2.49 Zhejiang 1.00 0.99 1.00 0.99 -1.99 Anhui 1.05 0.94 0.98 0.97 2.88 Fujian 1.01 0.96 0.99 0.96 0.76 Jiangxi 1.05 0.95 0.98 0.97 2.49 Shandong 1.03 1.00 1.00 1.03 -2.94 Henan 1.03 0.96 1.00 0.99 -0.88 Hubei 1.04 0.95 0.99 0.97 0.94 Hunan 1.04 0.94 0.99 0.97 1.52 Guangdong 1.04 0.98 1.00 1.02 0.06 Guangxi 1.04 0.93 0.99 0.96 2.57 Hainan 1.03 1.00 0.88 0.91 5.47 Chongqing 1.03 0.95 0.99 0.97 0.58 Sichuan 1.04 0.94 1.00 0.98 0.81 Guizhou 1.05 0.96 0.97 0.97 3.77 Yunnan 1.04 0.95 0.99 0.98 0.98 Shangxi 1.03 0.94 0.99 0.95 1.86 Gansu 1.05 0.96 0.95 0.96 3.32 Qinghai 1.02 1.00 0.95 0.97 1.64 Ningxia 1.00 0.99 0.95 0.95 3.84 Xinjiang 1.03 0.96 0.99 0.97 1.60 Mean 1.02 0.97 0.98 0.97 0.74
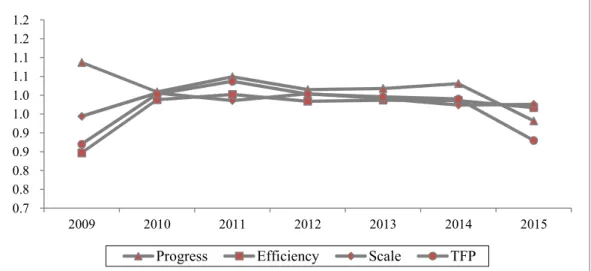
The growth trends of total factor productivity is estimated in Fig.1, as shown below, during the past 10 years, technological progress of China is gradually going down. At the same time, total factor productivity, technological efficiency and scale efficiency are all gonging down since 2011, which is vigilant to China. To quantitatively estimate how GDP growth was related to the growth of Total Factor Productivity, the contributions of TFP growth, technological progress growth, technological efficiency growth and scale efficiency growth to GDP growth were roughly estimated. As shown in Table 2, during 2009-2015 China has an average TFP growth rate of 0.50%, which accounted for 5.42% of China’s annual GDP growth rate (9.18%). This was far less than the estimated 32.94% during 1984-2009 by Shaohua and Weijie (2014) and 12.9% during 1992-2004 estimated by Yanrui (2008). The dramatic decrease of TFP during recent decades needs attention. In
the 5.42% contributions of TFP to GDP growth, technological efficiency growth account for 34.93%, while technological progress growth has a negative relationship with GDP growth. This indicated that although China’s past TFP growth depend on technological progress, its effect is fading, while the contribution of technological efficiency on TFP growth is increasing. During the past decades, the growth of China’s total factor productivity mainly depended on mimic innovation and technical import from developed countries, which is a shortcut to prompt development. However, with the gradual development of China in both economy and technology, the gap between China and developed countries is becoming smaller and smaller, which means the effect of technology import and knowledge transfer is fading. This can be reflected by the minus relationship between technological progress growth rates with GDP growth rates. So China should pay more attention to strengthen self-dependent innovation to boost technological progress, and should also put more emphasis on improving technological efficiency to boost total factor productivity.
Fig 1. Average Total Factor Productivity (TFP) Growth of China. Table 2. Estimation of GDP Growth and Its Contributors
Index (%) 2009-2015 GDP Growth 9.18 Progress Growth -2.41 Efficiency Growth 3.21 Scale Growth 0.60 TFP Growth 0.50 Progress/GDP -26.30 Efficiency/GDP 34.93 Scale/GDP 6.54 TFP/GDP 5.42 5. Conclusions
This paper statically estimated China’s provincial total factor productivity during 2009 to 2015 using DEA-Malmquist index model, and a subsequent analysis was conducted from two dimensions of time and space. The results show that China’s total factor productivity has a limited contribution to economic development compared with 2009 before, while its growth rate was found to be gonging down since 2011. We also found TFP growth rate in less developed south-western areas was greater than that of more developed coastal areas. This paper further tried to decompose total factor productivity of China into technological progress, technological efficiency and scale efficiency, which may help explain how total factor productivity was influenced by different factors, and we found the growth of total factor productivity of China mainly depends on technological progress rather than efficiency. However, the effect of technological progress on TFP growth is decreasing.
The results indicate that China should pay more attention to transferring its economic development pattern to TFP dependent one in order to maintain sustained economic growth. Under the condition that China is gradually losing its population bonus, China’s economic growth must depend more on technological progress and efficiency. The source of total factor productivity mainly comes from technological progress, institutional innovation, openness and production innovation (Miller & Upadhyay, 2000; Nishimizu & Page, 1982; Xiao & Feng, 2017). From the empirical results, past TFP growth of China mainly comes from technological progress, however, with the technological gap between China and developed countries getting smaller and smaller, the
0.7 0.8 0.8 0.9 0.9 1.0 1.0 1.1 1.1 1.2 1.2 2009 2010 2011 2012 2013 2014 2015
benefits China can get from mimic innovation and technological transfer from developed countries is becoming increasingly limited. In the future, China should pay more attention to efficiency to improve total factor productivity. The allocation of resources should be further optimized form primary industry to second and third industries, and from enterprises of low production efficiency to highly productive ones. At the same time, China should further optimize its self-innovation system in order to promote technological progress, thus making up for the insufficient driving force from mimic innovation. This paper failed to explain the in-depth reason that caused the decline of China’s total factor productivity since 2011, which will be our future research direction.
References
Abramovitz, M. (1956). Resource and output trends in the United States since 1870. American Economic Review, 46(2), 5-23.
Caves, D. W., Christensen, L. R., & Diewert, W. (1982). The Economic Theory of Index Numbers and the Measurement of Input, Output, and Productivity. Econometrica, 50(6), 1393-1414.
Cheng, L., Mao, T., & Wei, Z. (2014). Re-estimating the Capital Stock of China from the First Five Year Plan to the Eleventh One. Journal of Xi'an Jiaotong University (Social Sciences), 34(4), 13-20.
Cobb, C. W., & Douglas, P. H. (1928). A theory of production. The American Economic Review, 18(1), 139-165. Fare, R., Grosskopf, S., & Norris, M. (1997). Productivity growth, technical progress, and efficiency change in
industrialized countries: reply. The American Economic Review, 87(5), 1040-1044.
Goldsmith, R. W. (1951). A perpetual inventory of national wealth Studies in Income and Wealth, Volume 14 (pp. 5-73): NBER.
Hui, S., & Ddlin, Z. (2010). Estimate of the Capital Stock of Provinces in China and the Typical Facr from 1978 tp 2008. Journal of Finance and Economics, 25(3), 103-116.
Ke, F. (2016). Research on Impact of Real Estate Investment Fluctuation on Business Cycle of China. Journal of
Beijing Technology and Business University (Social Science), 31(5), 116-126.
Lucas, R. E. (1988). On the mechanics of economic development. Journal of monetary economics, 22(1), 3-42. Miller, S. M., & Upadhyay, M. P. (2000). The effects of openness, trade orientation, and human capital on total
factor productivity. Journal of development economics, 63(2), 399-423.
Nishimizu, M., & Page, J. M. (1982). Total factor productivity growth, technological progress and technical efficiency change: dimensions of productivity change in Yugoslavia, 1965-78. The Economic Journal, 92(368), 920-936.
Romer, P. M. (1990). Endogenous technological change. Journal of political Economy, 98(5), 71-102.
Shaohua, Z., & Weijie, J. (2014). A Re-estimate and Decomposing of the Total Factor Productivity of China.
Statistical Research, 31(3), 54-60.
Solow, R. M. (1957). Technical change and the aggregate production function. The review of Economics and
Statistics, 312-320.
Statistics, C. N. B. o. (2010-2016). China Population and Employment Statistics Yearbook Beijing, China: China StatisticsPress.
Wu, X., & Xiaowei, Z. (2017). Demographic Dividend, Institutional Dividend and China's Economic Growth.
Reform of Economic System(3), 11-16.
Xiao, K., & Feng, F. (2017). Optimizing Administrative Mechanism of Trans-regional Science Park Collaborations in China—A Case Study of Yangtze River Delta S&T City. Developing Country Studies, 7(4), 51-55.
Yan, W., & Yudong, Y. (2003). Sources of China's economic growth 1952–1999: incorporating human capital accumulation. China Economic Review, 14(1), 32-52.
Yanrui, W. (2008). The role of Productivity in China's Growth: New Estimates. China Economic Quarterly, 7(3), 827-842.