by
Ioannis Korkos
This thesis is submitted for the degree of Doctor of Philosophy in Finance
Essex Business School University of Essex
Abstract
The rst chapter of this thesis, discusses the characteristics of an asset bubble episode outlining the reasons these episodes have attracted so much interest nowa-days and provides an overview of historical bubble episodes motivating the testing procedures proposed in Chapters 2-4.
The second chapter proposes a right-tailed bootstrap implementation of the covariate Augmented Dickey-Fuller (CADF) unit root test of Hansen (1995), mo-tivated by the work of Chang, Sickles and Song (2017). We apply the right-tailed bootstrap BCADF test in a recursive manner and provide evidence that the inclu-sion of relevant covariates oers signicant power gains. An empirical application of the proposed methodology is conducted, utilising the Moody's Seasoned Aaa and Baa Corporate Bond Yields, the Ten-Year Treasury Rate and the Volatility Index (VXO) as covariates.
The third chapter intends to examine the size and power properties of right-tailed Dickey-Fuller unit root test processes when testing for market eciency in the commodity markets by applying a wild bootstrap approach to Phillips et al. (2015) tests. The simulations results show that the proposed wild bootstrap test oers better size control and power performance in nite samples. In the empiri-cal exercise, our proposed test suggests periods of market ineciency prior to the existence of the bubble episode as identied by the conventional tests during two periods of oil crises.
The fourth chapter studies the hypothesis of an asset bubble in a rational expec-tations framework using a bivariate coexplosive vector autoregression as in Nielsen (2010). Firstly, we apply a co-explosive vector autoregression to model whether the WTI crude oil price run-up of 2007-2008 can be attributed to the existence of a bubble as well as whether the WTI crude oil collapse of 2014-2015 exhibits characteristics of bubble implosion.
In the fth and nal chapter, concluding remarks are made regarding and di-rections for future research are proposed.
Acknowledgements
Throughout the writing of this thesis I have received a great deal of support and assistance without which this thesis would be incomplete. First and foremost, I am deeply indebted to my PhD advisers Professor Neil Kellard and Dr Sam Astill for their continued support, help, inspiration, guidance and friendship during the past three years. Furthermore, I am very grateful to Professor A. M. Robert Taylor for providing con-structive and useful feedback on chapters 2 and 3 of this thesis. I would like to thank Dr Daniel Tsvetanov as well for his support in the earlier stage of this thesis. Earlier versions of the chapters of this thesis has been presented to international conferences where great feedback and suggestions for improvements have been taken. In particular, special thanks should be given to Professor Peter C. B. Phillips, Professor Liudas Gi-raitis and Professor Roderick McCrorie for their very insightful remarks and comments. Additionally, I would like to express my gratitude to Professor Bruce E. Hansen, Pro-fessor Wonho Song and ProPro-fessor A. M. Robert Taylor, for kindly sharing their GAUSS codes with me. Moreover, I would like to gratefully acknowledge the nancial support of the Economic and Research Council (award reference 1797607), during the writing of this thesis.
Moreover, I am thankful to both the PhD viva external examiner, Professor Anas-tasios Magdalinos and the internal examiner Professor Ekaterini Panopoulou for their useful feedback and comments as well as Dr Theodora Bermpei for conducting the mock viva.
Finally and most importantly, I would like to express my sincere gratitude to my family for their love and unconditional support during this academic journey. I am grateful to Pori Saikia, Lizeta Demetriou, Maris Camilleri and Lucas Shuttleworth for their emotional support, love and kindness without which this thesis might not have become complete and my PhD colleagues at the Essex Business School for all the good times and long days we shared together.
Declaration
Chapter 2 of this thesis is based on the paper "Improving the power of univariate tests for bubbles by using covariates" co-authored by myself, Sam Astill, Neil Kellard and A. M. Robert Taylor. Chapter 3 of this thesis is based on the paper "Wild Bootstrap Testing for Speculative Bubbles Using Spot and Futures prices" co-authored by myself, Sam Astill and Neil Kellard. Chapter 4 of this thesis is based on the paper "Testing for Bubbles in Commodity Spot and Futures Using a Co-explosive Autoregression" co-authored by myself, Sam Astill and Neil Kellard. In all instances I was the primary author of the paper.
This work is, to the best of my knowledge original, except were acknowledgements and references are made to previous work. Neither this, nor any substantially similar thesis has been or being submitted for any other degree, diploma or other qualication at any other university.
1 Introduction . . . 10
1.1 Bootstrap Unit Root Testing for Explosive Behaviour using Covariates . 14 1.2 Wild Bootstrap Testing for Speculative Bubbles Using Spot and Futures Prices . . . 16
1.3 Testing for Bubbles in Commodity Spot and Futures Using a Co-explosive Autoregression . . . 18
1.4 Contribution to the extant literature . . . 22
2 Bootstrap Unit Root Testing for Explosive Behaviour Using Covariates 23 2.1 Introduction . . . 23
2.1.1 Theory . . . 23
2.1.2 Early Tests on Bubbles . . . 23
2.1.3 Recent Tests on Bubbles . . . 26
2.2 The Model and Assumptions . . . 35
2.3 Extant Recursive Test Procedures . . . 37
2.4 Extant Covariate Augmented Unit Root Tests . . . 39
2.5 Proposed Tests . . . 39
2.5.1 Limit Theory . . . 40
2.5.2 Practical Implementation of tests . . . 41
2.5.3 Bootstrap Unit Root Tests with Covariates . . . 42
2.5.4 Bootstrap Limiting Distribution . . . 45
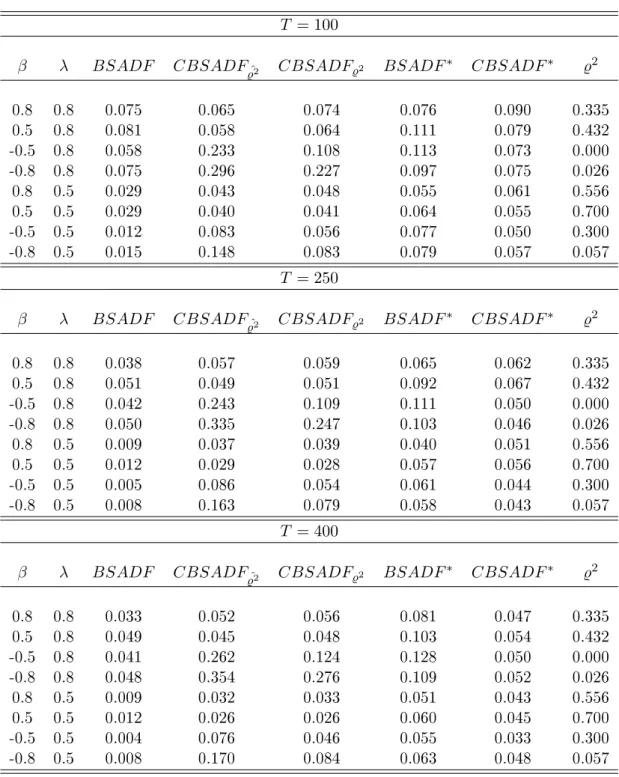
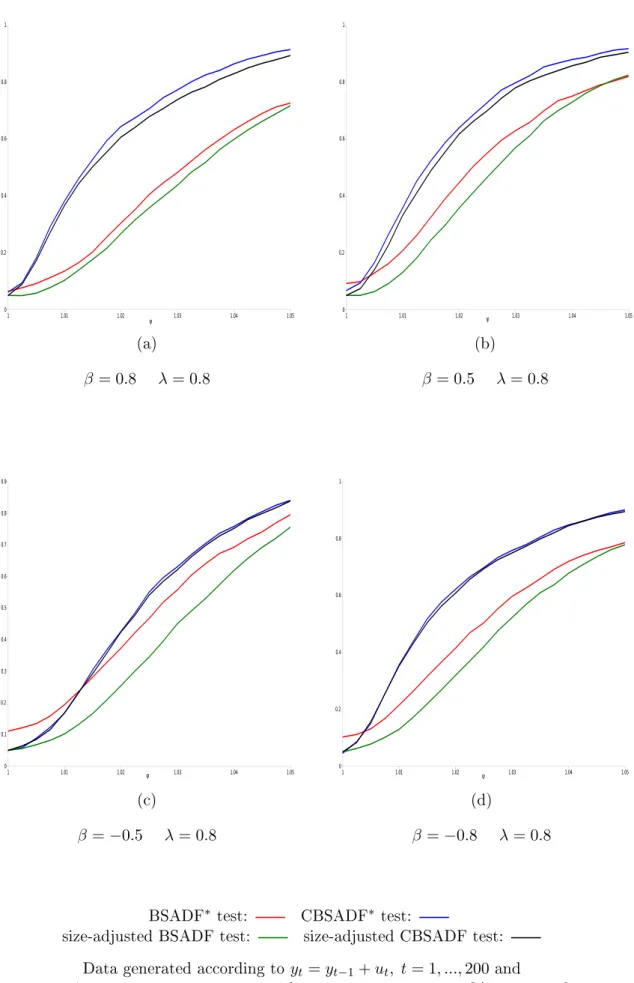
2.6 Finite Sample Simulations . . . 45
2.6.1 Empirical Size . . . 47 2.6.2 Empirical Power . . . 48 2.7 Empirical Application . . . 49 2.8 Conclusion . . . 53 2.9 Tables . . . 55 2.10 Figures . . . 59
3 Wild Bootstrap Testing for Speculative Bubbles Using Spot and Fu-tures Prices . . . 62
3.1 Introduction . . . 62
3.1.1 Rational Bubble Tests . . . 62
3.2 The Model and Assumptions . . . 66
3.3 Extant Recursive Test Procedures . . . 68
3.4 Limit Theory . . . 69
3.5 Proposed Tests . . . 70
3.5.1 Wild Bootstrap Unit Root Tests . . . 71
3.6 Finite Sample Simulations . . . 74
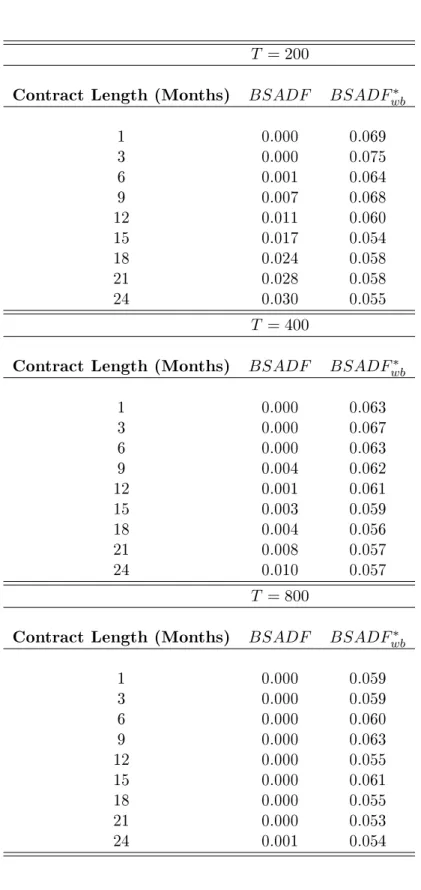
3.6.1 Empirical Size . . . 75
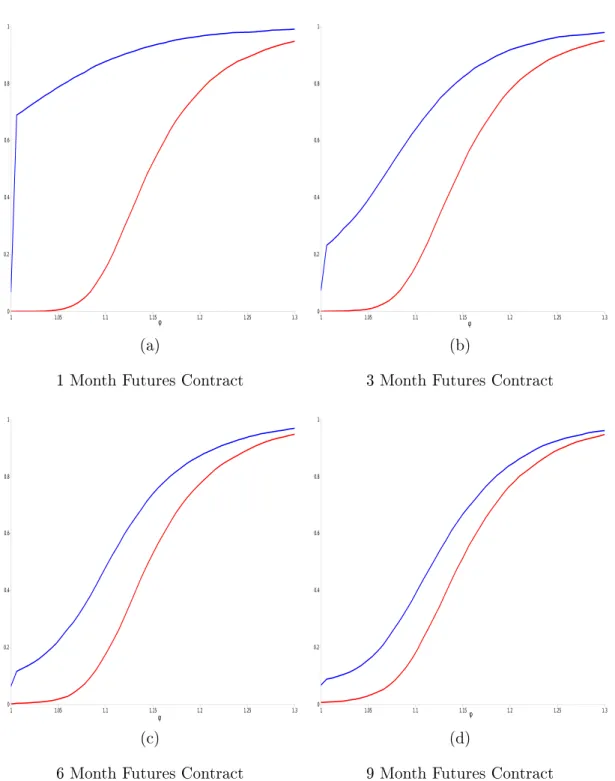
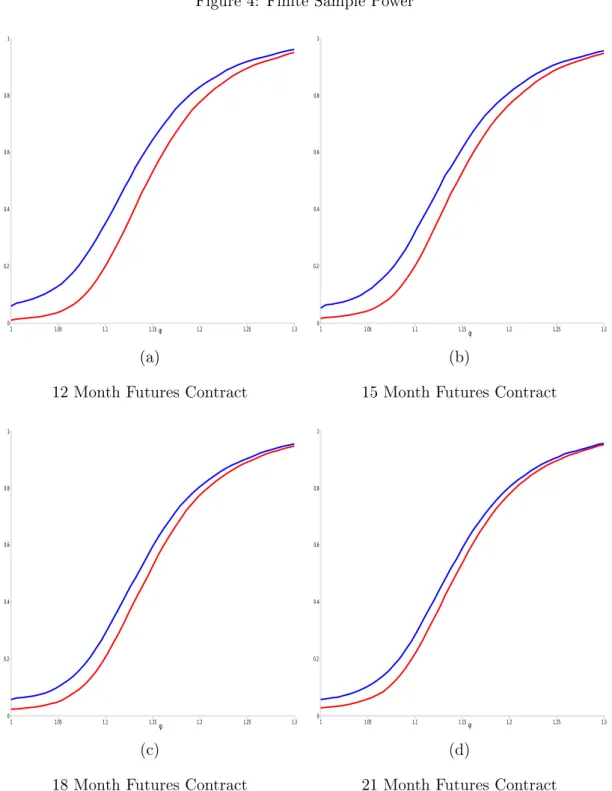
3.6.2 Empirical Power . . . 77
3.7 Empirical Application . . . 78
3.7.1 Testing for Autocorrelation . . . 82
3.8 Conclusion . . . 83
3.9 Tables . . . 85
3.10 Figures . . . 89
4 Testing for Bubbles in Commodity Spot and Futures Using a Co-explosive Autoregression . . . 109
4.1 Introduction . . . 109
4.1.1 Cointegration in a Rational Expectations Framework . . . 109
4.1.2 Analysis of Coexplosive and Cointegrated Processes . . . 110
4.1.3 Recent Unit Root Tests for Explosive Behaviour . . . 112
4.2 The Model and Assumptions . . . 116
4.2.1 The VAR Model . . . 117
4.2.2 The Cointegrated VAR Model . . . 117
4.2.3 The Coexplosive VAR Model . . . 117
4.3 The Granger-Johansen Representation . . . 119
4.4 Statistical Analysis and Hypothesis Testing . . . 120
4.5 Limit Theory . . . 122
4.6 Empirical Application . . . 123
4.6.1 Data . . . 123
4.6.3 Coexplosiveness: the contemporaneous case . . . 124
4.6.4 Coexplosiveness: the non-contemporaneous case . . . 125
4.6.5 Causality Testing . . . 128
4.6.6 Unit Root Testing for Rational Bubbles . . . 130
4.7 Conclusion . . . 134
4.8 Tables . . . 137
4.9 Figures . . . 146
5 Concluding Remarks . . . 155
5.1 Future Research . . . 158
A Appendix The Limit Theory of the CGSADF and the bootstrap CGSADF test . . . 160
1 Finite Sample Size . . . 56
2 Full Sample Unit Root Test . . . 57
3 Bubble Date Stamping . . . 58
4 Finite Sample Size . . . 86
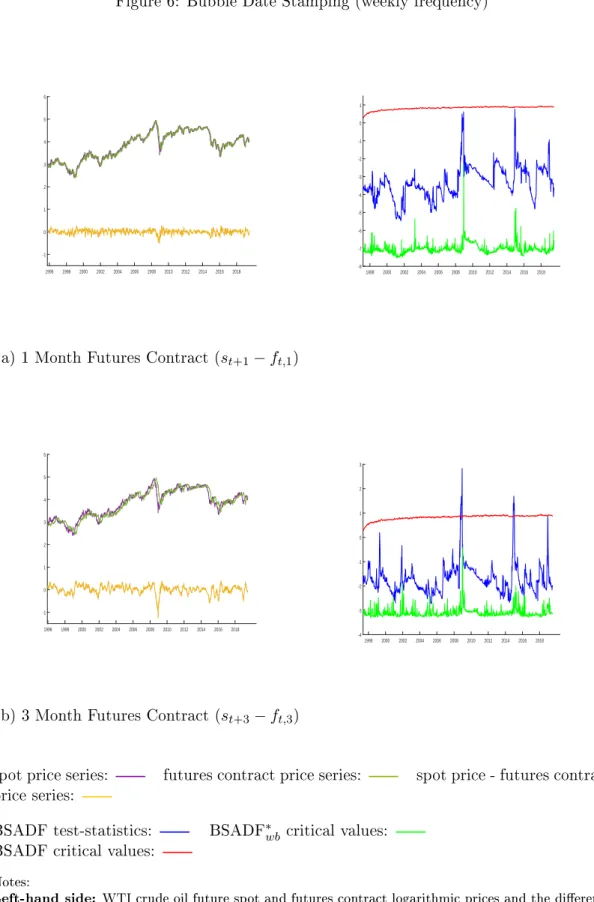
5 Bubble Date Stamping (weekly frequency) . . . 87
6 Bubble Date Stamping (monthly frequency) . . . 88
7 Cointegration rank determination for the period July 2007 to July 2008, contemporaneous series . . . 138
8 Cointegration rank determination for the period July 2007 to July 2008, non-contemporaneous series (lags) . . . 139
9 Cointegration rank determination for the period November 2015 to Febru-ary 2016, contemporaneous series . . . 140
10 Cointegration rank determination for the period November 2015 to Febru-ary 2016, non-contemporaneous series (lags) . . . 141
11 Characteristic Roots . . . 142
12 Granger Causality test . . . 143
13 Unit Root Tests . . . 144
14 Bubble Explosion Date Stamping . . . 145
15 Bubble Implosion Date Stamping . . . 145
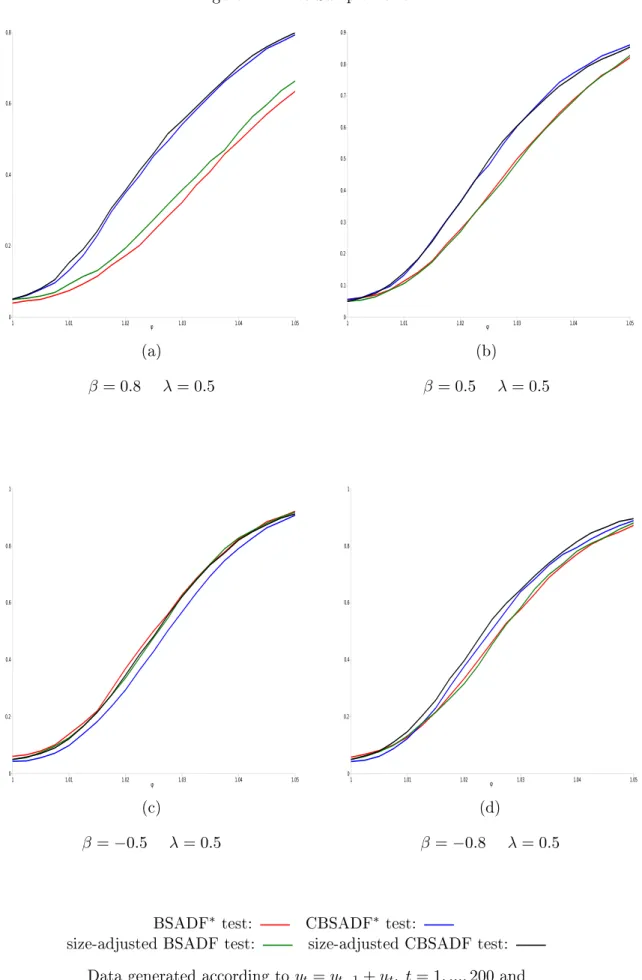
1 Finite Sample Power . . . 60
2 Finite Sample Power . . . 61
3 Finite Sample Power . . . 90
4 Finite Sample Power . . . 91
5 Finite Sample Power . . . 92
6 Bubble Date Stamping (weekly frequency) . . . 93
7 Bubble Date Stamping (weekly frequency) . . . 94
8 Bubble Date Stamping (weekly frequency) . . . 95
9 Bubble Date Stamping (weekly frequency) . . . 96
10 Bubble Date Stamping (weekly frequency) . . . 97
11 Bubble Date Stamping (monthly frequency) . . . 98
12 Bubble Date Stamping (monthly frequency) . . . 99
13 Bubble Date Stamping (monthly frequency) . . . 100
14 Bubble Date Stamping (monthly frequency) . . . 101
15 Bubble Date Stamping (monthly frequency) . . . 102
16 Sample Autocorrelation Function (weekly frequency) . . . 103
17 Sample Autocorrelation Function (weekly frequency) . . . 104
18 Sample Autocorrelation Function (weekly frequency) . . . 105
19 Sample Autocorrelation Function (monthly frequency) . . . 106
20 Sample Autocorrelation Function (monthly frequency) . . . 107
21 Sample Autocorrelation Function (monthly frequency) . . . 108
22 WTI crude oil prices . . . 147
23 Johansen Cointegration Test on WTI crude oil prices . . . 148
24 Bubble Explosion Date Stamping . . . 149
25 Bubble Explosion Date Stamping . . . 150
26 Bubble Explosion Date Stamping . . . 151
27 Bubble Implosion Date Stamping . . . 152
28 Bubble Implosion Date Stamping . . . 153
29 Bubble Implosion Date Stamping . . . 154
1 Introduction
Asset price bubbles have recently attracted signicant interest in the nance literature as their collapse has a signicant impact on the real economy. According to economic theory, an asset bubble can be dened as a prolonged period of substantial price devia-tions from a fundamental value (see inter alia Blanchard and Watson 1982, Campbell, Lo and MacKinlay 1997 and Homm and Breitung 2012). Price misalignments lead in-vestors to pay a higher price (than justied by fundamentals) for an asset, expecting to sell the asset at an even greater price in the future and generate a prot. In a bubble regime, there is a high volume of trading, in contrast to normal market conditions (Ofek and Richardson 2003). Subsequently, positive feedback mechanisms result in further ination of the equilibrium price.
Historical episodes of price bubbles have been well documented in literature, see inter alia Galbraith (1997), Kindleberger and Aliber (2005), and Sornette (2003b). The earliest known bubble episode in the nancial history is known as Tulip Mania and took place in the Netherlands during the 17th century. In the 18th century, the rst signicant market crash in the British stock market occurred, driven by what is known as the South Sea Bubble; a result of excessive speculation by the South Sea Company that had monopolistic rights to shipping and trading activities with South America (Sornette 2003b). A similar bubble episode occurred in France over the exact same period. In this case, banks excessively issued bank notes which were not equivalent to their gold and silver reserves. In 1720, the market crashed and this event is known historically as the Mississippi Bubble (Kindleberger and Aliber 2005).
Moving into the twentieth century, during the Roaring 20s the U.S. economy was thriving mainly as a result of new technological innovations and industrialisation. In 1929, the Federal Reserve of the U.S. attempted to calm down the market through implementing tight monetary policy. Panic resulted in a massive liquidation of shares, margin investors went bankrupt and major banks were driven into default since they had invested depositors' money, leading to a recession that lasted almost four years, known as Great Depression. At the beginning of the Great Moderation there is the market crash of October 1987, referred to as Black Monday, came after a period of euphoria in capital markets as a result of low interest rates, mergers and acquisitions, hostile takeovers and
leverage buyouts. The Federal Reserve of the U.S. increased interest rates and made access to funding extremely unaordable. Computer trading (sell orders after losses), derivative securities, liquidity problems, huge trade and budget decits and overvaluation combined with austere monetary policy led two of the largest capitalisation indexes in the U.S. (S&P 500 and Dow Jones) to a decline of more than 20% of their value (Sornette 2003b).
The term "dot-com" bubble or "tech" bubble is widely used to describe the last few years of the 1990s, a decade when the stock prices of internet rms escalated to extremely high levels. In a short period of time, hundreds of thousands of small-medium sized rms raised capital through IPOs despite cash ow issues, taking advantage of the enthusiasm of capital markets participants to fund internet rms. During the early 2000s, investors realised that the price of many internet stocks was well above their fundamental value, with the price of these stocks subsequently crashing, resulting in a mild recession for the U.S economy, despite the eort of the Federal Reserve of the U.S. to decrease interest rates (Ofek and Richardson 2003, and Kindleberger and Aliber 2005).
More recently, the global nancial crisis of 2007-2008 has been triggered by the sub-prime mortgage market crash (Akerlof and Shiller 2009). Due to the deep integration of the capital and money markets nowadays, the exuberance was transmitted from the nancial markets (commodities, exchange rates, stock exchanges etc.) to the real econ-omy. At the end of 2006, the mortgage backed security market reached extremely high levels of volume and at the same time, the majority of debtholders were unable to pay-back their debt leading to delinquencies and foreclosures. Investors lost trust, liquidity sank and the nancial system, especially investment and commercial banks, collapsed. The contagion propagated to commodities, real exchange, xed income and oil markets as investors selectively transferred their assets to other investments. This global nancial crisis drove the majority of the developed countries into recession (Phillips & Yu, 2011). Akerlof and Shiller (2009) attribute the recent global nancial crash to the breakdown of the nancial system and especially of structured nancial products, the high leverage and capital loss of the nancial institutions and the already-agreed credit lines between the banks and their clients.
The main focus this thesis is on identifying explosive episodes in nancial time series. Our approach is twofold. At rst, we concentrate on improving the size and power
performance of the Phillips et al. (2015) tests by including covariates (Chapter 2) and by applying a wild bootstrap procedure (Chapter 3) to the standard Phillips et al. (2015) tests. Then, we emphasize on long-term relationships between assets and we study the existence of an explosive root in a cointegrating relationship between two nancial series (Chapter 4).
In particular, putting emphasis on the early detection of asset price bubbles in Chap-ter 2, we investigate whether the power of right-tailed Dickey-Fuller unit root test pro-cedures can be improved by the inclusion of relevant covariates. Choosing to test for a bubble in a univariate framework can lead to potential power reductions since ignoring any correlation with other time series could possibly have a negative impact on the ex-planatory power of standard unit root tests leading to signicant power losses (Hansen, 1995). Applying sub-sample techniques may result in imprecise estimation of the nui-sance parameter introducing additional variability and causing severe size distortions (Chang, Sickles and Song 2017). Dealing with a nuisance dependency problem, we ap-ply a bootstrap procedure ensuring the asymptotic validity of the critical values from the distribution of the test statistics that lead to improved size and power performance in nite samples. In our empirical exercise, we manage to detect earlier two major explosive episodes: the Black Monday of October 1987 and the dot-com bubble.
On the same framework, examining the size and power properties of right-tailed Dickey-Fuller unit root test processes when testing for market eciency in the commod-ity markets in Chapter 3, we apply a wild bootstrap approach to Phillips et al. (2015) tests to account for potential heteroskedasticity that resembles the pattern of structural breaks, regime changes or volatility breaks oering robust critical values. In fact, the wild bootstrap test appears to control for size better than the non-bootstrap test while the power performance is signicantly improved as we model the series of interest as a moving average process rather than a unit root process since under the null hypothesis of market eciency the expected future spot price should equal the price of the futures contract. Applying the test empirically, we identify the 2007-2008 oil price run-up and the 2014-2015 oil price collapse while the conventional test of Phillips et al. (2015) does either not identify any episode at all or identies the episode with delay, reecting the superior power of our proposed wild bootstrap test to eectively identify such episodes. Following a VAR approach in Chapter 4, we allow for explosive roots as suggested by
Nielsen (2010) while testing for cointegration oering the advantage of performing the cointegration analysis of Johansen (1991) even in the presence of explosive behaviour in the related series. Looking into the WTI crude oil market, we nd that both oil prices
of spot and futures contracts areI(1, x)processes and the two variables cointegrate such
that their linear combination is anI(0)process for the period July 2007-July 2008. Our
empirical ndings are in accordance to Pavlidis et al. (2017) since there is no statistical evidence of explosive behaviour on the dierences between the future spot price and the
futures contract price for that period and therefore the linear relationship is stationary.1
Chapter 5 concludes and discusses some avenues for future research.
1The notation I(1, x) stands for variables with both explosive and random walk components and
1.1 Bootstrap Unit Root Testing for Explosive Behaviour using Co-variates
The identication of asset price bubbles is clearly of great interest for both theorists and empirical researchers. Recently, many econometric techniques have been developed for bubble detection in the context of time series analysis. Cointegration analysis, for instance, has been applied as one of the main testing approaches assessing price devia-tions from equilibrium (see inter alia Campbell and Shiller 1987, Campbell and Shiller 1988a and Campbell and Shiller 1988b). In a rational bubble regime, the equilibrium condition between the asset price and its market fundamental is violated. Therefore, non-stationary deviations from the general equilibrium in the long term provide evi-dence in favour of a bubble. Non-stationary behaviour is examined in the logarithmic transformation of the price dividend ratio through unit root testing as well; if the divi-dend yield is integrated of order one, then this could be considered as a strong evidence of a rational bubble (Campbell and Shiller 1987). The rational expectations theory per-ceives (rational) bubbles as anticipated phenomena where their expected value of next period depends on the compounded value of the bubble at time zero. In other words, the value of a bubble today equals the discounted value of future bubble episodes.
With the need for early detection of asset price bubbles apparent, this chapter intends to investigate whether the power of right-tailed Dickey-Fuller unit root test procedures can be enhanced by the inclusion of relevant covariates. If choosing to test for a bubble in a univariate framework, examining a variable in isolation can be rather costly in terms of power since ignoring any correlation with other time series could possibly weaken the explanatory power of standard unit root tests leading to signicant power losses (Hansen, 1995).
Our proposed Covariate Augmented Dickey Fuller unit root test is applied in a backward supremum sequence as suggested by Phillips et al. (2015) to detect explosive episodes that occur at the end of the sample. Applying sub-sample techniques can, however, lead to imprecise estimation of the nuisance parameter introducing additional variability and causing severe size distortions (Chang, Sickles and Song 2017). To deal with the nuisance dependency problem we apply a bootstrap procedure, ensuring the asymptotic validity of the critical values drawn from the bootstrap distribution of the test statistics. We concentrate on the case where the explosive episode takes place at the
end of the sample to date-stamp bubbles in real time. The simulations show that the proposed bootstrap tests oer impressive size and power performance in nite samples. In particular, the bootstrap tests appear to be less size distorted compared to the non-bootstrap conventional unit root tests and the inclusion of covariates in the standard Augmented Dickey Fuller regression model oers signicant power gains.
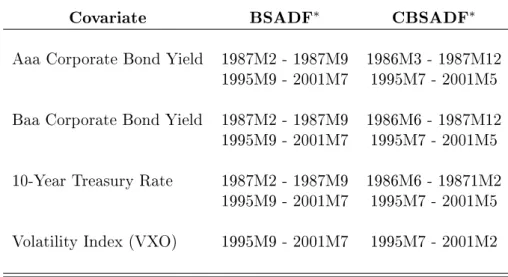
We conduct empirical work to investigate the eectiveness of the proposed tests on the early identication of bubble episodes. Specically, we examine whether our proposed tests would have detected known past bubbles in the S&P 500 price dividend series before the tests of Phillips et al. (2015) when used as an early warning mechanism, utilising the Moody's Seasoned Aaa and Baa Corporate Bond Yields, the Ten-Year Treasury Rate and the Volatility Index (VXO) as covariates. The superiority of our proposed test is reected on the earlier detection of two major explosive episodes: Black Monday of October 1987 and the dot-com bubble.
1.2 Wild Bootstrap Testing for Speculative Bubbles Using Spot and Futures Prices
A large number of studies has recently focused on studying asset bubbles as their col-lapses can have signicant impact on the real economy whereas the identication and dating of the bubble episodes is of particular importance for investors, policy makers and central banks. One aspect of asset bubbles that is particularly interesting for academics and researchers are asset bubbles that hold in a rational expectations framework. In this framework, real asset prices should be equal to the present value of the future cash ows, the fundamentals, that the asset generates, augmented by a bubble component that grows with the real interest rate in the presence of rational bubbles.
Interestingly, Diba and Grossman (1988) tested for the presence of rational bubbles in stock prices, suggesting that persistent explosive behaviour that cannot be dierenced to stationary might indicate the existence of rational bubbles. Their approach has been subject to criticism by Evans (1991) on the grounds of the poor power performance of traditional unit root tests to identify explosive episodes that collapse periodically in the sample. More recently, literature has concentrated on applying right-tailed unit root tests to the level of a series with Phillips et al. (2011) introducing a forward recursive right-tailed supremum ADF test that has good power properties and is fairly simple to use. Since then, the weight of interest has been shifted to identifying bubble episodes on a real time basis rather than historical episodes. Phillips et al. (2015) propose a backward recursive right-tailed supremum ADF test that is rather useful on date-stamping past bubble episodes and a generalised double-recursive right-tailed supremum ADF test that has better size and power performance in identifying multiple bubble episodes in the sample.
Stressing out the importance of early identication of asset bubble episodes, this chapter intends to examine the size and power properties of right-tailed Dickey-Fuller unit root test processes when testing for market eciency in the commodity markets by applying a wild bootstrap approach to Phillips et al. (2015) tests to account for poten-tial heteroskedasticity that might be attributed to structural breaks, regime changes or volatility breaks as the wild bootstrap procedure can resemble the behaviour of a time series that has heteroskedastic innovation terms while oering robust critical values. For this reason, we model the series of interest as a moving average process rather than a unit
root process since under the null hypothesis of market eciency the dierence between the future spot price and the futures contract price will be a moving average process of order determined by the length of the futures contract.
We concentrate on the case where the explosive episode occurs at the end of the sample to identify these episodes in real time. The simulations results show that the proposed wild bootstrap test oers better size control and power performance in nite samples since the standard backward recursive right-tailed supremum ADF test considers that the series is a unit root process under the null hypothesis when the series is in fact stationary, whereas the wild bootstrap implementation of the backward recursive right-tailed supremum ADF test simulates critical values under the null hypothesis that the series is a moving average process with the order of that process depending on the length of the futures contract.
Particularly, the wild bootstrap test appears to be less size distorted compared to the non-bootstrap test while the power gains are signicantly higher. In the empirical exercise, testing for market eciency in the commodity markets we apply the proposed and extant tests on the dierence between the WTI crude oil future price and the price of nine futures contracts across dierent maturities over the period September 1995 to July 2019. Focusing mainly on the 2007-2008 oil price run-up and the 2014-2015 oil price collapse, our proposed test identies the two episodes while the conventional test of Phillips et al. (2015) does either not identify an episode at all, or identify the origination day of the episode with delay reecting the superior power of our proposed wild bootstrap test to eectively identify episodes of non-stationarity that occur at the end of the sample. The proposed test suggests periods of market ineciency prior to the existence of the bubble episode as identied by the conventional tests.
1.3 Testing for Bubbles in Commodity Spot and Futures Using a Co-explosive Autoregression
Recent unprecedented imbalances in the nancial markets have attracted signicant in-terest from professionals, regulators and a growing number of academics as they might exhibit asset bubble characteristics. In contrast to the consensus that in time-series econometrics, variables are either stationary or second order integrated, speculative bub-bles in prices result in an explosive root in addition to a unit root making testing for cointegration and statistical inference rather inconclusive.
In the econometrics literature, it is commonly argued that the existence of speculative bubbles imply no cointegration between prices and fundamentals (see inter alia Diba and Grossman 1988b). In contrast, in the presence of speculative bubbles, prices and fundamentals can be cointegrated so their linear combination does not contain a unit root while at the time there is an explosive root in the system (Nielsen 2010).
In a cointegration framework, both the explosive and unit root need to be tested. Nielsen (2010) suggests that the cointegrated vector autoregression introduced by Jo-hansen (1991) can be used in a context where some of the series are integrated of order greater than one. Therefore, even though one of the series might be explosive, the Jo-hansen (1991) cointegrated VAR model can still estimate the cointegrating relationship given, of course, that the two series are cointegrated. Nielsen (2010) introduces the idea of coexplosiveness to allow the standard cointegrated VAR models to test for the existence of bubbles. In particular, Nielsen (2010) proposes a VAR model that allows both unit roots and explosive characteristic roots, utilising the standard cointegration techniques introduced by Johansen (1991). The coexplosive and cointegrated vector au-toregressive model arises as a restriction to the standard VAR model and allows both a random walk and an explosive stochastic component with a characteristic root larger than one. In other words, the cointegrated VAR approach of Johansen (1991) oers the advantage of testing for a unit root between two series and simultaneously testing for an explosive root in at least the one of the two series (Nielsen 2010).
This approach contradicts Diba and Grossman (1988) on the fact that two series can be cointegrated and yet, their linear combination might contain an explosive component (Engsted 2006). As a result, the VAR approach developed by Johansen (1991) oers the advantage of testing for stationarity while simultaneously testing whether at least
one of the variables has an explosive characteristic root since testing for the number of cointegrating vectors in the coexplosive case is similar to the standard Johansen (1991) procedure. The reason for this is that the asymptotic distribution of the likelihood ratio test when there is an explosive root is the same as in the standard Johansen cointegration test (Nielsen 2010).
In this chapter we utilise the application of Nielsen (2010) approach to test for coin-tegrating relationships across dierent series while simultaneously testing whether the series contain any explosive components, allowing to perform the cointegration analysis of Johansen (1991) even in the presence of explosive behaviour in the related series. Particularly, we utilise Johansen's cointegration rank test to analyse the oil price run-up in the WTI crude oil market between July 2007 and July 2008 as this period is indicated as explosive as well as the oil price collapse between November 2015 and February 2016, contributing to the debate of whether the 2007-2008 oil price run-up can be attributed to the existence of a speculative bubble as well as whether the oil price collapse of 2014-2015 exhibits any characteristics of bubble implosion.
We nd that in the contemporaneous case crude oil spot prices and all futures con-tracts contain both an explosive root and a unit root component from July 2007 to July 2008, whereas when we match the futures contract prices with the actual future spot prices then oil future prices of spot and the prices of the six month, twelve month and eighteen month futures contracts contain both an explosive root and a unit root component during this period.
Concerning the 2014-2015 crude oil price collapse we argue that contemporaneously, crude oil spot prices and the one month futures contract and crude oil spot prices and the three month futures contract contain both an explosive root and a unit root component between November 2015 and February 2016, whereas matching the futures contract prices with the actual future spot prices results in a single explosive root between the future spot prices and the three month futures contract therefore the system contains both an explosive root and a unit root component for this period.
Our empirical ndings suggest that both oil prices of spot and futures contracts are
I(1, x)processes and the two variables cointegrate such that their linear combination is
an I(0)process for the periods July 2007 to July 2008 and November 2015 to February
empirical literature that prices of spot and (short maturity) futures contracts should be cointegrated even when there is a bubble episode in the sample (Engsted 2006).
Investigating the oil price run-up of 2007-2008 and oil price collapse of 2014-2015 further, we extend our analysis to study Pavlidis et al. (2018), according to which it is the fundamentals that are responsible for the oil price run-up during the early 2000s and not the existence a speculative bubble. In particular, we apply the ADF, SADF and GSADF tests to the dierence between the future spot prices and futures contract prices across all dierent maturity contracts for the sample period September 1995 to July 2019. Our cointegration analysis seems to be in accordance to Pavlidis et al. (2017) since applying the BSADF test when the test is applied on the dierence between the future spot prices and the futures contract prices provides no statistical evidence of explosive behaviour between July 2007 and July 2008 and November 2015 to February 2016 that we identify coexplosiveness, implying that the linear relationship is stationary, although date-stamping only identies the origination date of the bubble episode with delay across futures contract with dierent maturities.
Applying a date-stamping technique to the dierence between the future spot prices and the futures contract prices results in a delayed identication of the origination date of the bubble oil episode of 2007-2008 providing no statistical evidence of explosive behaviour between July 2007 and July 2008. Furthermore, applying the same date-stamping technique to the reverse series of the dierence between the future spot prices and the futures contract prices results in a delayed identication of the origination date of the oil price collapse episode of 2014-2015 providing no statistical evidence of explosive behaviour (in the reverse series, therefore no market collapse in the original series as in Phillips and Shi, 2018) between November 2015 and February 2016. These ndings are in support of our evidence that during the peak of the oil price run-up of 2007-2008 and the oil price collapse of 2014-2015, crude oil future spot prices and futures contract prices are cointegrated, therefore their linear relationship is stationary and since the characteristic roots of their VAR model are, in some cases, explosive we conclude that
oil prices of the spot and futures contract coexplode during these two periods.2
The results of this chapter seem to be in line with the standard present value model
2Note that coexplosiveness in the reverse series means that the two series collapse together so that
their cointegrating relationship still holds, they co-implode. During the period November 2015 and February 2016 we nd coexplosiveness in the reverse series of the dierence between the future spot prices and the futures contract prices and therefore co-implosiveness in the original (non-reversed) series.
as augmented by a bubble component to account for a rational bubble. The linear combination of spot and futures contract prices contains an explosive root as a result of a speculative bubble. Examining variables in a bivariate framework might oer signicant advantages as bubble episodes emerging in the futures market might be transmitted in the spot market causing speculative bubbles and thus cointegration and coexplosive analysis can be proven very valuable in bubble identication.
1.4 Contribution to the extant literature
This thesis contributes to the extant literature in various ways. Firstly, the novelty of the second chapter is the suggestion of a multivariate approach to existent tests for bubble identication by introducing covariates in a recursive framework. We deal with, potential, imprecise estimation of the nuisance parameter that causes inaccurate statistical inference and severe size distortions due to sub-sample testing by applying a bootstrap technique ensuring the asymptotic validity of the critical values drawn from the bootstrap distribution. We improve the size and power performance of the existent tests while empirically we identify two historical episodes, namely the Black Monday of October 1987 and the dot-com bubble earlier compared to the bubble detection tests suggested in the econometrics literature.
In the third chapter, we consider a wild bootstrap approach to existent tests for bubble identication to account for the possibility of heteroskedastic residuals that can be attributed to breaks in volatility in order to study market eciency in the commodity markets. The simulation results suggest that the wild bootstrap test oers improved size control while oering signicant power gains as the series of interest has been modelled as a moving average process rather than a unit root process since under the null hypothesis of market eciency the dierence between the future spot price and the futures contract price will be a moving average process of order specied by the length of the futures contract. In the empirical application, our proposed wild bootstrap test identies periods of market ineciency prior to a bubble episode that existent bubble detection tests do not detect, acting as an early warning mechanism of non-stationary behaviour in the market that could, potentially, lead to a bubble episode.
In the forth chapter, we examine questions of bubble identication and market e-ciency using a bivariate approach, in contrast to the extant literature that studies asset price bubbles in a univariate framework. Firstly, we apply a co-explosive vector autore-gression to test whether the WTI crude oil price run-up of 2007-2008 and the oil price of collapse of 2014-2015 can be attributed to the existence of a bubble. We nd that there is an explosive root in the system and that oil spot and futures contract prices at vari-ous maturities, are cointegrated over that period. Secondly, we apply recent univariate bubble tests to test for market eciency. We conclude with an evaluation regarding the most appropriate approach to bubble identication in commodity markets.
2 Bootstrap Unit Root Testing for Explosive Behaviour
Us-ing Covariates
2.1 Introduction
Financial bubbles have recently attracted a considerable amount of research work in both the economics and nancial literature. A nancial bubble is commonly dened as a sudden, continuous rise of the price of one or multiple assets. Speculators' activity triggers further rises of the price that results in a crash due to reversals of expectations (Kindleberger 1987).
2.1.1 Theory
Under the assumption of a rational bubble regime, the real price of an asset equals the present value of its relevant fundamentals (Lucas 1978) e.g. dividends (i.e. expected
value of future cash ows).3 In their seminal work, Campbell and Shiller (1987) have
meticulously studied the validity of this present value model assuming either a constant
discount rate and implying that the two series are cointegrated4, under the assumption
that the transversality condition5 holds, or a time-varying one, arguing that in this case
the logarithmic dierence between prices and dividends is stationary.
The persistent failure of the present value models to justify deviations from fun-damentals that lead to bubbles resulted in the development of methods for detecting explosive episodes that mainly focus on the rational bubble assumption.
2.1.2 Early Tests on Bubbles
In that framework, Shiller (1981) suggests a methodology that takes into account the variance bounds of stock prices to evaluate the present value model. However, this approach can only provide point estimates of variance and therefore hypothesis testing cannot be utilised. For this reason, LeRoy and Porter (1981) generate estimates of variances for stock prices and dividends in a bivariate framework. Although this method
3Deviations from equilibrium due to non-fundamental determinants can as well be integrated into
the standard present value model by dropping the transversality condition.
4Therefore drifts away from fundamentals are corrected in the long-run.
5The transversality condition provides a unique solution of the present value model, thus the equity
price equals the market fundamental price whereas in case that the condition does not hold a set of solutions are given.
was not initially designed for bubble testing, useful implications can be derived when in a bubble regime, the variance of the asset price exceeds the variance justied by fundamentals. However, the variance bound tests as proposed by Shiller (1981) are subject to criticism; Flood and Hodrick (1986) argue that these particular tests are not appropriate for bubble testing and might mislead by providing evidence for bubble existence due to misspecication errors and (or) incorrect modelling of expectations.
First to introduce bubbles in the alternative hypothesis, West (1987) presents a two-step test which requires the specication of an equilibrium model and investigates the impact of the fundamental value on the asset price, given the Euler equation as a no-arbitrage asset pricing model. The dierence between the two estimates (the actual and the constructed one) of the eect of dividends on the asset price can be attributed to either model misspecication or bubble. Flood et al. (1994) criticise this approach emphasising that even after performing the misspecication tests, rejections might be justied by other factors such as the inadequacy of the rational models to explain bubbles or the invalidity of the standard asymptotic inference resulting from the non-ergodic data generation processes.
From what stated above, it is clear that conventional univariate econometric tech-niques suer from a series of problems such as omitted variable biases which might lead to the rejection of the null hypothesis of no bubble (Flood and Garber 1980), model misspecications or inconsistent statistical tests (Flood and Hodrick 1986), low power on identifying rational bubbles, especially in a periodically collapsing framework (Evans 1991), and (or) size distortions and low power (see inter alia Stock, 1991, Campbell and Perron 1991, Domowitz and El-Gamal 2001).
In their seminal research, Diba and Grossman (1988) highlight the signicance of unit root testing into rational bubble detection. They introduce a standard left-tailed unit root process to test for the null hypothesis of a random walk, under the assumption of a time-invariant discount rate to argue that there is no evidence of bubble existence if both stock prices and dividends are non-stationary in levels but stationary in dierences. Furthermore, Diba and Grossman (1988) apply standard unit root tests to the real S&P 500 stock price index between 1871 and 1986, nding that stock prices and dividends are non-stationary in levels but stationary in dierences, concluding that a rational asset bubble can be identied when a time series cannot be dierentiated to stationarity, due to
the explosiveness of the dataset. In the context of longer-term relationships between two
variables, Diba and Grossman (1988) utilise the Bharghava (1986) ratios6 to conclude
that evidence of cointegration indicates no bubble, in disagreement with Evans (1991) who argues that traditional unit root tests are non-capable of capturing complex bubble characteristics due to the non-linear structure of the bubble models.
Hall et al. (1999) suggest a generalised version of the ADF test which incorpo-rates the dynamic Markov regime-switching models as proposed by Hamilton (1989) and Hamilton (1990). This approach is consistent with the argument that an explo-sive autoregresexplo-sive root indicates the existence of rational bubbles. Furthermore, Van Norden and Vigfusson (1998) argue that size distortion has a considerable impact on regime-switching models and suggest the utilisation of the Van Norden (1996) test in-stead, which assess the switching probabilities depending on the size of the bubble. The benets of introducing stochastic regime-switching models into the bubble identica-tion process are pointed out by Drill and Sola (1998) who advocate that deviaidentica-tions of stock prices from fundamentals can be perceived as shifts in fundamentals due to regime change and not as bubble phenomena. However, there is evidence that Markov-switching models might infer false detection or spurious explosiveness (Shi 2013).
Several research work has focused on cointegration, long memory and persistence. Campbell and Shiller (1987) introduce the idea of cointegration between stock prices and dividends as an evidence of no bubble. In the case of a rational bubble, the long-term relationship between prices and fundamentals (e.g dividends) is violated and prices move away from equilibrium for a prolonged period of time. Mixed results in their empirical part lead Campbell and Shiller (1987) to conclude that the drifts away from fundamentals are quite persistent, although highly sensitive to the discount rate.
In a fractional integration framework, Cuñado et al. (2005) follow a fractionally integrated methodology in stock prices and dividends of NASDAQ to conclude that the sampling frequency of the data aects the statistical inference of bubble existence. In particular, testing by using daily and weekly data provides evidence of fractional coin-tegration, since the order of integration lies between zero and one whereas testing at monthly frequency results in no rejection of the unit root hypothesis of no cointegra-tion. The authors attribute this distortion to either bias resulting from the usage of
low-frequency data, known as the temporal aggregation problem or sample size. This bias might lead to wrong inference of slow convergence or random walk (Taylor, 2001). Persistent trend-cyclical behaviour seems to fade out when the same data are examined for longer periods (Mandelbrot, 1969).
In the same framework, Koustas and Serletis (2005) apply fractional integration tech-niques in the logarithmic dividend yield of the S&P 500 nding evidence of long memory against rejecting the null hypothesis of a rational bubble. On the contrary, Frömmel and Kruse (2012) criticise the methodology proposed by Koustas and Serletis (2005) argu-ing that possible structural breaks are not taken into consideration and they suggest a test for changing persistence under fractional integration based on Sibbertsen and Kruse (2009) accounting for both long memory and changing persistence, combining structural breaks and unit root testing in accordance to Demetrescu et al. (2008). Gürkaynak (2008) emphasises that the degree of integration of the unobservable fundamentals can be greater than one, explaining the inference of non-stationarity.
Moving from rational bubbles, Froot and Obstfeld (1991) introduce the concept of intrinsic bubbles, dened as episodes of exuberance caused by exogenous economic fundamentals to describe nonlinear uctuations in asset prices. They empirically test the proposed model in the US stock exchange market and attribute the existence of bubbles to the nonlinearities between equity and stock prices, arguing that the proposed tests utilise estimates consistent under both the null and the alternative hypothesis.
Extending Campbell and Shiller's (1987) cointegration restriction by imposing a robust no rational bubble constraint which does require neither a constant discount factor nor a specic asset pricing model, Craine (1993) provides evidence that the discount factor for the S&P 500 can be non-stationary and therefore any inference of bubble might be misleading.
2.1.3 Recent Tests on Bubbles
Traditional unit root tests may lead to spurious indications of explosive behaviour in the presence of non-stationary volatility. Cavaliere and Taylor (2008) suggest a new set of approaches to unit root testing which deal with permanent volatility shifts. Particularly, rather than performing the ADF tests directly on the original time series, they implement these tests on the inverted time transformation of the original time series resulting in
good power gain. Furthermore, Cavaliere and Taylor (2009), investigate the case of a near-unit-root process under the assumption of non-stationary autoregressive volatility. In particular, under weak dependence they suggest a wild bootstrap method and provide empirical evidence in accordance to the proposed methodology which performs good under the presence of near-integrated autoregressive stochastic volatility with leverage eects.
The power properties of the unit root tests are of particular interest. Leybourne (1995) introduces a joint test which employs both a reverse and a forward ADF unit root test, taking advantage of the fact that under the null hypothesis both tests are marginally asymptotically distributed in an identical way, however there is no perfect correlation due to the dierent ending points of the time series examined (Leybourne & Taylor 2003). The proposed methodology of Leybourne (1995) chooses the maximum value of the forward and reverse ADF test-statistics and rejects the null hypothesis more often compared to the standard ADF test. Furthermore, Leybourne (1995) compares this joint max ADF test with the standard ADF test to demonstrate that it oers signicant power gains with similar size properties. Forward and reverse estimation is of particular usefulness in seasonal unit root testing as well. Leybourne and Taylor (2003) introduce a combination of the Hylleberg et al. (1990) seasonal unit root testing (HEGY) for both the forward and reverse processes. Testing on the power and nite-size properties of the new model through Monte Carlo simulations, they infer that the inclusion of the Leybourne (1995) joint test into seasonal unit root testing oers superior size and power gains compared to other OLS or weighted symmetric least squares (WSLS) processes.
Examining the asymptotic distribution of a random walk, Abadir and Lucas (2000) use the unit root M-tests to derive the limit theory that depends on a nuisance pa-rameter. Furthermore, they argue that in the random walk case the limit distribution does not follow a standard normal distribution but a skewed one instead, highlighting a nuisance dependency problem and they derive a normal approximation for the quan-tiles of the test-statistics that are based on robust unit root M-estimators. Following Elliott (1998), Magdalinos and Phillips (2009) highlight the problem of asymptotic bias of integrated, near-integrated or explosive regressors and provide limit theory, extending Phillips and Magdalinos (2008) theory for cointegrated systems that are fully explosive. The relationship between the explosive regressors denes the asymptotic behaviour of
the least squares estimator of the cointegrating coecients. Furthermore, Magdalinos and Phillips (2009) show that in the moderately explosive case, the OLS regression pro-cess is asymptotically median unbiased and the limit theory is mixed normal. Finally, they highlight that in a moderately explosive framework the regressors might appear to be explosively cointegrated due to contagion eects on other variables.
Recent research focuses on right-tailed unit root tests, which have the property of de-tecting mildly explosive or sub-martingale behaviour in time series by putting emphasis on the alternative hypothesis of explosiveness. Phillips et al. (2011) introduce the argu-ment that explosiveness in asset prices and not in fundaargu-mentals may indicate a bubble episode, suggesting a forward recursive right-tailed supremum Augmented Dickey-Fuller (SADF) test, capable of detecting ongoing bubbles. Phillips et al. (2011) apply this test on the NASDAQ stock price and dividend index, nding evidence of the dot-com bubble in the early 2000s. The main advantage of the Phillips et al. (2011) methodology is that it can be successfully utilised not only in stock prices but in commodity future prices (Gilbert 2010), commodity and house prices (Homm and Breitung 2012), the ex-change rate market (Bettendorf and Chen 2013) and crude oil spot and future markets (Tsvetanov et al. 2016) as well.
Homm and Breitung (2012) perform simulations and investigate the power properties of a Chow-type Dickey-Fuller test, a modied version of the locally best invariant (LBI) test of Busetti and Taylor (2004) and the Phillips et al. (2011) test to conclude that the Phillips et al. (2011) methodology can be a powerful tool not only in a structural break environment but on identifying end-of-sample bubble episodes as well. Investigating the validity of the tests empirically, they nd strong evidence of explosiveness in the pre-2008 subprime mortgage downturn in the UK, US and Spanish house markets, in accordance to their main argument that bubble episodes occurred in multiple markets.
In a multiple bubble environment however, bubble detection can be challenging and the Phillips et al. (2011) unit root process may be less successful and powerful on identifying multiple bubble phenomena. The conventional Augmented Dickey-Fuller unit root test may infer pseudo stationarity; evidence of stationary behaviour when the data is non-stationary. In order to overcome these weaknesses of the Phillips et al. (2011) methodology in a multiple bubble regime, an extension of the Supremum ADF test is introduced. Phillips et al. (2015) construct the Phillips et al. (2015) test, a consistent
technique of identifying multiple bubbles with periodically collapsing behaviour not only in historical prices but on a real-time basis as well. In particular, they introduce two recursive window processes; a generalised and a backward version of the SADF test (GSADF and BSADF respectively).
According to Harvey et al. (2017) the power of the two tests mentioned above, depends on the location of the explosive regime and on whether there is a collapse inside the sample as well. In multiple bubble and collapses, the GSADF test outperforms, in terms of size and power, the conventional (Phillips et al. 2011) SADF test by recursively changing the starting and ending points of the sample covering more subsamples of the data. Furthermore the GSADF test is designed to detect the existence of one or more explosive episodes in a nancial time series that can occur anywhere in the sample. In addition, the GSADF can only show whether there is a bubble episode in the sample without indicating the location the episode occurs within the sample. The BSADF test is a backward recursive right-tailed ADF test and it is a more powerful detection tool of bubble episodes that occur at the end of the sample and has been developed by Phillips et al. (2015) for date-stamping of the origination and termination dates of the explosive episode.
Phillips et al. (2015) test empirically the validity of their proposed models to the S&P 500 stock price and dividend index between January 1871 and December 2010 and nd evidence of explosive behaviour by applying the GSADF test. Then they utilise the BSADF test for samples ending in each time period in order to date-stamp these events and they successfully detect more than six historical banking crises and bubble episodes in this time spam. However, there seems to be a delay bias in the detection of the explosive episodes in Phillips et al. (2015); Phillips and Shi (2018) argue that there is a delay on estimating the dates of crisis origination and market recovery dates and thus suggest a methodology based on "reverse regression" strategies. Focusing on various dierent ways of bubble implosion that mainly depend on the mature of the collapse and trying to deal with bias, Phillips and Shi (2018) incorporate a reverse sample-regression into the recursive window process of Phillips et al. (2015). At the same time they embody a market recovery parameter which is the date that asset prices return to equilibrium, on the Phillips et al. (2015) methodology and following Rosser (2000) and Huang et al. (2010), Phillips and Shi (2018) distinguish market crashes into "sudden",
"disturbing" and "smooth" reecting dierent ways of price decline. Furthermore, they dene market recovery as the date when the asset prices of a particular market return to their "normal martingale path" or alternatively to fundamentals (equilibrium). The innovation of this approach is that it dierentiates the date of the bubble implosion from the market recovery date, dening the latter as the ending point of the mildly unit root collapsing process. The reverse-regression strategy can oer valuable information in a multiple bubble framework where the number of explosive episodes and (or) collapses are not known in advance.
A main advantage of this methodology compared to the Harvey et al. (2012) and Harvey et al. (2015) test is that it is capable of estimating the amount of bubble episodes and crash points at the same time whereas the Harvey et al. (2012) and Harvey et al. (2015) approach requires the number of these episodes to be known beforehand. Testing their model on the NASDAQ stock market index for the period January 1973 to August 2013, Phillips and Shi (2018) uncover four dierent stages of the dot-com episode of explosive behaviour: the origination date (December 1996), the implosion date (February 2000), the market correction or recovery date (December 2000) and nally a further correction date (February to April 2004). The utilisation of the reverse-regression implementation strategy on the right-tailed unit root testing can oer signicant information on market recovery due to the high sensitivity of the right-tailed testing processes to deviations from equilibrium. Therefore, the reverse regression procedure can be considered as a real-time technical analysis of explosive episodes in nancial markets.
Moreover, Astill et al. (2017) account for conditional and unconditional heteroskedas-ticity and serial correlation on end-of-sample explosive episodes of nancial time series by introducing Andrews (2003) and Andrews and Kim (2006) end-of-sample instability tests. Their proposed methodology can oer signicant power gains compared to the BSADF test of Phillips et al. (2015) and can be utilised as an early-detection mechanism of end-of-sample bubble episodes.
As important as it is to detect periods of explosiveness, it is crucial as well to be able to assess the origination and termination of a bubble regime precisely. Harvey et al. (2012) introduce an alternative approach in right-tailed unit root testing by using the minimum sum of squared residuals estimators (see inter alia Bai and Perron 1998
and Kejriwal, Perron, and Zhou 2013) together with the Bayesian Information Criterion (BIC) for the optimum lag length selection. The proposed methodology can perform well in detecting bubbles that collapse within the sample as well as end-of-sample bubble episodes.
Phillips (2016) relates asset bubbles with the sentiments of heterogeneous investors who perceive fundamentals in dierent ways and therefore overreact (exuberant), under-react (cautious) or respond appropriately to changes in fundamentals (fundamentalists), whereas Lee and Phillips (2016) advocate that myopic investing introduces speculative behaviour into asset pricing and provide a nite investor horizon study. Although the validity of the standard present value model in the long term may be considered as given, the low power of the unit root tests, possible non-linear relationships, structural breaks and possible outliers may lead to rather ambiguous or mistaken inferences (Bohl and Sicklos 2004).
From what has been stated so far, we may argue the right-tailed unit root tests can be considered as quite powerful bubble detection mechanisms that succeed to detect not only past bubbles but bubble episodes that grow in real time as well. Nevertheless, in a univariate framework the convention to ignore any correlation with other time series may be costly; the exclusion of a correlated stationary covariate from the standard regression model could weaken the explanatory power of the unit root testing which would lead to signicant power losses (Hansen, 1995). Examining a variable in isolation is a rather simplistic approach in time series analysis and the inclusion of a highly correlated stationary variable could oer signicant reduction in error variance compared to the standard ADF test.
In addition, Hansen (1995) argues that with the existence of covariates, the critical values of the standard ADF test can lead to incorrect statistical inference. Additionally, as discussed later, the form of the asymptotic distribution of the conventional ADF test provides conservative asymptotic critical values and therefore the ADF test appears to have low power. Therefore, Hansen (1995) suggests using the rst dierences of a covari-ate before including it into the regression model in order to deal with non-stationarity and derives the asymptotic distribution of the covariate Augmented Dickey-Fuller (CADF) test, which is a convex combination of the standard Dickey-Fuller distribution and the normal distribution. By using a Monte Carlo simulation process in a no-deterministic
environment, Hansen (1995) concludes that the CADF is more powerful compared to the standard ADF test.
Although, it is widely known that the unit root testing processes suer from low power, the ADF test has the lowest size-adjusted power amongst the unit root tests, asymptotically and in nite samples, it provides the least size distortions as well (Stock
1994).7 Caporale and Pittis (1999) advocate that Hansen's (1995) CADF test succeeds
in achieving both great power gains and small size distortions, in contrast to the con-ventional unit root tests, resulting in less over-rejection of the alternative hypothesis of stationarity. Moreover, they provide theoretical evidence of reduction of the standard errors and coecient estimates that depends on the contemporaneous and temporal cor-relation structure of the errors and the stationary covariate. Furthermore, Caporale and Pittis (1999) argue that the value of the test-statistic of the CADF test will converge to that of the standard univariate ADF test where there is neither contemporaneous nor temporal correlation between the covariate and the error term. In addition, they
apply both the ADF and the CADF tests to the Nelson and Plosser (1982) dataset8 and
conclude that the inclusion of covariates might not only enhance the explanatory power of the model but reverse the presumption of unit root as well. This is in accordance to their argument that by using the CADF test, the power of the model can be improved with relatively small size distortions.
In a vector autoregressive framework, Elliott and Jansson (2003) extend the CADF test proposed by Hansen (1995) to account for the case where constants or time trends are included in the unit root regression model. In addition they suggest a likelihood-ratio-based approach in combination with a GLS demeaning/detrending process for the dependent variable and an OLS demeaning/detrending process for the covariate. West-erlund (2013) follows a similar GLS process combined with an ARCH to account for heteroskedasticity.
Chang, Sickles and Song (2017) bring the literature's attention to an important caveat; the limit distribution of the covariate ADF test depends on the correlation between the equation error and the covariate. Therefore, the nuisance parameter
de-7Stock (1994) develops a comparative study of univariate unit root tests with similar local asymptotic
power functions but dierent nite-sample behaviour to infer that the DF test-statistic exhibits the least size distortions (compared to other unit root tests), at the expense of low power.
8Nelson and Plosser (1982) perform the conventional ADF test to fourteen US macroeconomic time
series (e.g. GDP, employment) to infer that there is evidence of non-stationarity in all of them except unemployment.
pendency results in invalid statistical inference and large size distortions. In order to ensure the asymptotic validity of the critical values, they suggest a parametric boot-strap CADF test which improves the explanatory power of the model (especially in the case where the covariate is highly correlated with the error term), with no eect on the
size properties of the standard ADF test.9 Moreover, Chang, Sickles and Song (2017)
apply this bootstrap method to an extension of the Nelson and Plosser (1982) dataset and argue that the bootstrap CADF test can oer statistical gains compared to the sample CADF test due to the independence of bootstrapped critical values from the nuisance parameter. The extended Nelson-Plosser (1982) dataset was rstly introduced by Schotman and Van Dijk (1991) and it is widely used in macroeconomic analysis. The data series includes a variety of macroeconomic variables -the nominal and real GNP, employment, industrial production and money stock among others- as covariates. Additionally, Aristidou, Harvey and Leybourne (2017) consider a GLS-demean/detrend and an OLS-demean/detrend CADF approach in the existence of asymptotically non-negligible initial conditions in order to obtain ecient estimates and improve the power of the CADF test, as proposed by Elliott, Rothenberg and Stock (1996), which depends on the local asymptotic power and the magnitude of the initial conditions.
Nowadays, the weight has partially shifted from rational to irrational bubbles with behavioural nance attributing bubble detection to behavioural determinants such as mimetic and herding aspects of the investors' attitude (see inter alia Akerlof and Shiller 2009, Shiller 2015). Avery and Zemsky (1998) advocate that asset bubbles and excess volatility can be partially explained by herd behaviour. In particular, they examine whether herding can act as a triggering factor of a bubble crash and in contrast to the general conviction, they conclude that models of rational trading can indeed interpret herding and crashes. Abreu and Brunnermeier (2003) relate price bubbles to the asyn-chronous selling strategies of rational arbitrageurs as well as the dierent beliefs on the timing of the bubble burst.
Overall we can argue that the time-varying present value model can provide valuable information for the stock price behaviour in the long term (see inter alia Campbell and Shiller 1988 and Campbell and Shiller 1989) when in the short term, deviations from
9Chang, Sickles and Song (2017) consider the time trend case as well and demonstrate that the
inclusion of trend in the unit root regression equation results in power loss for all tests except the bootstrapped CADF test.
fundamentals can be attributed to non-fundamental determinants; speculative bubbles (West, 1987 and Evans, 1991), noise trading (Shleifer 2000), expansions and recessions in business activity (Phelps and Zoega 2001) or deviations that might lead to crashes (Charemza and Deadman 1995). The theoretical framework of behavioural characteris-tics such as overcondence, enthusiasm, greed, fear and panic can trigger the develop-ment of nancial bubbles and deviations from general equilibrium, has been developed by Akerlof and Shiller (2009).
In this chapter we examine whether the power and size performance of right-tailed Dickey-Fuller unit root test procedures can be enhanced by the inclusion of relevant co-variates. As argued by Hansen (1995), in a univariate framework examining a variable in isolation can lead to power reduction since ignoring information in correlated series could possibly weaken the explanatory power of the standard unit root tests. Furthermore, we apply the proposed Covariate Augmented Dickey Fuller unit root test in a backward supremum sequence as in Phillips et al. (2015) to identify explosive episodes that occur at the end of the sample. Sub-sample techniques can lead to imprecise estimation of the nuisance parameter introducing additional variability, causing severe size distortions as discussed in Chang, Sickles and Song (2017).
As a remedy to the nuisance dependency problem we apply a bootstrap procedure while ensuring the asymptotic validity of the critical values drawn from the bootstrap distribution of the test statistics. We put emphasis on the case where the explosive episode takes place at the end of the sample as date-stamping bubbles in real time can be of great usefulness to policy makers and central banks. The simulations suggest that the proposed bootstrap tests oer great size and power performance in nite samples as the bootstrap tests appear to be less size distorted compared to the non-bootstrap conventional unit root tests and therefore the inclusion of covariates in the standard Augmented Dickey Fuller regression model oers signicant power gains.
In our empirical application, we investigate whether our proposed tests would have detected known past bubbles in the S&P 500 price dividend series before the tests of Phillips et al. (2015) when used as an early warning mechanism, utilising the the Moody's Seasoned Aaa and Baa Corporate Bond Yields, the Ten-Year Treasury Rate and the Volatility Index (VXO) as covariates. The superiority of our proposed test is reected on the earlier detection of Black Monday of October 1987 and the dot-com
bubble.
In Section 2.1 we discuss some theory together with earlier and more recent devel-opments in the bubble identication literature. In Section 2.2 we outline the explosive nancial bubble model and in Sections 2.3 and 2.4 we review the extant covariate and recursive unit root tests respectively. In Section 2.5 we present our proposed tests, some limit theory and our bootstrap approach, whereas in Section 2.6 the nite and sam-ple size and power properties are examined by using Monte Carlo simulations and the relevant discussion takes place. Section 2.7 presents an empirical application of the pro-posed tests. Section 2.8 summarizes and concludes. Tables and Figures are presented in sections 2.9 and 2.10 respectively. Mathematical proofs are given in the Appendix.
In what follows p
→ denotes convergence in probability, →d denotes convergence in
distribution and b.c denotes the integer part of its argument. We denote k.k as the
Euclidean norm as well. For a vector z = zi, kzk2 := (Pizi2)1/2 and for a matrix
A= (aij) kAk2 := (Pi,ja2i,j)1/2.
2.2 The Model and Assumptions
Consider a time series process {yt} that consists of a purely deterministic component
and a stochastic component generated according to the following data generating process (DGP);
yt=dt+St, t= 1, ..., T, (2.1)
wheredt is the deterministic component and can be either equal to0 (neither constant,
nor trend),µ(constant but no trend) orµ+θt(constant and trend). The initial condition
y0 is assumed to be stochastically bounded and does not aect the subsequent analysis
in this paper. The stochastic component,{St}, is generated according to;
∆St=δSt−1+ut. (2.2)
The innovation sequence,{ut} is generated according to
α(L)ut=b(L)0∆xt+εt (2.3)
order p: α(z) = 1−Pp
k=1αkzpk and b(k) =
Pq
k=−rβkzk is a polynomial allowing for,
but not requiring, both leads and lags of ∆xt to enter the DGP.
In the context of testing the null hypothesis of a unit root against the alternative of stationarity Hansen (1995) combines (2.2) and (2.3) and proposes estimating the following regression by OLS
∆yt=d†t+δyt−1+ p X k=1 αk∆yt−k+ q X k=−r βk0∆xt−k+εt=:CADF(p, r, q). (2.4) where d†t = 0 ifdt= 0 −δµ ifdt=µ a(1)θ−δµ−δθ ifdt=µ+θt (2.5)
Following Chang, Sickles and Song (2017) we assume that the stationary covariates
∆xt are generated by anAR(`) process given by
Ψ(L)∆xt+r+1 =ηt, (2.6)
whereΨ(z) =Im−P`k=1Ψkzk.
We also make the following assumptions on the innovation sequenceξt= (εt, ηt0)0that
denes the correlation between the stationary covariates ∆xt and the series of interest
{yt}.
Assumption 2.1. (a) Let{ξt}be a martingale dierence sequence such thatE(ξtξt0) =
Σ and (1/T)PT
t=1ξtξt0 p
→ Σ with Σ> 0 and E|ξt|γ < K for some γ >4, where K is
some constant depending only upon γ
(b) α(z), det(Φ(z))6= 0 for all |z| ≤1
Remark 2.1. As noted by Chang, Sickles and Song (2017) Assumption 2.1(a) al-lows for conditional heteroskedasticity, including GARCH behaviour, in all equations
in the system including the covariates. By denition (εt) is uncorrelated with (ηt+k)