Study of Natural Aggregates and Testing of EPS
based Concrete
P. Punitha
Department of Civil and Structural Engineering, SCSVMV University, Kanchipuram-631561
Abstract: Recent technology has also improved the recycling process. This study aims to Testing of coarse aggregate by using concrete. In this research concrete With the increase in demand for construction materials, there is a strong need to utilize alternative materials for sustainable development. The main objective of this investigation is to study the properties, such as compressive strength and tensile strengths of lightweight concrete containing Expanded Polystyrene (EPS) beads. Its properties are compared with those of the normal concrete i.e., without EPS beads. EPS beads are used as partial replacement to coarse aggregates. Water absorption test, specific gravity test ,sieve analysis test, mix design, slump test, compressive strength test for all The major test are computed .
Keywords: sources of aggregate, coarse aggregate, testing of materials, EPS beads.
I. INTRODUCTION
A. General
In this chapter, the brief ofdescription of the methodology and the sequence of the work to be carried out in this complete duration of project are presented.
II. SOURCES OF NATURAL AGGREGATE
Igneous rock these rocks are primarily crystalline and are formed by the cooling of molten rock material beneath the earth’s crust (magma). Sedimentary rocks, these rocks are formed from depositing insoluble material (e.g., the remains of existing rock deposited on the bottom of an ocean or lake). This material is transformed to rock by heat and pressure. Sedimentary rocks are layered in appearance and are further classified based on their predominant mineral as calcareous (limestone, chalk). Aggregates can come from either natural or manufactured sources. Natural aggregates come from rock, of which there are three broad geological classifications. Siliceous (sandstone) or argillaceous (shale) metamorphic rock, These are igneous or sedimentary rocks that have been subjected to heat and/or pressure great enough to change their mineral structure so as to be different from the original rock. Aggregates are produced in a quarry or mine whose basic function is to convert in situ rock into aggregate with specified characteristics. Usually the rock is blasted or dug from the quarry walls, then reduced in size using a series of screens and crushers. Some quarries are also capable of washing the finished aggregate.
III. METHODOLOGY OF THE PROJECT
EPS is used for the project is available in packing factories. The percentage replacements of coarse aggregate by EPS have been replacement at 10%, 20% and 25% respectively. The W/C ratio for the various replacement of PPC has been investigated.
The casting specimen as tested as after 3days, 7days, 14days and 28days curing. The compressive test, split test and flexural strength of the specimens at various ages have been found out.
IV. EXPERIMENTAL INVESTIGATION:
A. Tests Carried Out For Physical Properties
1) Setting Time Test: Take 500 gm of cement sample and gauge it with 0.85 times the water required to produce cement past of standard consistency (0.85 mm). the paste shall be gauged and filled into the vicat mould is specified manner with 3-5minutes. Start the stop watch the moment water is added to the cement. The temperature of water and that of the test room, at the time of gauging shall be within 270 C.
3) Final Setting Time: Replace the needle of the vicat apparatus by a circular attachment. The cement shall be considered as finally set when, upon, lowering the attachment gently cover the surface of the test block, the center needle makes an impression, while the circular cutting edge of the attachment fails to do so. In other word the paste has attained such hardness that the center needle does not pierce through the paste more than 0.5mm.
V. SPECIFIC GRAVITY TEST
A. Specific Gravity Of Cement Test
Table 1 Specific gravity values of cement
1) Calculation: Specific gravity of cement = w2-w1 / (w4-w1) – (w3-w2) × 0.79
= 1303-675 / (1303-675) – (1775-1401) ×0.79
= 3.129
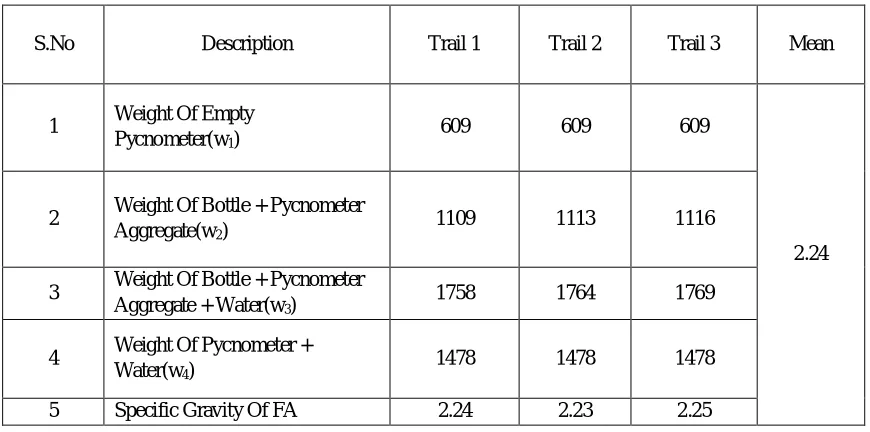
[image:2.595.81.516.460.676.2]B. Specific Gravity Of Fine Aggregate Test
Table 2 Specific gravity values of fine aggregate
1) Calculation: Specific gravity of fine aggregate = (w2-w1/ (w4-w1) – (w3-w2) =(1109-609)/((1174-906)-(1758-1109))
= 2.24
S.No Description Trail 1 Trail 2 Trail 3 Mean
1 Weight Of Empty Bottle (w1) 675 675 675
3.129 2 Weight Of Bottle + Cement
(w2)
1303 1309 1311
3 Weight Of Bottle + Kerosene +Cement (w3)
1775 1780 1783
4 Weight Of Bottle + Kerosene (w4)
1401 1401 1401
5 Specific Gravity Of Cement 3.129 3.147 3.169
S.No Description Trail 1 Trail 2 Trail 3 Mean
1 Weight Of Empty
Pycnometer(w1)
609 609 609
2.24 2 Weight Of Bottle + Pycnometer
Aggregate(w2)
1109 1113 1116
3 Weight Of Bottle + Pycnometer Aggregate + Water(w3)
1758 1764 1769
4 Weight Of Pycnometer + Water(w4)
1478 1478 1478
C. Specific Gravity Of Coarse Aggregate
Table 3 Specific gravity values of coarse aggregate
1) Calculation: Specific gravity of coarse aggregate = (w2-w1) /( w4-w1) – (w3-w2)
= (990-609)/((1482-609)-(1724-990)) =2.74
VI. WATER ABSORPTION TEST
Water absorption test is used to determine the absorption content of water by fine aggregate and coarse aggregate
A. Water Absorption of Fine Aggregate
Table 4 Water absorption values of fine aggregate
1) Calculation: Water absorption = w2 – w1/w1 × 100
= 1000 – 990.83/ 1000 × 100= 0.917%
B. Water Absorption Of Coarse Aggregate
Table 5 Water absorption values of coarse aggregate
Calculation:
Water absorption = w2 – w1/w1 × 100 = 1004 – 1000 / 1000 × 100 = 0.4%
S.no Description Trail 1 Trail 2 Trail 3 Mean
1 Weight Of Empty Bottle(w1) 609 609 609
2.74 2 Weight Of Bottle + Coarse
Aggregate(w2)
990 1053 1026
3 Weight Of Bottle + Coarse Aggregate + Water(w3)
1724 1765 1726
4 Weight Of Bottle + Water(w4)
1482 1482 1482
5 Specific Gravity Of Coarse
Aggregate 2.74 2.75 2.74
S.No Description Trial
1 Weight of oven dry sample w1 1000
2 Weight of oven dry sample w2 990.83
3 Water absorption 0.917%
S.No Description Trial
1 Weight of oven dry sample w1 1000
2 Weight of oven dry sample w2 1004
C. The Test Results Obtained Are
1) Water Absorption for Fine Aggregate : 0.917%
2) Water Absorption for Coarse Aggregate : 0.4%
[image:4.595.91.507.199.375.2]VII. SIEVE ANALYSIS TEST
Table 6 Sieve analysis test values of fine aggregate
1) Calculation: Fineness modulus = Total cumulative % weight retained / 100 = 278.2 / 100
= 2.78%
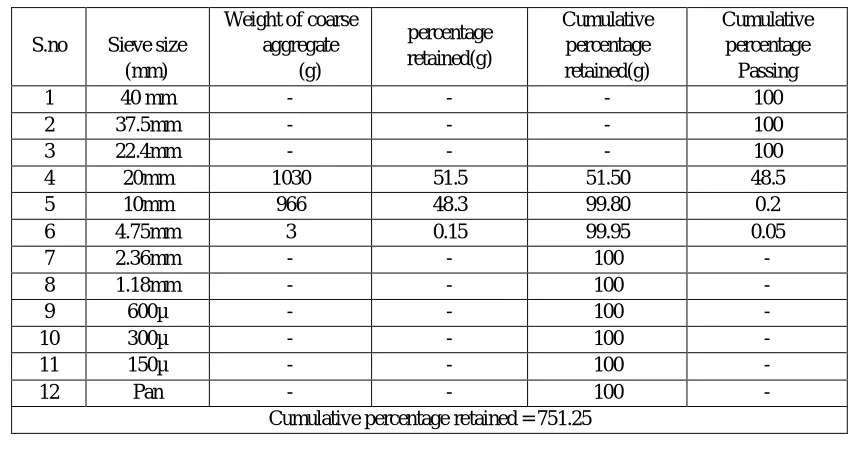
A. Sieve Analysis Of Coarse Aggregate
Table 7 Sieve analysis test values of coarse aggregate
1) Calculation: Fineness modulus = Total cumulative % weight retained / 100 = 751.25 / 100
= 7.5%
S.no Sieve
opening size
Weight of F.A retained
(g)
Cumulative Weight of F.A
retained (g)
Cumulative percentage of F.A
retained(g)
Cumulative percentage of
F.A passing
1 4.75 mm 1039 10 1.0 99.0
2 2.36 mm 39 49 4.9 95.1
3 1.18 mm 235 284 28.4 71.6
4 600 µ 304 588 58.8 41.2
5 300 µ 290 878 87.8 12.2
6 150 µ 95 973 97.3 2.7
7 75 µ 25 998 - 0.2
8 Pan 0 0 - -
990 Total = 278.2
S.no Sieve size (mm)
Weight of coarse aggregate (g) percentage retained(g) Cumulative percentage retained(g) Cumulative percentage Passing
1 40 mm - - - 100
2 37.5mm - - - 100
3 22.4mm - - - 100
4 20mm 1030 51.5 51.50 48.5
5 10mm 966 48.3 99.80 0.2
6 4.75mm 3 0.15 99.95 0.05
7 2.36mm - - 100 -
8 1.18mm - - 100 -
9 600µ - - 100 -
10 300µ - - 100 -
11 150µ - - 100 -
12 Pan - - 100 -
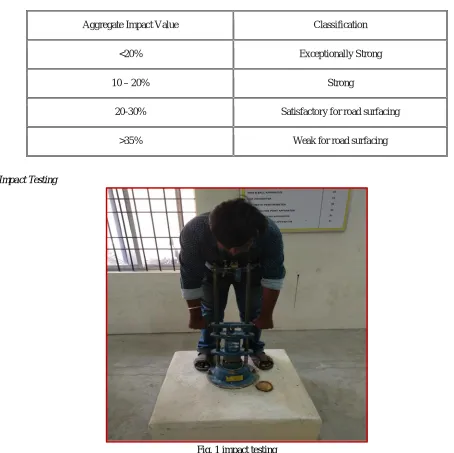
[image:4.595.83.508.471.698.2]VIII. IMPACT TEST
The aggregate impact test is carried out to evaluate the resistance to impact of aggregates. Aggregates passing 20 mm sieve and retained on 12.5 mm sieve is filled in a cylindrical steel cup of internal dia 10.2 mm and depth 5 cm which is attached to a metal base of impact testing machine. The material is filled in 3 layers where each layer is tamped for 25 numbers of blows. Metal hammer of weight 13.5 to 14 Kg is arranged to drop with a free fall of 38.0 cm by vertical guides and the test specimen is subjected to 15 numbers of blows. The crushed aggregate is allowed to pass through 2.36 mm IS sieve. And the impact value is measured as percentage of aggregates passing sieve (w2) to the total weight of the sample (w1).
A. Formula For Impact Test
Aggregate impact value =W2/W1X100% =95/600X100
=15.833 W1=weight of the sample
W2=weight of the fraction passing 2.36mm sieve.
B. Impact Testing
Aggregate Impact Value Classification
<20% Exceptionally Strong
10 – 20% Strong
20-30% Satisfactory for road surfacing
[image:5.595.61.515.295.748.2]IX. SLUMP CONE TEST
[image:6.595.168.428.188.367.2]Concrete slump cone test is to determine the workability or consistency of concrete mix prepared at the laboratory or the construction site during the progress of the work. Concrete slump cone test is carried out from batch to batch to check the uniform quality of concrete during construction. The slump cone test is the most simple workability test for concrete, involves low cost and provides immediate results. Due to this fact, it has been widely used for workability tests since 1922.
Fig.2 slump cone test
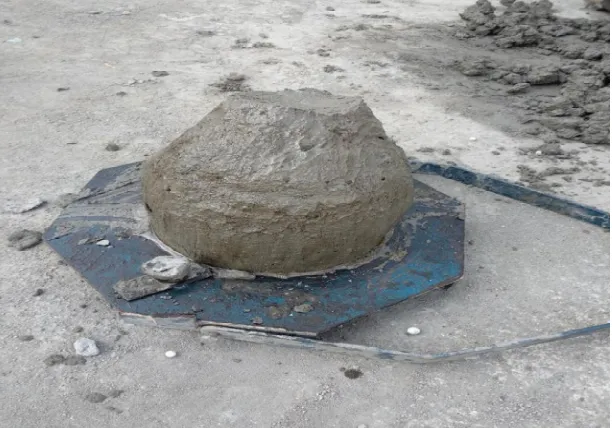
A. Slump Value Observation
The slump (Vertical settlement) measured shall be recorded in terms of millimeters of subsidence of the specimen during the test.
[image:6.595.147.453.426.640.2]The mix was confirmed to be a mix with a medium workability having slump value between 60 -100mm. 70mm or 7cm.
Fig. 3 slump cone result
Mix Proportions For One Cum Of Concrete Cement
Kg
Fine aggregate Kg
Coarse aggregate
Kg
Water Lit
Water cement ratio
Mix proportion ratio
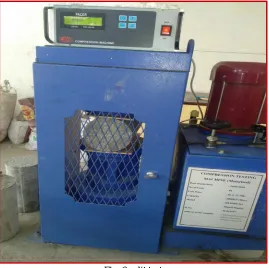
X. TESTING OF EPS BASED CONCRETE A. Compressive Strength
Specimens are casted in concrete cube of size (150mmx150xmm150mm) and cured the tested under compressive strength under compression testing Machine (CTM).
[image:7.595.173.450.162.416.2].
Fig. 4 compressive strength test
[image:7.595.169.430.460.735.2]C. Split Tensile Strength Test
[image:8.595.165.434.149.417.2]Specimens are casted in concrete cylinder of size (150mm X 300mm) and cured and then tested. Below graph shows split tensile strength of concrete using polystyrene at 28 days for o.45 W/C
Fig. 6 split test
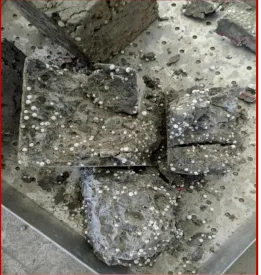
[image:8.595.127.467.443.733.2]D. Broken Surface Of Failed Cylinder
E. Flexural Strength
Flexural strength, also known as modulus of rupture, or bend strength, or transverse rupture strength is a material property, defined as the stress in a material just before it yields in a flexure test. The transverse bending test is most frequently employed, in which a specimen having either a circular or rectangular cross-section is bent until fracture or yielding using a three point flexural test technique. The flexural strength represents the highest stress experienced within the material at its moment of yield. It is measured in terms of stress, here given the symbol
Fig.8 flexural strength testing
XI. RESULT AND DISCUSSION
Water absorption test, specific gravity test, sieve analysis test on fine aggregate, sieve analysis test on coarse aggregate, slump cone test, compressive strength test are computed. Testing values are coming in within limits.
XII. CONCLUSION
From the experimental results, it can be concluded that, The workability (slump test) of EPS Concrete is same for Normal concrete because the rate absorption of EPS Concrete is equal to Normal concrete .The general properties of EPS Concrete and Normal concrete are same in the specific gravity, water absorption, and Aggregate impact value. The sieve Analysis test of coarse Aggregate and Fine Aggregate are compared with EPS Concrete. The 28-day target compressive strength for all mixes was achieved to 30MPa even though the EPS Concrete strength is lower than Normal concrete. All the EPS concrete without any special bonding agent show good Workability and could easily be compacted and finished.
REFERENCES
[1] Lightweight Concrete Using EPS, Int. Jour. of Sci and Re, Abhijit Mandlik, Tarun Sarthak Sood, Shekhar Karade, Sangran Naik, Amruta Kulkarni.- Volume
4(3) ( 2015) pp2007-2010.
[2] Properties of Modified, Polystyrene lightweight Aggregate in Concrete, Environ. Eng. Dept. University Malaysia Perli, FetraVenny R, KhairulNizar I, Mohd
Mustafa Al Bakri A. -volume 1(2010) pp 2180-3811.
[3] Partial Replacement of Coarse Aggregates by Expanded Polystyrene Beads in Concrete. Int. Jour. of Res. in Engg and Tech, Thomas Tamut, Prabhu Rajendra,
Katta Venkataramana, Yaragal Subhash.-volume 3(2) (2014) pp 238-246.
[4] Thermal and Mechanical Properties of Concretes with Styropor. Department of Chemical Engineering, Thermal and Mechanical Properties of Concretes with
Styropor Firat University, Elazing, Turkey. volume 2 pp310-315.
[5] Strength Properties of Expanded Polystyrene Beads in Concrete. Jour of Environ. . Chowdary P L. Sci., Comp.Sci. and Eng. & Tech.- volume 4(3) (2015) pp734-742.
[6] Particle size eff ect on EPS lightweight concrete compressive strength, Experimental investigation and modeling, Mechanics of Materials Miled K, Sab K, LeRoy R.- volume 39(2006) pp222 – 240.
[7] A novel material for lightweight concrete production, Cement & Concrete Composites Abdulkadir Kan, Ramazan Demirboga.-volume 31(2009) pp 489 – 495.
[8] Thermal Behaviour and Admissible Compressive Strength of Expanded Polystyrene Wall Panelsof Varying Thickness, Current Trends in Technology and