Greening Multi-Tenant Data Center Demand Response
I
Niangjun Chen
a, Xiaoqi Ren
a, Shaolei Ren
b, Adam Wierman
aaComputing and Mathematical Sciences Department, California Institute of Technology bUniversity of California, Riverside
Abstract
Data centers have emerged as promising resources for demand response, particularly for emergency demand response (EDR), which saves the power grid from incurring blackouts during emergency situations. However, currently, data centers typically participate in EDR by turning on backup (diesel) generators, which is both expensive and environmentally unfriendly. In this paper, we focus on “greening” demand response in multi-tenant data centers, i.e., colocation data centers, by designing a pricing mechanism through which the data center operator can efficiently extract load reductions from tenants during emergency periods for EDR. In particular, we propose a pricing mechanism for both mandatory and voluntary EDR programs,ColoEDR, that is based on parameterized supply function bidding and provides provably near-optimal efficiency guarantees, both when tenants are price-taking and when they are price-anticipating. In addition to analytic results, we extend the literature on supply function mechanism design, and evaluateColoEDRusing trace-based simulation studies. These validate the efficiency analysis and conclude that the pricing mechanism is both beneficial to the environment and to the data center operator (by decreasing the need for backup diesel generation), while also aiding tenants (by providing payments for load reductions).
Keywords: demand response, mechanism design, multi-tenant data center, supply function bidding
1. Introduction
Data centers have emerged as a promising demand response opportunity. However, data center demand response today is not environmentally friendly since data centers typically participate by turning on backup (diesel) generators. In this paper, we focus on designing a pricing mechanism for multi-tenant data centers, which is a crucial class of data centers for demand response. Our pricing mechanism allows the data center operator to obtain load shedding among tenants efficiently, reducing the need for use of backup (diesel) generation and thus greening data center demand response.
Data center demand response. Power-hungry data centers have been quickly expanding in both number and scale to support the exploding IT demand, consuming 91 billion kilowatt-hour (kWh) electricity in 2013 in the U.S. alone [1]. While traditionally viewed purely as a negative, the massive energy usage of data centers has recently begun to be recognized as an opportunity. In particular, because the energy usage of data centers tends to be flexible, they are promising candidates fordemand response, which is a crucial tool for improving grid reliability and incorporating renewable energy into the power grid. From the grid operator’s perspective, a data center’s flexible power demand serves as a valuable energy buffer, helping balance grid power’s supply and demand at runtime [2].
IThis work is supported in part by the U.S. NSF CNS-1319820, EPAS-1307794, CNS-1423137, and CNS-1453491.
Email addresses:[email protected](Niangjun Chen),[email protected](Xiaoqi Ren),[email protected](Shaolei Ren),
[email protected](Adam Wierman)
To this point, data centers are a promising, but still largely under-utilized opportunity for demand response. How-ever, this is quickly changing as data centers play an increasing role in emergency demand response (EDR) programs. EDR is the most widely-adopted demand response program in the U.S., representing 87% of demand reduction ca-pabilities across all reliability regions [3]. Specifically, during emergency events (e.g., extreme weather or natural disasters), EDR coordinates many large energy consumers, including data centers, to shed their power loads, serving as the last protection against cascading blackouts that could potentially result in economic losses of billions of dollars [4, 5]. The U.S. EPA has identified data centers as critical resources for EDR [6], which was attested to by the follow-ing example: on July 22, 2011, hundreds of data centers participated in EDR by cuttfollow-ing their electricity usage before a large-scale blackout would have occurred [5].
While data centers are increasingly contributing to EDR, they typically participate by turning on their on-site backup diesel generators, which is neither cost effective nor environmentally friendly. For example, in California (a major data center market), a standby diesel generator often produces 50-60 times more nitrogen oxides (a smog-forming pollutant) compared to a typical power plant for each kWh of electricity, and diesel particulate represents the state’s most significant toxic air pollution problem [7].
In addition, relying on diesel generation for EDR presents emerging challenges which, if left unaddressed, may forfeit data center’s EDR capability. First, as EDR becomes more frequent [4, 8], the current financial compensation offered by power grid to data centers (for committed energy reduction during EDR) may not be enough to cover the growing cost of diesel generation. Second, data center operators are aggressively cutting the huge capital investment in their power infrastructure (e.g., 10-25$/watt [9, 10]), by down-sizing the capacity of diesel generator and uninterrupted power supply (UPS) systems [11]. Such under-provisioning of diesel generation may compromise EDR capability. Therefore, to retain and encourage data center participation in EDR without contaminating the environment, it is critical and urgent that data centers seek alternative ways to shed load.
Consequently, modulating server energy for green EDR (as well as other demand response programs such as regulation service [12]) has received an increasing amount of attention in recent years, e.g., [13, 14, 15, 16, 17, 12, 2]. These studies leverage various widely-available IT computing knobs (e.g., server turning on/offand workload migration) in data centers and provide algorithms to optimize them for participation in demand response markets. Importantly, these are not simply theoretical studies. For example, a field study by Lawrence Berkeley National Laboratory (LNBL) has illustrated that data centers can reduce energy consumption by 10-25% in response to demand response signals, without noticeably impacting normal operation [18].
Demand response in collocation data centers. While existing studies on data center demand response show promising progress, they are primarily focused on owner-operated data centers (e.g., Google) whose operators have full control over both servers and facilities. Unfortunately, such companies may actually be the least likely to par-ticipate in demand response programs, because many of their workloads are extremely delay sensitive and their data centers have been optimized for minimum delay.
In this paper, we focus on another type of data centers — multi-tenant colocation data centers (e.g., Equinix). These have been investigated much less frequently, but are actually better targets for demand response than owner-operated data centers. In a colocation data center (simply called “colocation” or “colo”), multiple tenants deploy and keep full control of their own physical servers in a shared space, while the colo operator only provides facility support (e.g., high-availability power and cooling). Colos are less studied than owner-operated data centers, but they are actually more common in practice. Colos offer data center solutions to many industry sectors, and serve as physical home to many private clouds, medium-scale public clouds (e.g., VMware) [19], and content delivery providers (e.g., Akamai). Further, a recent study shows that colos consume nearly 40% of data center energy in the U.S., while Google-type data centers collectively account for less than 8%, with the remaining going to enterprise in-house data centers [1].
In addition to consuming a significant amount of energy (more than Google-type data centers), colos are often located in places more useful for demand response. While many mega-scale owner-operated data centers are built in rural areas, colos are mostly located in metropolitan areas (e.g., Los Angeles, New York) [20], which are the very places where EDR is most needed. For all these reasons, colos are key participants in EDR programs.
Further, tenants’ workloads in colos are highly heterogenous, and many tenants run non-mission-critical work-loads (e.g., lab computing [21]) that have very high scheduling flexibilities, different delay sensitivities, peak load periods, etc., which is ideal for demand response participation. Thus, tenants’ load shedding potentials, if appro-priately exploited, can altogether form a green alternative to diesel generation for colo EDR. Nonetheless, tenants
manage their own servers independently and may not have incentive to cooperate with the operator for EDR, thus raising the research question: how can a colo operatorefficientlyincentivize its tenants’ load shedding for EDR?1
Contributions of this paper. In this paper, we focus on “greening” colocation demand response by extracting load reduction from tenants instead of relying on backup diesel generation. We study bothmandatoryEDR, a type of EDR program in which participants sign contracts and are obliged to reduce loads when requested [8], andvoluntary
EDR, where participants voluntarily reduce loads for financial compensation upon grid request [4]. In both cases, we propose a new pricing mechanism with which colo operators can extract load shedding from tenants. In particular, our proposed approach, calledColoEDR, can effectively provide incentives for tenants to reduce energy consumption during EDR events, complementing (and even substituting for) the high-cost and environmentally-unfriendly diesel generation.
ColoEDRworks as follows. After an EDR signal arrives at the colo operator, tenants bid using a parameterized supply function, and then the colo operator announces a market clearing price which, when plugged into the bids, specifies how much energy tenants will reduce and how much they will be paid. Participation by the tenants is easy, since they are asked to bid only one parameter, which can be viewed as a proxy of how much flexibility in energy reduction they have at that moment. This participation can be automated and so can be easily incorporated into current practice [22], and mimics the way generation resources participate in electricity markets more broadly. For example, colo operators, like Verizon Terremark, already communicate with their tenants in preparation for an EDR event.
The main technical contribution of the paper is the analysis of the efficiency of the supply function mechanism proposed inColoEDR. In particular, while there is a large literature studying supply function bidding [23, 24, 25, 26, 27], our setting here is novel and different. For mandatory EDR, the colo operator can either satisfy the EDR request using flexibility from the tenants (as in prior supply funding literature) or through its backup diesel generator. Thus, the diesel generator is an outside option that allows forelasticityin the amount of response extracted from the tenants. Further, the colo operator can combine and balance between its two options (i.e., tenant load shedding and backup generator) in order to minimize costs. For voluntary EDR, the amount of response extracted from the tenants is also an elastic decision by the colo operator, since there is no obligation for the colo to reduce energy. Thus, for both mandatory and voluntary EDR, the elastic amount of response from tenants creates a multi-stage game and adds a considerable complexity as compared to the standard setting without such elasticity, e.g., [23].
Despite the added complexity, our analysis precisely characterizes the equilibrium outcome, both when tenants are price-taking and when they are price-anticipating. In both cases, our results highlight thatColoEDR suffers little performance loss compared to the socially optimal outcome, both from the operator’s and the tenants’ perspec-tives. However, our analysis does highlight one possible drawback ofColoEDR. In the worst case, it is possible that
ColoEDRmay result in using significantly more on-site diesel generation than would the socially optimal. However, this bad event occurs only in cases where one tenant has an overwhelmingly fraction of the servers and has a unit cost (for energy reduction) just below that of on-site diesel generation. Such an exploitation of market power is unlikely to be possible in practical multi-tenant colocation data centers where multiple tenants with comparable sizes house their servers.
In addition to our theoretical analysis, we investigate a case study of (mandatory) EDR in §6 using trace-based experiments. The results further validate the design ofColoEDR, and show that it achieves the mandatory energy reduction for EDR while benefiting tenants through financial incentives and decreasing the operator’s cost. Moreover, our simulation study shows that the efficiency loss in practical settings is even lower than what is suggested by the analytic bounds. This is especially true for the amount of on-site generation, which the analytic results suggest can (in the worst-case) be significantly larger than socially optimal but in realistic settings is very close to the social optimal. 2. Modelling Multi-Tenant Data Center EDR
Our focus is the design of a mechanism for a colo operator to extract tenant load reductions in response to an EDR signal. Thus, we need to begin by describing a model for a colo operator.
Recall that the colo operator is responsible for non-IT facility support (e.g., high-availability power, cooling). We capture the non-IT energy consumption using Power Usage Effectiveness (PUE)γ, which is the ratio of the total data
1Tenants receive UPS-protected power from the colo operator and share cooling systems. In other words, tenants’ total energy consumption is
not directly provided by the grid and includes non-metered cooling energy, which makes tenants ineligible for direct participation in EDR [4]. 3
center energy consumption to the IT energy consumption. Typically,γranges from 1.1 to 2.0, depending on factors such as outside temperature.
When the operator receives an EDR signal from the LSE (Load Serving Entity), it has two options for satisfying the load reduction. First, without involving the tenants, the colo operator can use its on-site backup diesel generator.2
We denote the amount of energy reduction by diesel generation byyand the cost per kWh of diesel generation (e.g., for fuels) byα.
Alternatively, the colo operator could try to extract IT energy reductions from the tenants. We consider a setting where there areNtenants,i∈ N ={1,2,· · ·,N}. When shedding energy consumption, a tenantiwill incur some costs and we denote the cost from sheddingsiby a functionci(si). These costs could be due to wear-and-tear, performance
degradation, workload shifting, etc. For the purposes of our model, we do not specify which technique reduces the IT energy, only its cost. For details on how one might model such costs, see [28, 29, 30, 31]. A standard, natural assumption on the costs is the following.
Assumption 1. For each n, the cost function cn(sn)is continuous, with cn(sn)=0if sn ≤0. Over the domain sn≥0, the cost function cnis convex and strictly increasing.
Intuitively, convexity follows from the conventional assumption that the unit cost increases as tenants reduce more energy (e.g., utilization becomes higher when servers are off, leading to a faster increase in response time of tenants’ workloads).
3. Pricing Tenant Load Shedding in Mandatory EDR
EDR is the last line of protection against cascading power failures, and represents 87% of demand reduction capabilities across all the U.S. reliability regions [3]. In general, there are two types of EDR programs: mandatory and voluntary (also called economic) [4, 8]. We focus on mandatory EDR first, and return to voluntary EDR in Section 5.
For mandatory EDR, participants typically sign contracts with a load serving entity (LSE) in advance (e.g., 3 years ahead in Pennsylvania-New Jersey-Maryland Interconnection (PJM) [4]) and receive financial rebates for their com-mitted energy reduction even if no EDR signals are triggered during the participation year, whereas non-compliance (i.e., failure to cut load as required during EDR) incurs a heavy penalty [4]. If an LSE anticipates that an emergency will occur, participants are notified, usually at least 10 minutes in advance, and obliged to fulfill their contracted amounts of energy reduction for the length of the event, which may span a few minutes to a few hours.
In mandatory EDR, the colo operator can reduce load in response to an EDR signal either through tenants or by turning on an on-site generator. Since the mandatory EDR target is fixed, the operator must balance between paying tenants for reduction and using on-site generation in order to minimize cost. Note that tenants’ load reduction can also reduce the usage of diesel generator, mitigating environmental impacts. Nonetheless, the challenge is that the operator does not know the tenant cost functions, and so cannot determine the cost-minimizing price.
Consequently, the operator has two options to determine the price: (i) predict the tenant supply function and compute prices based on the predictions, or (ii) allow tenants to supply some information about their cost functions through bids. Clearly, there is a tradeoffhere between the accuracy of predictions and the manipulation possible in the bids. Both of these approaches have been studied in the literature [32, 16, 23, 24, 33], though not in the context of colo demand response. In general, the broad conclusion is that approach (i) is appropriate when predictions are accurate and one bidder has market power (e.g., is significantly larger than other bidders). While market power is a considerable issue for the participation of owner-operated data centers in demand response programs due to their large size compared to other participants, it is not an issue within a specific colo that houses multiple tenants (typically of comparable sizes), and so we adopt approach (ii) in this paper.
Specifically, we design a mechanism, namedColoEDR, where tenants bid using parameterized supply functions and then, given the bids, the operator decides how much load to shed via tenants and how much to shed via on-site generation. In the following, we describe the mechanism and then contrast our approach with other potential alternatives.
Note that, throughout this paper, we focus on one EDR event, thus we omit the time index. In the case of multiple consecutive EDR events,ColoEDRwill be executed once at the beginning of each event, as is standard in the literature [16, 34].
3.1. An overview of ColoEDR
The operation ofColoEDRis summarized below, and then discussed in detail in the text that follows.
1. The colo operator receives an EDR reduction targetδand broadcasts the supply functionS(·,p) specified by(1) to tenants;
2. Participating tenants respond by placing their bidsbn;
3. The colo operator decides the amount of on-site generationyand market clearing pricepto minimize its cost, using equations (2) to set the market clearing pricepand (3) to setyin order to minimize the cost of EDR; 4. EDR is exercised.∀n∈ N, tenantnshedsS(bn,p), and receivespS(bn,p) reward.
Given the overview above, we now discuss each step in more detail.
Step 1. Upon receiving an EDR notification of an energy reduction targetδ, the colo operator broadcasts a pa-rameterized supply functionS(b,p) to tenants (by, e.g., signalling to the tenants’ server control interfaces, which are widely in use today [22]). The form ofS(b,p) is the following parameterized family3:
S(bn,p)=δ− bn
p. (1)
wherepis an offered reward for each kWh of energy reduction andbn is the bidding values that can be chosen by
tenantn. This form is inspired by [23], where it is shown that by restricting the supply function to this parameterized family, the mechanism can guide the firms in the market to reach an equilibrium with desirable properties.4 Note
that, to be consistent with the supply function literature, we exchangeably use “price” and “reward rate” wherever applicable.
Step 2. Next, according to the supply function, each participating tenant submits its bidbnto the colo operator.
This bid specifies that, at each pricep, it is willing to reduceS(bn,p) units of energy. The bid is chosen by tenants individually to maximize their own utility and can be interpreted as, e.g., the amount of IT service revenue that tenant
nis willing to forgo. Note thatbncan be chosen to ensure that tenantnwill not be required to reduce more energy
than its capacity. To see this, note that since the operator is cost-minimizing,p(b,y)≤αalways holds, i.e., the market clearing price is lower than the unit cost of diesel generation. Hence, ifKnis the capacity of reduction for tenantn, as
long asbn≥α(δ−Kn), then S(bn,p)=δ− bn p ≤δ− bn α ≤Kn.
An important note about the tenant bids is that the supply function is likely of a different form than the true cost functioncn, and so it is unlikely for the tenants to reveal their cost functions truthfully. This is necessary in order
to provide a simple form for tenant bids. Bidding their true cost functions is too complex and intrusive. However, a consequence of this is that one must carefully analyze the emergent equilibrium to understand the efficiency of the pricing mechanism. We study both the cases of price-taking and price-anticipating equilibrium in §4.
Step 3. After tenants have submitted their bids, the colo operator decides the amount of energyyto produce via on-site generation and the clearing pricep. Giveny, the market clearing price has to satisfy ΣnS(p(b),bn)+y=δ,
thus
p(b,y)= P
nbn
(N−1)δ+y. (2)
3The supply function allows tenants to have negative supply, i.e., tenants consume more energy intentionally, which is neither profit maximizing
nor practical. We show in §4 that energy reduction of each tenant is always nonnegative in both equilibrium and social optimal outcomes.
4[23] studies the case where firms bid to supply an inelastic demand, which is equivalent to fixing the diesel generationy=0 in our case.
Allowing the operator to chooseyin a cost-minimizing manner leads to significantly different results, as will be shown in §4.1 and §4.2. 5
To determine the amount of local generationy, the operator minimizes the cost of the two load-reduction options, i.e.,
y=arg min
0≤y≤δ
(δ−y)·p(b,y)+αy. (3)
Step 4.Finally, EDR is exercised and tenants receive financial compensation from the colo operator via the realized price in (2), shed loadS(p,bn), and on-site generation produces (3).
3.2. Discussion
To the best of our knowledge, this paper represents the first attempt to design a supply function bidding mech-anism for colocation demand response. Although alternative mechmech-anisms may be applicable, there are compelling advantages to the supply function approach. First, bidding for the tenants is simple – they only need to communicate one number, and it is already common practice for operators to communicate with tenants before EDR events [22], so the overhead is marginal. Second, the colo operator collects just enough information (i.e., how much energy reduc-tion each tenant will contribute to EDR), while tenants’ private informareduc-tion (i.e., how much performance penalty/cost each for energy reduction) is masked by the form of the supply function and hence not solicited. Third,ColoEDR
guarantees that the colo operator will not incur a higher cost than the case where only backup generators are used. Further,ColoEDRpays a uniform price to all participating tenants and hence ensures fairness.
The most natural alternative bidding mechanism to supply function bidding is a Vickrey-Clarke-Groves (VCG)-based mechanism, as is suggested in [35]. While VCG-(VCG)-based mechanisms have the benefit of incentive compatibility, these mechanisms violate all the four properties discussed above. Under such approaches, tenants must submit very complex bids describing their precise cost functions, the true private cost of tenants is disclosed, payment made to tenants may be unbounded, and prices to different tenants are differentiated and thus raises unfairness issues.
Due to these shortcomings, VCG-based mechanisms are typically not adopted in complex resource allocation settings such as power markets, where supply-function based designs are common [23]. In fact, nearly all generation markets use variations of supply function bidding.
4. Efficiency Analysis ofColoEDRfor Mandatory EDR
Given the ColoEDRmechanism described above, our task now is to characterize its efficiency. There are two potential causes of inefficiency in the mechanism: the cost minimizing behavior of the operator and the strategic behavior (bidding) of the tenants. In particular, since the forms of the tenant’s cost functions are likely more complex than the supply function bids, tenants cannot bid their true cost function even if they wanted to. This means that evaluating the equilibrium outcome is crucial to understanding the efficiency of the mechanism.
Further, the equilibrium outcome that emerges depends highly on the behavior of the tenants – whether they are
price-taking, i.e., they passively accept the offered market pricepas given when deciding their own bids; or price-anticipating, i.e., they anticipate how the pricepwill be impacted by their own bids. We investigate both models, in §4.1 and §4.2, respectively.
In both cases, the goal of our analysis is to assess the efficiency ofColoEDR. To this end, we adopt a notion of a (socially) optimal outcome, and focus on the following social cost minimization (SCM) problem.
SCM: min αy+X i∈N ci(si) (4a) s.t. y+γ·X i∈N si=δ (4b) si≥0, ∀i∈ N, y≥0. (4c)
wheresiandciare tenanti’s energy reduction and corresponding cost, respectively.
The objective inSCMcan be interpreted as the tenants’ cost plus the colo operator’s cost. Note that the internal payment transfer between the colo operator and tenants cancels, and does not impact the social cost. Also, note that payment from the LSE to the colo operator is not included in the social cost objective, since it is independent of how the operator obtains the amountδof load reduction. Additionally, we do not include the option of ignoring the EDR
signal and taking the penalty, since the non-compliance penalties are typically extreme [4]. Finally, the Lagrange multiplier of (4b) can be interpreted as the social optimal pricep∗, i.e., given this price as reward for energy reduction, each tenant will individually reduce their energy bysnthat corresponds to the social cost minimization solution in (4).
Before moving to the analysis, in order to simplify notation, we suppress the PUEγby, without loss of generality, settingγ=1. To obtain results forγ,1, simply take the results assumingγ=1 and modified them in the following
way: lety0,δ0andα0be the diesel generation, EDR target and diesel price that appear in the results forγ=1, replace
them byy0=y/γ,δ0=δ/γ, andα0=αγwherey, δ, αare the respective quantities whenγ
,1. 4.1. Price-Taking Tenants
When tenants are price-taking, they maximize their net utility, which is the difference between the payment they receive and the cost of energy reduction, given the assumption that they consider their action does not impact the price. A price-taking tenantnwill try to maximize the following payoffPn(bn,p):
Pn(bn,p) =pSn(bn,p)−cn(Sn(bn,p)) (5a) =pδ−bn−cn δ−bn p . (5b)
Here, the price-taking assumption implies that the variablepis considered to be as is. The price-taking assumption normally holds when the market consists of many players of similar sizes who have little power to impact the market clearing price. The other market model, when tenants are price-anticipating, is analyzed in Section 4.2.The market equilibrium for price-taking tenants is thus defined as follows:
Definition 1. A triple(b,p,y)is a (price-taking) market equilibrium if each tenant maximizes its payoffdefined in
(5), market is cleared by setting price p according to(2), and the amount of on-site generation is decided by(3), i.e., Pn(bn;p)≥Pn(¯bn;p) ∀b¯n ≥0, n=1, . . . ,N. (6) p= P i∈Nbi (N−1)δ+y. (7) y=arg min 0≤y≤δ (δ−y)·p(b,y)+αy. (8)
4.1.1. Market Equilibrium Characterization
The key to our analysis is the observation that the equilibrium can be characterized by an optimization problem. Once we have this optimization, we can use it to characterize the efficiency of the equilibrium outcome. This approach parallels that used in [23]; however, the optimization obtained has a different structure due to local diesel generation. Note that, though we use an optimization to characterize the equilibrium, the game is not a potential game since the objective (9a) below is not a potential function.
Our first result highlights that, given any choice for on-site generation, a unique market equilibrium exists for the tenants, and can be characterized via a simple optimization.
Proposition 1. Under Assumption 1, when tenants are price-taking, for any on-site generation level0≤y< δ, there exists a market equilibrium, i.e., a vectorbt=(bt
1, . . . ,b t
N)≥0and a scalar p>0that satisfies(2), and the resulting allocation sn=S(bn,p)is the optimal solution of the following
min s X i∈N ci(si) (9a) s.t. X i∈N si=(δ−y), (9b) si≥0, ∀i∈ N. (9c)
This result is a key tool for understanding the overall market outcome. Intuitively, the operator runningColoEDR
is more likely (than the social optimal) to use on-site generation, since this reduces the price paid to tenants. The following proposition quantifies this statement.
Proposition 2. Under Assumption 1, it is optimal for price-taking tenants to use on-site generation if and only if α < (Σnbn)
(N−1)δ.
5 (10)
However, when the operator is profit maximizing, it will turn on on-site generation if and only if α < N
N−1 (Σnbn)
(N−1)δ. (11)
This proposition is an important building block because the most interesting case to consider is when it is optimal to use some on-site generation and some tenant load shedding, i.e.,δ > y∗ > 0. Otherwise the EDR requirement
should be entirely fulfilled by tenants, and the analysis reduces to the case of an inelastic demand, as studied in [23]. Thus, subsequently, we make the following assumption, which ensures that on-site generation is valuable.
Assumption 2. The unit cost of on-site generation is cheap enough that the optimal on-site generation is non-zero, i.e.,αsatisfies(10).
Note that, when Assumption 2 holds, by first-order optimality condition of (3) we have
y=
r
(Σi∈Nbi)Nδ
α −(N−1)δ, (12)
and so the market clearing price for the tenants given on-site generation is
p= P i∈Nbi (N−1)δ+y= r (Σi∈Nbi)α Nδ . (13)
Using these allows us to prove a complete characterization of the market equilibrium under price-taking tenants. This theorem is the key to our analysis of market efficiency.
Theorem 3. When Assumptions 1 and 2 hold there is a unique market equilibrium, i.e., a vectorbt=(bt 1, . . . ,b
t N)≥0, yt>0and a scalar pt>0that satisfies(6)-(8), and the resulting allocation(st,yt)where st
n=S(btn,pt)is the optimal solution of the following problem
min s,y X n cn(sn)+ α 2Nδ(y+(N−1)δ) 2 (14a) s.t. X n sn=δ−y, (14b) sn≥0, ∀n, y≥0. (14c)
4.1.2. Bounding Efficiency Loss
We now use Theorem 3 to bound the efficiency loss due to strategic behavior in the market. Denote the socially optimal on-site generation byy∗, the optimal price that leads to the optimal allocations
i,∀i∈ Nbyp∗, and letytand ptbe the allocation under the price-taking assumption.
Our first result highlights that, due to the cost-minimizing behavior of the operator, the equilibrium outcome uses more on-site generation and pays a lower price to the tenants than the social optimal.
5We adopt the convention that0
Proposition 4. Suppose that Assumptions 1 and 2 hold. When tenants are price-taking, the operator running ColoEDRuses more on-site generation and pays a lower price for power reduction to its tenants than the social optimal. Specifically, yt≥y∗and N−1
N p
∗≤pt≤p∗.
Now, we move to more detailed comparisons. There are three components of market efficiency that we consider: social welfare, operator cost, and tenant cost.
First, let us consider the social cost.
Theorem 5. Suppose that Assumptions 1 and 2 hold. Let(st,yt)be the allocation when tenants are price-taking, and
(s∗,y∗)be the optimal allocation. Then the welfare loss is bounded by:P
ncn(stn)+αyt≤
P
ncn(s∗n)+αy∗+αδ/2N.
Importantly, this theorem highlights that the market equilibrium is quite efficient, especially if the number of tenants is large (the efficiency loss decays to zero asO(1/N)). However, the market could maintain good overall social welfare at the expense of either the operator or the tenants. The following results show this is not true.
Let costo(p,y) be the operator’s cost, i.e.,
costo(p,y)=p(δ−y)+αy. (15)
Then, we have the following results.
Theorem 6. Suppose that Assumptions 1 and 2 are satisfied. The cost of colo operator with price-taking tenants is smaller than the cost in the socially optimal case. Further, we havecosto(p∗,y∗)−αδ/N≤costo(pt,yt)≤costo(p∗,y∗).
4.2. Price-Anticipating Tenants
In contrast to the price-taking model, price-anticipating tenants realize that they can change the market price by their bids, i.e., that p is set according to (13), and adjust their bids accordingly. The price-anticipating model is suitable when the market consists of a few dominant players, who have significant power to impact the market price through their bids, i.e., the oligopoly setting. Clearly, this additional strategic behavior can lead to larger efficiency loss. However, in this section, we show that the extra loss is surprisingly small, especially when a large number of tenants participate inColoEDR.
Given bids from the other tenants, each price-anticipating tenantnoptimizes the following cost over bidding value
bn
Qn(bn,b−n)=p(b)Sn(bn,p)−cn(Sn(bn,p))
where we useb−nto denote the vector of bids of tenants other thann; i.e.,b−n =(b1, . . . ,bn−1,bn+1, . . . ,bN). Thus,
substituting (1) and (13), we have
Qn(bn;b−n)= r (Σnbn)αδ N −bn−cn δ− √bn Σmbm r Nδ α . (16)
Note that the payofffunctionQnis similar to the payofffunctionPnin the price-taking case, except that the tenants
anticipate that the colo operator will set the pricepaccording top=p(b,y) from (13).
Definition 2. A triple(b,p,y)is a (price-anticipating) market equilibrium if each tenant maximizes its payoffdefined in(16), the market is cleared by setting the price p according to(2)and the amount of on-site generation is decided by(3), i.e., Qn(bn;bn)≥Qn(¯bn;bn) ∀b¯n≥0, n=1, . . . ,N (17) p= P nbn (N−1)δ+y. (18) y=arg min 0≤y≤δ (δ −y)·p(b,y)+αy. (19) 9
Note that our analysis in this section requires one additional technical assumption about the tenant cost functions. Assumption 3. For all tenants, the marginal cost of energy reduction at 0 is greater than2αN, i.e., ∂+∂cnsn(0) ≥ α
2N, ∀n.
This assumption is quite mild, especially if the number of tenantsNis large. Intuitively, it says that the unit cost of on-site generation is competitive with the cost of tenants reducing their server energy.
4.2.1. Market Equilibrium Characterization
Our analysis of market equilibria proceeds along parallel lines to the price-taking case. We again show that there exists a unique equilibrium and, furthermore, that the tenants and operator behave in equilibrium as if they were solving an optimization problem of the same form as the aggregate cost minimization (4), but with “modified” cost functions.
Theorem 7. Suppose that Assumption 1-3 are satisfied, then there exists a unique equilibrium of the game defined by
(Q1, . . . ,Qn)satisfying(17)-(19). For such an equilibrium, the vector sa defined by san =S(p(ba),ban)is the unique optimal solution to the following optimization:
min X n ˆ cn(sn)+ α 2Nδ(y+(N−1)δ) 2 (20a) s.t. X n sn=δ−y (20b) y≥0, sn≥0, n=1, . . . ,N, (20c) where, for sn≥0, ˆ cn(sn)= 1 2 cn(sn)+sn α 2N +1 2 Z sn 0 s ∂+cn(z) ∂z − α 2N !2 +2∂+cn(z) ∂z zα Nδdz, (21) and for sn<0, cˆn(sn)=0.
Although the form of ˆcn(sn) looks complicated, there is a simple linear approximation that gives useful intuition.
Lemma 8. Suppose that Assumption 1-3 are satisfied. For all modified costcˆn,n∈1, . . . ,N, for any0≤sn≤δ, cn(sn)≤cˆn(sn)≤cn(sn)+sn
α
2N,
Furthermore, when the left or right derivatives ofcˆ(·)is defined, it can be bounded by ∂−c n(sn) ∂sn ≤∂ −cˆ(s n) ∂sn ≤∂ +cˆ(sn) ∂sn ≤ ∂ +cn(sn) ∂sn + α 2N.
The form of Lemma 8 shows that the difference between the modified cost function in (21) and the true cost diminishes asNincreases, and this is the key observation that underlies our subsequent results upper bounding the efficiency loss ofColoEDR.
4.2.2. Bounding Efficiency Loss
We now use Theorem 7 to bound the efficiency loss due to strategic behavior. Note that, by comparing to both the socially optimal and the price-taking outcomes, we can understand the impact of both strategic behavior by the operator and the tenants.
Our first result focuses on comparing the price-anticipating and price-taking equilibrium outcomes. It highlights that price-anticipating behavior leads to tenants receiving higher price while shedding less load.
Theorem 9. Suppose Assumption 1-3 hold. Let(pt,yt)be the equilibrium price and on-site generation when tenants are price-taking, and(pa,ya)be those when tenants are price-anticipating, then we have, yt≤ya≤yt+δ/2and pt≤ pa≤pt+α/2N.
Next, combining Theorem 9 and Proposition 4 yields the following comparison between the price-anticipating and socially optimal outcomes.
Corollary 10. Suppose Assumption 1-3 hold. When tenants are price-anticipating, an operator runningColoEDR uses more on-site generation and pays lower market price than in the socially optimal case, i.e., ya≥y∗and N−1
N p
∗≤
pa≤p∗.
Now, we move to more detailed comparisons. There are three components of market efficiency that we consider: social cost, operator cost, and tenant cost.
First, let us consider the social cost.
Theorem 11. Suppose that Assumption 1-3 hold. Let(sa,ya)be the allocation when tenants are price-anticipating, and(s∗,y∗)be the optimal allocation. The welfare loss is bounded by:P
ncn(san)+αya≤Pncn(s∗n)+αy∗+αδ/N.
Similarly to the price-taking case, the efficiency loss in the price-anticipating case decays to zero asO(1/N), only with a larger constant. Also, as in the case of price-taking tenants, we again see that neither the tenants nor the operator suffers significant efficiency loss.
Theorem 12. Suppose that Assumption 1-3 hold. The cost of colo operator for price-anticipating tenants is smaller than the cost in the socially optimal case. Further, we have
costo(p∗,y∗)− αδ N ≤costo(p a, ya)≤costo(p∗,y∗), costo(pa,ya)− αδ N ≤costo(p t,yt)≤cost o(pa,ya)
Finally, let us end by considering the amount of on-site generation used in equilibrium. Here, in the worst-case, the on-site generation at equilibrium for price-anticipating tenants can be arbitrarily worse than the socially optimal, i.e., the socially optimal can use no on-site generation while the equilibrium outcome uses only on-site generation. Theorem 13. Suppose that Assumption 1-3 hold. For anyε > 0, N ≥1, there exist cost functions c1, . . . ,cN, such that the on-site generation in the market equilibrium compared to the optimal is given by ya−y∗≥δ−ε.
This is a particularly disappointing result since a key goal of the mechanism is to obtain load shedding from the tenants. However, the proof emphasizes that this is unlikely to occur in practice. In particular, the worst-case scenario is that there exists a dominant (monopoly) tenant, which is unlikely in a multi-tenant colo, that has a cost function asymptotically linear with unit cost roughly matching the on-site generation priceα. We confirm this in a case study in Section 6.
4.3. Discussion
The main results for the price-taking and price-anticipating analyses are summarized in Table 1. Note that sim-plified bounds are presented in the table, to ease interpretation, and the interested reader should refer to the theorems in §4.1 and §4.2 for the actual bounds. Also, note that the benchmark for social cost we consider is an ideal, but not achievable, mechanism.
Tenants Price Ratio Colo Saving Welfare Loss Price-taking [N−1
N , 1] [0, αδ/N] [0, αδ/2N]
Price-anticipating [N−1
N , 1] [0, αδ/N] [0, αδ/N]
Table 1. Performance guarantee ofColoEDRcompared to the social optimal allocation. 11
To summarize the results in Table 1 briefly, note first thatColoEDRalways benefits the operator, since the price paid to tenants to reduce energy is always less than the socially optimal price, and the total cost incurred by operator for energy reduction is also less than that of the social optimal. Secondly,ColoEDRalso gives the tenants approximately the social optimal payment, since the operator’s additional benefit is bounded above byαδ/N, and the welfare loss is bounded above byαδ/N. This naturally means that the loss in payment for tenants compared to the social optimal is at most 2αδ/N, which approaches 0 asNgrows. Third, regardless of tenants being price-taking or price-anticipating,
ColoEDRis approximately socially cost-minimizing as the number of tenants grows.
However, whileColoEDR is good in terms of operator, tenant, and social cost, it may not use the most envi-ronmentally friendly form of load reduction: in the worst case, the upper bound on the extra on-site generation that
ColoEDRuses is not decreasing with N. However, the analysis highlights that this worst-case occurs when there exists a dominant tenant with unit cost of energy reduction that is consistently just below the cost of diesel over a large range of energy reduction. As our case study in §6 shows, this is unlikely to occur in practice. So,ColoEDRcan be expected to use an environmentally friendly mix in most realistic situations.
5. Pricing Tenant Load Shedding in Voluntary EDR
We now turn from mandatory EDR to voluntary EDR and show how the analysis and design ofColoEDRcan be extended. Under voluntary EDR, a colo operator is offered a certain compensation rate for load reduction and can cut any amount of energyat willwithout any obligation. Voluntary EDR often supplements mandatory EDR, and both are widely adopted in practice [4, 8]. Since the colo operator can freely decide on the amount of energy to cut based on the compensation rate [4], the amount of energy reduction from tenants isfullyelastic, differing from mandatory EDR where the total energy reduction (including diesel generation if necessary) needs to satisfy a constraintδ.
In the following, we formulate the problem and generalizeColoEDRfor the voluntary EDR setting. Furthermore, we illustrate that the efficiency analysis, though more complicated, parallels that of mandatory EDR.
5.1. Problem Formulation
During a voluntary EDR event, the LSE offers a reward ofufor each unit of energy reduction (or diesel generation if applicable). In our setting, the colo operator aims at maximizing its profit through extracting loads from tenants using parameterized supply function bidding, as considered for mandatory EDR.
A key difference with the case of mandatory EDR is that, since the reduction is flexible, diesel generation need not be considered. In particular, if the reward offered the LSE for reduction is larger than the cost of diesel, then the operator can contribute its whole diesel capacity and, if the reward is smaller than the cost of diesel, no diesel need be used. In the mandatory EDR setting, operator needs to use diesel generation when tenants’ energy reduction (i.e., tenants’ bids are high) is not enough, in order to meet the reduction requirementδ; in the voluntary EDR case, there is no mandatory energy reduction target and thus, the optimization of diesel generation by the operator is separable from the optimization of tenant reduction.
This yields a situation where the net profit (from tenant reduction) received by the colo operator is:
u·d−p·d (22)
where pis the unit price the colo operator pays to the tenants to solicit d units of reduction in aggregate fromN
tenants, where tenantihas reduction capacityDi.
An overview ofColoEDR. It is straightforward to adaptColoEDRto this setting. We outline its operation in four steps below, which parallel the steps in the case of mandatory EDR.
1. The colo operator receives the voluntary EDR reduction priceuand broadcasts the supply functionS(bn,p) to
tenants according to
Si(bi,p)=Di− bi
p, (23)
2. Participating tenants respond by placing their bidsbnin order to maximize their own payoff;
3. The colo operator decides the total amount of reduction from tenantsdand market clearing pricepto maximize its utility. Given the bidsb=(b1, . . . ,bn), if the operator decides to offerdamount of energy reduction to the
utility, then the market clearing pricepneeds to satisfyPn
i=1Si(bi,p)=dand hence,pwill be
p= Pn i=1bi Pn i=1Di−d . (24)
Hence, to maximize the operator’s profit, the operator will chooosedsuch that
d= arg max 0≤d≤Pn i=1Di (u−p)d = u− Pn i=1bi Pn i=1Di−d ! d. (25)
4. Voluntary EDR is exercised.∀n∈ N, tenantnshedsS(bn,p), and receivespS(bn,p) reward.
Discussion. A key difference in the operation ofColoEDRfor mandatory EDR and voluntary EDR is in the form of the supply function (23). In particular, for voluntary EDR, we allow heterogeneity in the supply function for tenants in terms of their capacityDn. Recall, however, that in the case of mandatory EDR the required reduction capacityδ
was used. This difference stems from the fact that the reduction target is flexible for voluntary EDR and also creates significant challenges – both in terms of efficiency, since it allows the chance of market power to emerge because of capacity differences, and for analysis, since it adds considerable complexity.
5.2. Efficiency Analysis ofColoEDRfor Voluntary EDR
Given the adaptation of ColoEDR to the voluntary EDR setting, it is natural to ask how the efficiency of the
mechanism changes when the operator has full flexibility in deciding the amount of response to a voluntary EDR signal. Intuitively, the increased flexibility leads to the possibility of more inefficiency, but how large is this effect?
We again quantify efficiency through a comparison with the (socially) optimal outcome. Assume that each tenant has a costci(·) associated with energy reduction that is convex, increasing, andci(x) = 0,∀x ≤ 0 (Assumption 1).
Then, the allocation that maximizes social utility (the sum of operator’s and tenants’ utility) solves the following problem max d,s ud − n X i=1 ci(si) (26a) subject to n X i=1 si=d (26b) 0≤si≤Di. (26c)
Finally, note that our analysis makes the following natural assumptions on the unit priceuand the marginal cost of each tenant. Note that these are analogous to Assumption 2 and Assumption 3, respectively.
Assumption 4. The market clearing price p is lower than the price offered by the utility for any d>0, i.e., u≥ Pni=1bi Pn
i=1Di.
Assumption 5. The marginal cost of each tenants satisfies∂+cn(z)
∂z z=0 ≥ νnu 2 ,∀n.
Before moving to the main results, let us first define some notations. Lettingνn= Dn Pn
i=1Di, we have
P
nνn=1.Here νnbehaves like “market share” of tenantnin the voluntary EDR market. In the mandatory EDR case,νn=1/Nfor all
n. Furthermore, defineν=maxnνn, as the “dominant share” in load reduction among the tenants, andD=maxnDn. 5.3. Market Equilibrium Characterization
As in the case of mandatory EDR, we consider both price-taking and price-anticipating tenants. 13
5.3.1. Price-taking Tenants
Recall that a price-taking tenant considers the price as is without accounting for the impact of its bidding decision on the market clearing price. Hence, given the other tenants’ bidding decisions, each price-taking tenantnoptimizes the following payoffover bidding valuebn,
Pn(bn,b−n)=pSn(bn,p)−cn(Sn(bn,p))=pDn−bn−cn(Dn− bn
p)
So, in a price-taking equilibrium (b,d,p),Pn(bn;b−n)≥Pn(¯bn;b−n) holds for each tenantnover all ¯bn≥0. Also, the
market clearing pricepmust satisfy (24) and the total reductiondmust satisfy (25). Using techniques similar to the proof of Theorem 3, we can completely characterize the price-taking equilibrium ofColoEDRin voluntary EDR as follows:
Theorem 14. There exists a unique equilibrium of the game defined by(P1, . . . ,PN)forColoEDRin voluntary EDR. For such an equilibrium, the vectorst defined by st
n = S(p(bt),btn)is the unique optimal solution to the following optimization: max ud− ud 2 2P nDn −X n cn(sn) (27a) s.t. X n sn=d (27b) d≥0, 0≤sn≤Dn, n=1, . . . ,N, (27c) 5.3.2. Price-anticipating Tenants
Recall that a price-anticipating tenant actively seek to change market price through its bid to maximize payoff. Hence, given the other tenants’ bidding decisions, each price-anticipating tenantnoptimizes the following payoffover bidding valuebn, the payofffunctionQn(bn,b−n) can be derive in a similar manner as (16):
Qn(bn,b−n)=p(b)Sn(bn,p)−cn(Sn(bn,p))=νn p Σmbm v t u n X i=1 Di−bn−cn(Dn− bn Σmbm r Pn i=1Di u ),
So, in a price-anticipating equilibrium (b,d,p), we must haveQn(bn;b−n)≥ Qn(¯bn;b−n) for allnover all ¯bn. Also,
the market clearing pricepmust satisfy (24) and the total reductiondmust satisfy (25).
Using techniques similar to the proof of Theorem 7, we can completely characterize the price-anticipating equi-librium ofColoEDRin voluntary EDR as follows.
Theorem 15. There exists a unique equilibrium of the game defined by(Q1, . . . ,QN)forColoEDRin voluntary EDR. For such an equilibrium, the vectorsa defined by sa
n = S(p(ba),ban)is the unique optimal solution to the following optimization: max ud− ud 2 2P nDn −X n ˆ cn(sn) (28a) s.t. X n sn=d (28b) d≥0, 0≤sn≤Dn, n=1, . . . ,N, (28c)
Tenants Price Ratio Colo Extra Profit Welfare Loss Price-taking [1− d∗ ΣnDn, 1] [0, ud ∗2/Σ nDn] [0, ud∗2/2ΣnDn] Price-anticipating [1−Σd∗ nDn, 1] [0, ud ∗2/Σ nDn] [0, u(ΣnDnνn+d∗2/ΣnDn)/2]
Table 2. Performance guarantee ofColoEDRcompared to the social optimal allocation.
where, for sn≥0, ˆ cn(sn)= 1 2 sn νnu 2 +cn(sn) +1 2 Z sn 0 s νnu 2 − ∂+cn(z) ∂z !2 +2∂+cn(z) ∂z zu ΣiDi dz, (29) and for sn<0, cˆn(sn)=0.
Like in the case of mandatory EDR, the above characterization can be approximated using a modified cost function whenνnis small, i.e., when there are a large number of tenants and all tenants have similar market shares.
Lemma 16. For0≤sn≤Dn, the modified cost in(29)can be upper and lower bounded by, cn(sn)≤cˆn(sn)≤cn(sn)+sn
νnu
2 ,
Furthermore, where the left or right derivatives are defined, we have ∂−c n(sn) ∂sn ≤ ∂ −cˆ n(sn) ∂sn ≤∂ +cˆ n(sn) ∂sn ≤ ∂ +c n(sn) ∂sn + νnu 2 . (30a)
5.4. Bounding Efficiency Loss
We now use the characterization results in Theorem 14 and Theorem 15 to analyze the social efficiency of
ColoEDRin the voluntary EDR setting for both price-taking and price-anticipating tenants.
Theorem 17. For price taking tenants, the welfare loss ofColoEDRin voluntary EDR is bounded by udt−P
ncn(stn)≥ ud∗−P
ncn(s∗n)− ud∗2 2P
nDn.Moreover, the bound is tight.
Theorem 18. For price anticipating tenants, the welfare loss ofColoEDRin voluntary EDR is bounded by uda −
P ncn(san)≥ud ∗−P ncn(s∗n)− u 2 ΣnDnνn+ d ∗2 ΣnDn .
Theorem 17 highlights that the price-taking market equilibrium is efficient when the optimal energy reductiond∗
is small. This is due to the profit maximizing behavior of the operator: when the social optimald∗is large, the operator has greater opportunity to raise his profit by lowering the market price.
Comparing Theorem 18 with Theorem 17, we can see that the additional welfare loss due to price-anticipating behavior of tenants is a function ofνn, the market share of the tenants. It is easy to see that the additional loss of social
welfare is minimized whenνn=1/Nfor alln, i.e., when the reduction capacity of each tenant is equal.
Additionally, we can obtain tight bounds on the market clearing price, energy reduction quantity, and operator’s profit in a similar fashion as our analysis done for the mandatory EDR case using Theorem 14 and Theorem 15. Due to space constraints, we summarize the results in Table 2 and Table 3.
Table 2 shows that as the optimal reductiond∗increases, there is more opportunity for the operator to profitably
reduce market price and increase his own profit. Table 3 shows further that, when tenants are price-anticipating, they will drive the market clearing price up, provide less energy reduction and reduce the operator’s profit. However, all these additional losses can be bounded by linear functions ofν, the dominant share of the energy reduction capacity. Hence, the loss due to price-anticipating behavior of tenants is minimizedD1=D2=· · ·=DN.
Price Markup Load Reduction Operator’s cost [0, uν/2] [−D/2, 0] [0, uD]
Table 3. Performance guarantee ofColoEDRwhen tenants are price-anticipating compared to them being price-taking. 6. Case Study
Our goal in this section is to investigateColoEDRin a realistic scenario. Given the theoretical results in the prior sections, we know thatColoEDRis efficient for both the operator and tenants when the number of tenants is large, but that it may use excessive on-site generation (in the worst case). Thus, two important issues to address in the case study are: How efficient is the pricing mechanism in small markets, i.e., when N is small? What is the impact of the pricing mechanism on on-site generation in realistic scenarios? Additionally, the case study allows us to better understand when it is feasible to obtain load shedding from tenants, i.e., how flexible must tenants be in order to actively participate in a load shedding program?
Due to space constraints, we discuss only mandatory EDR in this section. The results in the case of voluntary EDR are parallel and hence omitted for brevity.
6.1. Simulation Settings
We use trace-based simulations in our case study. Our simulator takes the tenants’ workload trace and a trace of mandatory EDR signals from Pennsylvania-New Jersey-Maryland Interconnection (PJM) [4] as its inputs. It then executesColoEDR(by emulating the bidding process and tenants’ energy reduction for EDR) at each timestamp of the EDR signal, and outputs the resulting equilibrium. The settings we use for modeling the colocation data center and the tenant costs follow.
Colocation data center setup. We consider a colocation data center located in Ashburn, VA, which is a major data center market served by PJM Interconnection. By default, there are three participating tenants interested in EDR, though we vary the number of participating tenants during the experiments.
Each participating tenant has 2,000 servers, and each server has an idle and peak power of 150W and 250W, respectively. The default PUE of the colo is set to 1.5 (typical for colo), and hence, whenever a tenant reduces 1kWh energy, the corresponding energy reduction at the colo level amounts to 1.5kWh. Thus, the maximum possible power reduction is 2.25MW (i.e., 1.5MW IT plus 0.75MW non-IT). We assume that the colo operator counts the extra energy reduction at the colo level as part of the tenants’ contributions, and rewards the tenants accordingly.
The colo has an on-site diesel generator, which has cost $0.3/kWh estimated based on typical fuel efficiency [36]. For setting the energy reduction target received by the colo, we follow the EDR signals issued by PJM Intercon-nection from 5:00am to 11:00am on January 7, 2014, when many states in the eastern U.S. experienced an extremely cold weather and faced an electricity production shortage [37]. Fig. 1(b) shows the total energy reduction target set by PJM during that day for all participating colos. In our simulation, we keep the shape of the energy reduction target but scale down the reduction amount based on real power consumption in our considered colo.
Tenant workloads characteristics. We choose three representative types of workloads for participating tenants: tenant 1 is running high sensitive workloads (e.g., user-facing web service), tenant 2 is running low delay-sensitive workloads (e.g., enterprise’s internal services), and tenant 3 is running delay-tolerant workload (e.g., back-end processing).
The workload traces for the three participating tenants were collected from server utilization log of MSR [38], Wiki [39], and Florida International University, respectively. Fig. 1(a) illustrates a snapshot of the traces of server cluster utilization over 24 hours, where the workloads are normalized with respect to each tenant’s maximum service capacity. For our evaluation based on PJM EDR signals, we only use the traces from Hour 5–11 (i.e., 5:00am– 11:00am). The illustrated results use an average utilization for each tenant of 30%, consistent with reported values from real systems [9]. Our results are not particularly sensitive to this choice.
There are various power management techniques, e.g., load migration/scheduling, that can be used for reducing tenants’ server energy. Here, as a concrete example, we consider that tenants dynamically consolidate workloads and turn on/offservers for energy saving subject to SLA [40]. This power-saving technique has been widely studied [40, 41] and also recently applied in real systems (e.g., Facebook’s AutoScale [42]).
0 4 8 12 16 20 24 0 0.2 0.4 0.6 Hour W o rkl o a d MSN Wiki University MSNMSR (a) 4 5 6 7 8 9 10 11 12 0 500 1000 1500 2000 2500 Hour EDR (MWh) (b)
Figure 1.(a)Workload traces.(b)Energy reduction for PJM’s EDR on January 7, 2014 [37].
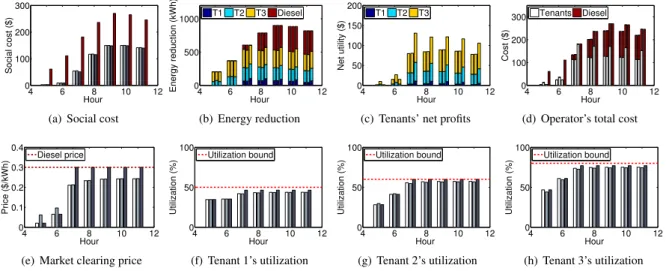
4 6 8 10 12 0 100 200 300 Social cost ($) Hour
(a) Social cost
4 6 8 10 12 0 500 1000 Hour Energy reduction (kWh) T1 T2 T3 Diesel (b) Energy reduction 4 6 8 10 12 0 50 100 150 200 Hour Net utility ($) T1 T2 T3
(c) Tenants’ net profits
4 6 8 10 12 0 100 200 300 Hour Cost ($) Tenants Diesel
(d) Operator’s total cost
4 6 8 10 12 0 0.1 0.2 0.3 0.4 Price ($/kWh) Hour Diesel price
(e) Market clearing price
4 6 8 10 12 0 50 100 Utilization (%) Hour Utilization bound (f) Tenant 1’s utilization 4 6 8 10 12 0 50 100 Utilization (%) Hour Utilization bound (g) Tenant 2’s utilization 4 6 8 10 12 0 50 100 Utilization (%) Hour Utilization bound (h) Tenant 3’s utilization Figure 2. Performance comparison under default settings. Throughout this and later plots, the bars in each cluster are the taking, price-anticipating, socially optimal, and diesel only (if applicable) outcomes.
When tenants save energy for EDR by turning offsome servers, their application performance might be affected. We adopt a simple yet common model based on an M/G/1/Processor-Sharing queueing model, as follows. For a tenant withM servers each with a service rate ofµ, denote the workload arrival rate byλ. Whenmservers are shut down, we model the total delay cost as ¯c(m)=λ·β·T·delay(m)= 1βT
νM−M1−m
, whereν=µλMdenotes the normalized workload arrival (i.e., utilization without turning offservers), T is the duration of an EDR event, and βis a cost parameter ($/time unit/job). In our simulations, we set the cost parameter for tenant 1, tenant 2 and tenant 3 as 0.1, 0.03, 0.006, respectively, which are already higher than those considered in the prior context of turning off servers for energy saving [40]. Note that we have experimented with a variety of other models as well and the results do not qualitatively change.
We use a standard model for energy usage [9] and take the energy reductionsas linear in the number of servers shut down, i.e.,s=θ·m, whereθis a constant decided by server’s idle power andT. Then, it yields the following cost function for a tenant’s energy reductionc(s)=c¯(θs)−c¯(0), where ¯c(·) is defined in the above paragraph. Note that we have experimented with a variety of other forms, and our results are not sensitive to the details of this cost function.
Finally, note that tenants typically have a delay performance requirement. Based on the above queueing model, this can be translated as an utilization upper bound. Such a translation is also common in real systems (e.g., default policy for auto-scaling virtual machines [43]). In our simulation, we capture the performance constraint by setting utilization upper bounds for tenant 1, tenant 2, and tenant 3 as 0.5, 0.6, and 0.8, respectively.
Efficiency benchmarks.Throughout our experiments, we consider the price-taking, price-anticipating, and social optimal outcomes. Additionally, we consider one other benchmark,diesel only, which is meant to capture common practice today and to highlight that any tenant response extracted “greens” data center demand response. Under diesel only, the full EDR response is provided by the on-site diesel generator. Throughout, our results are presented in grouped bar plots with the bars representing (from left to right) the price-taking, price-anticipating, social optimal,
3 6 9 12 15 18 0 100 200 300 Social cost ($) # of tenants
(a) Social cost
3 6 9 12 15 18 0 0.1 0.2 0.3 0.4 Price ($/kWh) # of tenants Diesel price (b) Market price 3 6 9 12 15 18 0 50 100 150 200 250 # of tenants Net utility ($) T1 T2 T3
(c) Tenants’ net profits
3 6 9 12 15 18 0 200 400 # of tenants Cost ($) Tenants Diesel
(d) Operator’s total cost Figure 3. Impact of number of tenants.
and diesel only (if applicable) outcomes.
While other mechanisms (e.g., direct pricing [16], auction [35]) have been introduced in recent papers, we do not compareColoEDRwith them here becauseColoEDRis already typically indistinguishable from the social optimal cost.
6.2. Performance Evaluation
We now discuss our main results, shown in Fig. 2.
Social cost.We first compare in Fig. 2(a) the social costs (4) incurred by different algorithms. Note thatColoEDR
is close to the social cost optimal under both price-taking and price-anticipating cases even though there are only three participating tenants. Further, the resulting social costs in both the price-taking and price-anticipating scenarios are significantly lower than that of the diesel only outcome. This shows a great potential of tenants’ IT power reduction for EDR, which is consistent with the prior literature on owner-operated data center demand response [15, 16, 2].
Energy reduction contributions.Fig. 2(b) plots EDR energy reduction contributions from tenants and the diesel generator. As expected from analytic results, both price-taking and price-anticipating tenants tend to contribute less to EDR (compared to the social optimal) because of their self-interested decisions. In other words, given self-interested tenants, the colo operator needs more diesel generation than the social optimal. Nonetheless, the difference is fairly small, much smaller than predicted by the worst-case analytic results. This highlights that worst-case results were too pessimistic in this case. Of course, one must remember that all tenant reduction extracted is in-place of diesel generation, and so serves to make the demand response more environmentally friendly.
Benefits for tenants and colocation operator.We show in Fig. 2(c) and Fig. 2(d) that both the tenants and the colo operator can benefit fromColoEDR. Specifically, Fig. 2(c) presents net profit (i.e., payment made by colo operator minus performance cost) received by tenants, showing that all participating tenants receive positive net rewards. While price-anticipating tenants can receive higher net rewards than when they are price-taking, the extra reward gained is quite small. Similarly, Fig. 2(d) shows cost saving for the colo operator, compared to the “diesel only” case.
Market clearing price.Fig. 2(e) shows the market clearing price. Naturally, when usingColoEDRto incentivize tenants for EDR while minimizing the total cost, the colo operator will not pay the tenants at a price higher than its diesel price (shown via the red horizontal line). We also note that the price under the price-anticipating case is higher than that under the price-taking case, because the price-anticipating tenants are more strategic. However, the price difference between price-anticipating and price-taking cases is quite small, which again confirms our analytic results. Tenant’ server utilization.Tenants’ server utilizations are shown in Figs. 2(f), 2(g) and 2(h), respectively. These illustrate that, while tenants reduce energy for EDR, their server utilizations still stay within their respective limits (shown via the red horizontal lines), satisfying performance constraints. This is because tenants typically provision their servers based on the maximum possible workloads (plus a certain margin), while in practice their workloads are usually quite low, resulting in a “slackness” that allows for saving energy while still meeting their performance requirements.
6.3. Sensitivity Analysis
To complete our case study, we investigate the sensitivity of the conclusions discussed above to the settings used. For each study, we only show results that are most significantly different than those in Fig. 2.
Impact of the number of tenants. First, we vary the number of participating tenants and show the results in Fig. 3. To make results comparable, we fix the EDR energy reduction requirement as well as total number of servers:
0.1 0.2 0.3 0.4 0.5 0.6 0 200 400 600 Social cost ($) Diesel price ($/kWh) (a) Social cost
0.1 0.2 0.3 0.4 0.5 0.6 0 500 1000 Diesel price ($/kWh) Energy reduction (kWh) T1 T2 T3 Diesel (b) Energy reduction 0.1 0.2 0.3 0.4 0.5 0.6 0 0.2 0.4 0.6 Price ($/kWh) Diesel price ($/kWh) Diesel price (c) Market price 0.1 0.2 0.3 0.4 0.5 0.6 0 100 200 300 400 Diesel price ($/kWh) Net utility ($) T1 T2 T3
(d) Tenants’ net profits Figure 4. Impact of diesel price.
20 40 60 80 100 120 0 500 1000 1500 2000 EDR requirement (%) Energy reduction (kWh) T1 T2 T3 Diesel
(a) Energy reduction
20 40 60 80 100 120 0 0.1 0.2 0.3 0.4 Price ($/kWh) EDR requirement (%) Diesel price (b) Market price Figure 5. Impact of EDR energy reduction target.
tenant 1, tenant 2 and tenant 3 are each equally split into multiple smaller tenants, each having fewer servers with the same workload arrival rate scaled down accordingly. We then aggregate replicas of the same tenant together for an easy viewing in the figures, e.g., “tenant 1” in the figures represent the whole group of tenants that are obtained by splitting the original tenant 1. One interesting observation is that as more tenants participate in EDR, the market becomes more “competitive”. Hence, each individual tenant can only gain less net reward, but both the price and the aggregate net reward become higher (see Figs. 3(b) and 3(c)). Motivated by this, one might suggest a possible trick: a tenant may gain more utility by splitting its servers and pretending to be multiple tenants. In practice, however, each tenant has only one account (for billing, etc.) which requires contracts and base fees, and thus pretending as multiple tenants is not viable in a colo.
Impact of the price of diesel. Fig. 4 illustrates how our result changes as the diesel price varies. Intuitively, as shown in Fig. 4(a), the social cost (which includes diesel cost as a key component) increases with the diesel price. We see from Figs. 4(b) and 4(c) that, when diesel price is very low (e.g., $0.1/kWh), the colo operator is willing to use more diesel and offers a lower price to tenants. As a result, tenants contribute less to EDR. As the diesel price increases (e.g., from $0.2/kWh to $0.3/kWh), the colo operator increases the market price (but still below the diesel price) to encourage tenants to cut more energy for EDR. Nonetheless, tenants’ energy reduction contribution cannot increase arbitrarily due to their performance constraints. Specifically, after the diesel price exceeds $0.4/kWh, tenants will not contribute more to EDR (i.e., almost all their IT energy reduction capabilities have been exploited), even though the colo operator increases the reward. In this case, tenants simply receive higher net rewards without further contributing to EDR, as shown in Fig. 4(d).
Impact of EDR requirement.Fig. 5 varies the EDR energy reduction target, with the maximum reduction ranging from 20% to 120% of the colo’s peak IT power consumption. As the EDR energy reduction target increases, tenants’ energy reduction for EDR also increases; after a certain threshold, diesel generation becomes the main approach to EDR, while the increase in tenant’s contribution is diminishing (even though the colo operator increases the market price), because of tenants’ performance requirements that limit their energy reduction capabilities.
Impact of tenants’ workloads. In Fig. 6(a)-6(b), we vary the tenants’ workload intensity (measured in terms of the average server utilization when all servers are active) from 10% to 50%, while still keeping the maximum utilization bounds to 50%, 60% and 80% as the performance requirements for the three tenants, respectively. While it is straightforward that when tenants have more workloads, they tend to contribute less to EDR, because they need to keep more servers active to deliver a good performance. Nonetheless, even when their average utilization without turning offservers is as high as 50% (which is quite high in real systems, considering that the average utilization