ΠΑΝΕΠΙΣΤΗΜΙΟ ΘΕΣΣΑΛΙΑΣ
ΤΜΗΜΑ ΗΛΕΚΤΡΟΛΟΓΩΝ ΜΗΧΑΝΙΚΩΝ ΚΑΙ ΜΗΧΑΝΙΚΩΝ
ΥΠΟΛΟΓΙΣΤΩΝ
“Ανίχνευση Επιθέσεων με τη χρήση Μηχανικής Μάθησης”
“Intrusion Detection Using Machine Learning”
Διπλωματική Εργασία
Οικονόμου Χρυσούλα
Επιβλέποντες Καθηγητές: Αντωνόπουλος Χρήστος, Λάλης Σπύρος
Βόλος, 10 Οκτωβρίου 2018
iii
Ευχαριστίες
Με την ολοκλήρωση της Διπλωματικής Εργασίας μου θα ήθελα πρωτίστως να ευχαριστήσω τον επιβλέποντα καθηγητή μου κύριο Αντωνόπουλο Χρήστο, για την εξαιρετική συνεργασία και την ουσιαστική καθοδήγηση που μου προσέφερε κατά τη διάρκεια της εκπόνησης. Η άμεση ανταπόκρισή του, όποτε χρειάστηκα βοήθεια, ήταν καταλυτική στην ομαλή ολοκλήρωση της εργασίας. Επιπλέον, οφείλω ένα μεγάλο ευχαριστώ στην οικογένειά μου και κυρίως στη μητέρα μου. Η στήριξη τους, συναισθηματική και υλική, ήταν κομβική, όχι μόνο κατά την περάτωση της εργασίας αλλά και στη συνολικότερη πορεία μου ως σήμερα. Ακόμη θα ήθελα να ευχαριστήσω τη Μαρίνα, το Γιώργο, το Γιώργο, την Έλενα και όλους τους φίλους μου, που ήταν διπλά μου σε αυτό το επταετές ταξίδι . Τέλος, θα ήθελα να ευχαριστήσω το Θεόφιλο για την υπομονή του, και τη στήριξη που μου παρέχει όλο αυτόν τον καιρό. Χωρίς όλους αυτούς του ανθρώπους, όλα θα ήταν πολύ πιο δύσκολα και σίγουρα όχι τόσο όμορφα.iv
Περίληψη
Η συνεχής αύξηση των έξυπνων συσκευών, όπως επίσης και η ψηφιοποίηση εταιριών και δημόσιων υπηρεσιών, οδήγησε σε μία αξιοσημείωτη αύξηση της κίνησης στο Διαδίκτυο. Επιπλέον, οι τεχνολογίες του Διαδικτύου των Πραγμάτων (Internet of Things), επέφερε τη δημιουργία πολυάριθμων δικτύων υπολογιστών, που κατακλύζονται –πολύ συχνά- από ευαίσθητες πληροφορίες. Όλα τα παραπάνω δημιούργησαν την επιτακτική ανάγκη για δυνατούς μηχανισμούς ασφάλειας, με στόχο την προστασία των προσωπικών δεδομένων που κυκλοφορούν στο διαδίκτυο, καθημερινά Τα Συστήματα Ανίχνευσης Εισβολών έχουν σημαντικό ρόλο στη διαδικασία διασφάλισης ενός δικτύου υπολογιστών. Χρησιμοποιήσαμε μια τεχνική μηχανικής εκμάθησης, συγκεκριμένα, Τεχνητά Νευρωνικά Δίκτυα που εκπαιδεύονται με τεχνικές Βαθιάς Εκμάθησης, για να δημιουργήσουμε ένα Σύστημα Ανίχνευσης Εισβολών που τροφοδοτείται και ελέγχεται από με τις AWID βάσεις δεδομένων του Πανεπιστημίου Αιγαίου. Δοκιμάσαμε Δυαδικούς και Πολυταξικούς Ταξινομητές και χρησιμοποιήσαμε δύο διαφορετικά σετ τροφοδοσία. Η ταξινόμηση αφορούσε σε Μεθόδους Εκτέλεσης επιθέσεων. Συγκεκριμένα, τις Flooding, Impersonation and Injection.Η βασική συνεισφορά αυτής της εργασίας, είναι πως δεν υπάρχουν δημοσιευμένα άλλα εγχειρήματα αξιολόγησης Δυαδικών Ταξινομητών που χρησιμοποιούν τη Βαθιά Εκμάθηση. Έτσι, μπορεί να αποτελέσει το εναρκτήριο σημείο για περαιτέρω βελτιώσεις.
v
Abstract
The constant increase of smart devices, as well as the digitalization of both enterprises and social services led to a notable growth of traffic over Internet. Moreover, Internet of Things Technologies induced the creation of numerous computer networks that are flooded with –very commonly- sensitive information. All the above induce the need of building strong security systems, in order to protect the personal information which are communicated through Internet every day.
Intrusion Detection Systems (IDS) play a major role in the procedure of keeping a computer network secure. Thus, they are widely used as defending mechanisms. We used a machine learning technique, especially Deep Learning Artificial Neural Networks, to create an IDS that is trained and tested with the AWID datasets. We experimented with both Multi-Class and Binary Classifiers and tried different Input Sets. The classification concerned Attack Execution Methods, namely Flooding, Impersonation and Injection. The main contribution of this dissertation is that there are no other published projects using Binary Classifiers that are trained with Deep Learning Methods. Thus, this can be the starting point for further improvements.
vi
Table of Contents
Ευχαριστίες iii Περίληψη iv Abstract v 1. Introduction 1 2 Related Work 2 3 Background 43.1 Intrusion Detection Systems 4
3.2 Artificial Neural Networks 6
3.3 Feature Selection 9
3.4 Datasets 11
3.4.1 The AWID Dataset 12
3.4.1.1 Methodology of Attack Execution 13
4. Implementation 19
4.1 Keras and Tensorflow 19
4.2 Result Metrics 20
4.3 Artificial Neural Network Models 21
4.3.1 Multi-Class Classifier 21
4.3.2 Multiple Binary Classifiers 26
4.4 Results 31
5. Conclusions and Future Work 33
1
1. Introduction
During the past decade the use of computers and smart devices has increased significantly and this upturn does not seem to stop in the next years. According to Cisco Visual Networking Index(“Cisco Visual Networking Index: Global Mobile Data Traffic Forecast Update”,2016) “The total number of smartphones (including phablets) will be over 50 percent of global devices and connections by 2021”, as well as “Smartphones will surpass four-fifths of mobile data traffic (86 percent) by 2021.” More devices connected to the internet means more personal data exposed. This increase is not applied just in terms of private using. In most developed countries, there is an ongoing effort of digitalizing social services such as healthcare and tax services. As far as industries are concerned, it is worth mentioning that new technologies, such as Big Data and Cloud Computing, are widely embraced. As a result, the need of securing all these data and transactions, that are digitally recreated, is getting an issue of great importance.
It is also notable, that another technology advance which has brought up a lot of security challenges, because of its rapid development, is the Internet of Things (IoT). The IoT gives people the opportunity to create a network of physical devices, in order to remotely control them. These devices include simple home appliances, as well as medical devices and factories heavy equipment. Thus, intrusions in such networks may have dangerous costs.
In order to protect networks and information systems, the first step that should be made is to be able to recognize an attempt of intrusion. By doing so, the intrusion can be stopped and the defender can create a stronger and more sophisticated shield against the attack. Intrusion Detection Systems (IDS) aim to secure networks from attacks, in order to preserve the confidentiality, integrity and availability (also known as CIA triad) of information. On the other hand, attackers try to take advantage of a system security vulnerabilities in order to gain root access as to control them, retrieve data or damage them.
2
This dissertation introduces an IDS that uses machine learning and specifically neural network, and uses the AWID dataset for training and testing purposes. We created two Artificial Neural Networks that have different architectures. The first one is a multi-class classifier, while the second one consists of stacked binary ones. Furthermore, we experimented with two different sets of attributes as input. We compare the results, based on handful of aspects, as the number of false alarms or the accuracy rates.
Even though there have been several experiments including neural networks and the AWID dataset, this is the first attempt to test this dataset on a binary Artificial Neural Network. All previous projects (described in Section 2) had multi-class classification models and experimented with different training algorithms.
The rest of the manuscript is organized as follows: Section 2 concerns the Related Work while Section 3 includes Background information. Our implementation is described in detail in Section 4. Finally Section 5 includes the Conclusions.
2 Related Work
Kolias et al. introduced the AWID dataset in 2016. This dataset consists of labeled WiFi packets, which are classified according to their attack type, or if they are harmful, they are just labeled as normal. Along with dataset, they presented the implementation of a variety of machine learning techniques, including artificial neural networks. However, the accuracy scores were quickly surpassed by the work of Thanthridge et al.(2016) , Aminanto et al.(2017,2018) and Usha and Kavitha(2016).
3
Thanthrige et al.(2016) published a paper, showing the importance of feature reduction and its impact on the detection accuracy and the classification speed of an IDS. In order to prove this, they also used multiple machine learning techniques. They used the AWID public datasets to train and test the IDSs created. Aminanto et al. (2017) tried to improve the Impersonation attack detection rate -compared to the results of Kolias et al. (2016). They used artificial neural networks to reduce the features and they experimented using the Stacked Auto Encoder learner. They manage to achieve a significant improvement to the rates.
This year, Aminato et al.(2018) managed to achieve the best performance in published literature(Aminanto et al., 2018). They did so, by using a weight-based feature selection method with a light machine-learning classifier.
Usha and Kavitha(2016) used a Support Vector Machine and the AWID dataset. This led to a better trade-off between detection accuracy and learning time, and at the same time a reduced false positives and computation complexity. Of course, they reduced the features used as input.
Thing (2017) proposed a deep learning approach for intrusion detection using the AWID datasets. They experimented the utilization of different activation functions in two different artificial neural networks, which included two and three hidden layers, respectively. Their 4-class classifiers achieved a 98.6688% overall accuracy.
The key difference, between these project and ours, is that we compare a multiclass classifier to a binary one, while the others compare different training algorithms.
4
3 Background
3.1 Intrusion Detection Systems
Intrusion Detection Systems are devices or software that track abnormal behavior and policy violations. The first IDS was introduced by Dorothy E. Denning in 1986. IDSs have a lot in common with firewalls as they both try to defend a network. However, firewall functionality differs from IDS, as the former prevent attackers from intruding the network. In contrast, IDSs identify potentially malicious activity and raise an alarm. Systems that detect such activities and, in addition, take some corresponding action are referred to as Intrusion Prevention Systems (IPS). Another major difference between these defending mechanisms is the fact that firewalls are exclusively network protecting mechanisms, while IDS can also be used to monitor malicious behaviour inside a system. In terms of system positioning IDS can be classified into two categories. The first one is the Network IDS (NIDS). As the name itself implies, NIDS are monitoring network traffic and aim to detect external attacks. The most notable advantage of NIDS is that they can defend all the devices connected to the network, and it does not require replication. The second category is the Host based IDS (HIDS). HIDS are located within a system, and besides network traffic, they also monitor the systems files and processes, in order to detect if there is any change in the critical ones. Because of this, HIDS have much more information to form the signature of a normal behavior which makes them more reliable.
5
Figure 3.1: Host-Based Intrusion Detection System (Retrieved from: “HIDS (Host-Based
Intrusion Detection System) - Bauman National Library”, n.d. )
L.P Dias et al.(2017) categorize IDSs based in the detection method used in Misuse or Signature Detection and in Anomaly Detection systems. The first type of IDS needs some predefined attack patterns in order to be able to recognize them. Every other kind of behavior is considered normal. Keeping in mind that attacks are constantly evolving and new types of attacks are made, in order to stay protected, the list of the predefined patterns should be very commonly updated. Of course, there is always the possibility that the update may come after the attack, but the danger can be regulated by increasing the update frequency. On the contrary, Anomaly Detection Systems functionality is characterized by the just reversed logic. As a consequence, the predefined patterns concern the normal behavior. Any different set of characteristics, is flagged as malicious behavior. It can be easily seen that this type of systems can be “overprotective”, since the networks traffic is not static and its features can widely vary (Sommer et al, 2010) even when there is no threatening behavior.
When it comes to IDS evaluation, a very common indicator of a well-developed one, is the amount of the true/false positives and true/false negatives. True positives refer to the packets, correctly classified as harmful, while true negatives are the packets that are
6
correctly classified as benevolent. False positives are the alarms that are signed by an IDS when there was not an actual malicious behavior. False positives are increased in Anomaly Detection Systems, due to the vast network diversity. False negatives refer to packets or generally activities that are considered harmless, while they shouldn’t be. It is clear that, false negatives are far more harmful for a system, but what should also be mentioned is that false positives require a significant amount of analyzing time which finally leads to a benign activity.
3.2 Artificial Neural Networks
In 1959 Arthur Samuel introduced the term Machine Learning. According to Samuel Machine Learning is the process that makes computers able to “learn”, in a very similar way that a human would, if given the same data. Machine Learning implies that computers are not pre-programmed to handle new data. It is the training session that leads the computer to make decisions, through statistics and pattern recognition. Machine Learning is a part of the greater field of Artificial Intelligence. There are a handful of approaches to apply Machine Learning. This paper studies Artificial Neural Networks learning algorithm.
Artificial Neural Networks are computing systems inspired by the human brain functionality. They try to mimic the process followed by neurons inside the brain. Just like the physical ones, artificial neurons that are “connected” to each other can communicate in order to process signals and finally classify them.
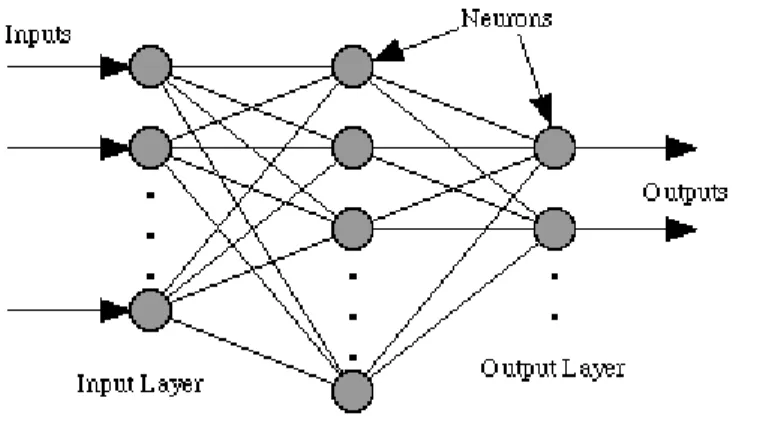
Considering the main architecture of ANNs, it can be organized in three basic parts. The first one the Input Layer. As the name implies, it is the part of the ANN that receives signals or patterns, in order to redirect them to the following layers. The second part is the Hidden or Intermediate layers. They are the layers that perform the most computational processes, as they are the ones responsible to combine the input data and then create patterns, in order to generalize the results. Unlike the other two categories, hidden layers can be multiple, according to the combination of computational complexity
7
and desired accuracy. The last part of the ANN architecture, is the Output layer which forms the final classification of the data, based in the previous layer computations.
Figure 3.2: Feedforward ANN Architecture (Retrieved from: Dawson et al, 2000)
All layers consist of neurons. Neurons are responsible for forwarding –or not- the signals inside the layers and among them. To do so, multiple functions are used, also known as Activation Functions. The most commonly used, beginning from the simplest one, are the Step, the Linear, the Sigmoid, the Tanh and the Relu functions. There is no need to use the same activation function in all hidden layers. Just like the number of hidden layers and the number of neurons, the choice between these functions is up to developer’s judgement.
Figure 3.3: Different types of Activation Function (Retrieved from: Malhotra, 2018 )
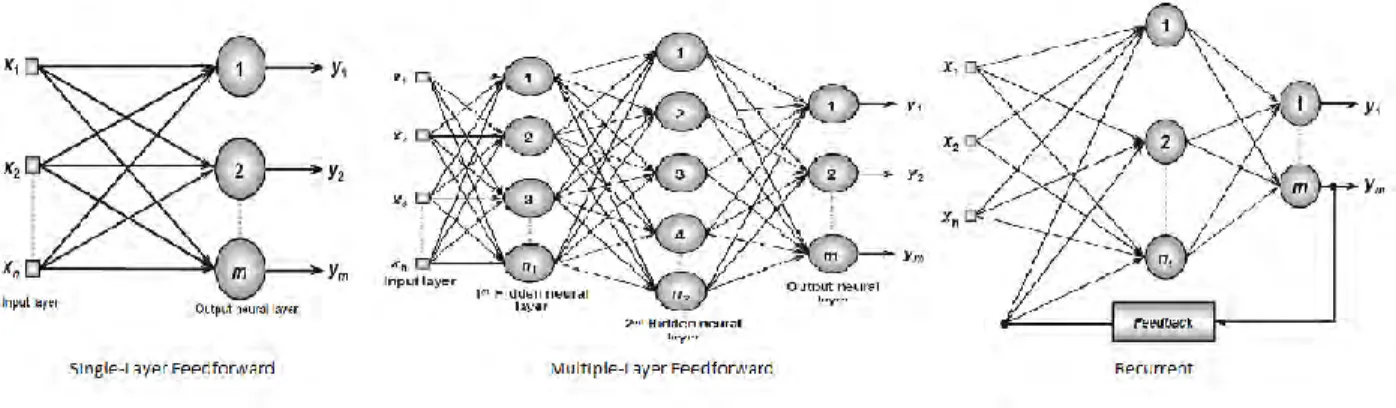
ANNs can be also classified in 3 categories based on the way neurons are organized. The first one is the Single-Layer Feedforward Architecture. It includes only the input and the output layer, so it is the least complex of the rest. The second is the Multiple-Layer Feedforward Architecture. Unlike the previous one, this architecture includes all three
8
basic layers. In addition, most of the times the number of layers exceeds 3. Namely, there are more than one hidden layers. Last but not least, is the Recurrent Architecture It is the most interesting and at the same time most complex architecture of all, as it uses its output as input for the subsequent computations.
Figure 3.4: ANN basic architectures (Retrieved from: Da, S. I. et al., 2017)
As Haykin(1999) notes, ANNs can perform tasks like pattern matching very skillfully, as a result of their capability of reorganizing their structure correspondingly. Furthermore, ANNs can learn and model relationships that linear programs are incapable of doing so. Another notable advantage of ANN is that they can generalize. After the first phase of the training, they can come up with relations between the data that were not obvious initially. What really makes ANNs useful, is their ability of learning and especially self-learning. Learning can be interpreted making a system able to correctly correspond to a new input or task after having been trained. Although, ANNs require a notable amount of computing resources because their architecture differs from the architecture of microprocessors (Shah et al. ,2012). Moreover, in order to develop an efficient ANN, it is of great importance to “feed” it with a large training set that also results in a considerable resource usage.
9
3.3 Feature Selection
The input layer of a ANN receives the key attributes of each data index, which are used to categorize the data. Most of the times, datasets include multiple attributes per index which are not always useful (not for all classifications). This is due to the fact that datasets are not exclusively created for single purposes. The same dataset can be used to make classifications according to different parameters. Namely, what might be useful for one classification problem, may be completely irrelevant for another.
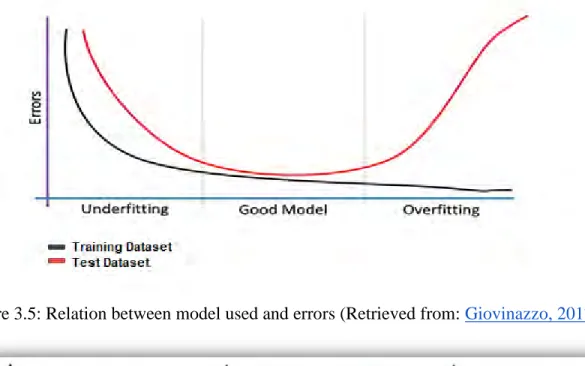
The correct choice of features used as input is very important, as two problems, with high impact on the results, may occur. If the features are misselected, in terms that more parameters than actually needed are used, then the model is driven to “overfitting “(Aalst et al., 2008). In other words, the patterns generated are too close to the training set and as a result, the generalization required to classify new data is very difficult. On the other hand, having fewer features, than the features necessary to identify the pattern, as input leads to “underfitting”. Underfitting refers to the incapability of a model to generate a pattern that corresponds correctly to the input due to the lack of important characteristics of the training set. Both overfitted and underfitted models fail on new datasets, while -quite obviously- overfitted ones have a very good performance on training sets.
10
Figure 3.5: Relation between model used and errors (Retrieved from: Giovinazzo, 2017)
Figure 3.6: Relation between model and data (Retrieved from: “Model Fit: Underfitting
vs Overfitting- Amazon Machine Learning”, n.d.)
All these, sum up to the fact that in order to develop an efficient ANN, one should take under consideration the need to pick certain index attributes, in other words, feature selection. Feature selection is a key step of creating a ANN. The impact of ignoring it is serious as it has a great reflection in accuracy rates. Overfeeding the network with excess information, makes the classification very difficult, as the common characteristics between the categories are only a small percentage of the total.
11
3.4 Datasets
As previously mentioned, a key part of developing an efficient ANN, is the training phase. Not only is it mandatory, but it also greatly determines the quality of the results. The dataset used during this process should be carefully chosen. According to the purpose of the ANN function one should take into consideration a variety of characteristics to evaluate. To start with, the size of the dataset plays a major role. It is clear that, if the input has a lot of entries, then it would be easier for the ANN to identify more accurate patterns and thus, be more efficient. However, a large dataset means a lot of computational processes, when at the same time it does not guarantee high accuracy rates. What should also be considered is the quality of the data. In other words, the data given as input should contribute to form the greatest picture. Each entry of the data consists of some attributes, also known as features. In fact these are the real input. It can be easily understood, that a dataset with a lot of missing attributes information, would lead to a low accuracy output. On the other hand, having a very large number of attributes is also ineffective. The generalization of the results would be almost impossible if the characteristics, that were to be examined, were excessive. Lastly, the most crucial matter, concerning the quality of the dataset, is the how updated the data is. There is absolutely no point in training a system with obsolete data. In conclusion, choosing the suitable data is as important as correctly developing the neural network.
In case of datasets needed in training Intrusion Detection Systems, the same aspects should be taken into account. However, there is another challenge that people in this domain face. There are a very few public datasets that can be used in the training phase. The most known public datasets are the DARPA/Lincoln Labs packet traces 1998 and 1999(“Datasets | MIT Lincoln Laboratory”, n.d.) and the KDD Cup 1999 Data(“KDD Cup 1999 Data”, 1999). It is more than obvious that a 20-year-old set is outdated. According to Moore’s Law the number of transistors in a dense integrated circuit doubles about every two years. This also reflects on processor performance. Attackers take advantage of their system properties in order to orchestrate more advanced attacks. This means faster or more sophisticated attacks. Keeping this in mind, it is clear that with the systems constantly advancing, it is quite probable that the number and severity of attacks
12
will increase. In order to intrude systems, attackers follow current technology and try to adapt to it. Thus, a dataset that old may not represent contemporary attacks. As Sommer et al.(2010) suggests, besides being outdated, these datasets have been over-studied and no interest is raised in recreating a NIDS responding to these attacks. The real question is why there are not a more datasets available. First of all, storing millions of packets raises privacy issues. It is not plausible to ensure that none of the millions of packets contains sensitive information. As a result, very frequently there are no legal permissions to do so. This leads to the effort of simulating network traffic, to create a dataset. The fact that Internet is not easily simulated as S. Floyd states, makes the creation even more difficult.
3.4.1 The AWID Dataset
The public dataset (Kolias et al., 2016), consists of two subsets, a large and a smaller one. Both subsets are divided in two parts the training and the evaluating one. What needs to noticed is that the test set is not derived from the training one. Thus the reliability of the results is not compromised. The datasets have 2 versions. In the first (ATK), data is classified into 16 categories in accordance with the kind of attack performed. The second one (CLS), has 4 categories according to the methodology of execution. Each entry in the dataset has 155 attributes, with the last one being the class label. In case of a missing value, the corresponding attribute is represented with a “?”.
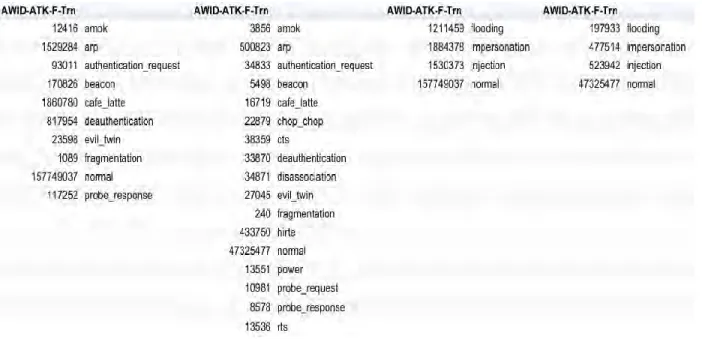
13 Table 3.1: Class distribution-Full set (Retrieved from: Kollias et al, 2014)
Table 3.2: Class distribution-Reduced set (Retrieved from: Kollias et al, 2014)
3.4.1.1 Methodology of Attack Execution
The paper focuses on the AWID-CLS sets, namely the classification that is made according to the methodology that is used during an attack. There are four categories that the packets are sorted into; Flooding, Impersonation, Injection and Normal.
14
● Flooding
Flooding is a Denial of Service (DoS) attack. DoS Attacks are orchestrated in order to bring a network or a server down. (“Understanding Denial-of-Service Attacks", 2013). To accomplish this, the network is “flooded” with connection requests and eventually becomes incapable to respond to any of them, even the not malevolent ones. When the number of requests excess the capacity of the memory buffer, the system can no longer establish new connections. Whether the attacker use one or more computers and internet connections to flood the network, the attack is characterized as DoS or DdoS (Distributed Denial of Service). DDoS attacks, as shown Figure 3.7, exist for a long time and they are getting more potent through the years.
15
Flooding attacks are multilayer ones (Regan et. al, 2017). They can be applied in layers other than the network. To be more specific, one can achieve Flooding attack in the Physical Layer through signal jamming. In the Data Link layer, the attacker “floods” the ARP tables, of the target network, with false MAC addresses resulting in the denial of access to channels for new nodes. The fourth and fifth layers, id est Transport and Application layers, Flooding attacks occur via SYN Flooding and certain malevolent programs.
● Injection
As the name itself implies, Injection attack refers to the process of “injecting” malicious code into a program. So as to achieve this, attackers provide the program with a malicious input. Then, the interpreter is misled to compile that input as a part of the genuine code. Eventually the attackers manage to change the normal execution flow in their interest without proper authorization. This kind of attacks have various impacts of scaled severeness. There can be a loss of data or a data theft, and if the attack is more sophisticated and a declaration of root privileges is achieved, there can even be a full system compromise.
The Open Web Application Security Project (“OWASP Top Ten 2017 Project - OWASP”, n.d.) lists Injection attacks as the number one application security risk. The reason behind this, besides the already noted impacts, is that apart from being very dangerous for the victim system, Injections attacks can easily spread widely. Injection attacks, such as SQL Injection (SQLi) and Cross-Site-Scripting (XSS), which also are the most common ones, are a very typical example of this characteristic when talking about legacy applications.
What is also alarming about Injection attacks is that the vulnerabilities allowing an attacker to inject malicious code, are very commonly present in websites. In 2010 WhiteHat Security released a report (“WhiteHat Security 9th Website Security Statistics Report”, 2010) presenting the percentage of the likelihood of a website having a
16
vulnerability by class. As it can be seen in Figure 3.8, Cross-Site scripting is the top in all types of scripting technologies.
Figure 3.8: Top Ten Classes of Attack (Retrieved from: “WhiteHat Security 9th Website Security Statistics Report”,2010 )
● Impersonation
The basic idea behind Impersonation Attacks is masquerading into a trusted -for the victim system- source. To achieve this the attacker uses a trusted node identity, such as Medium Access Control (MAC) address and/or Internet Protocol (IP) address. Even though there exist some security techniques such as Wired Equivalent Privacy (WEP), Wi-Fi Protected Access (WPA), and 802.11i (WPA2), attackers are not yet prevented from stealing such credentials. This happens due to the fact that encryption concerns only the data frames. Management and Control frames are vulnerable to spoofing (Lakshmi et al., 2014). Impersonation can occur in different forms, especially device cloning, address spoofing, unauthorized access, rogue access points and replay (Barbeau et al, 2006).
17
Device Cloning refers to mimicking a device by altering the attacker’s device to have H/W addresses of a trusted device. When the duration of this imitation is one frame, then another form of Impersonation happens; (MAC) address spoofing. The above techniques are key steps to deauthentication and disassociation attacks. Impersonation is very useful for gaining unauthorized access. The attacker may use the pre-referred techniques to obtain privileges and be able to access data or alter the network. Another form of Impersonation is the Rogue Access Point. In this case, there is an attacker station which is programmed to have the specifications of a trusted access point. Hence, many clients that are connected to the second one, at first, disconnect from the legitimate station and then they are connected to the attacker. Last but not least, Replay attacks concern the replay protection. Replay protection is made to guarantee that the packets received are not duplicates and that they are freshly generated.
Impersonation attacks are often orchestrated by bots. Attacker bots try to imitate human visitors so as to skip security barriers. Below are some graphs from the annual Imperva Incapsula Bot Traffic Report, now in its fifth year which is an ongoing statistical study of the bot traffic landscape. As is can be seen in Figures 3.9 and 3.10 bots visiting websites outnumber human visitors. This, in combination with the fact that “bad” bots are overwhelmingly impersonators, which can be observed in Figure 3.10 chart makes this kind of attack very important.
18
Figure 3.9: Traffic Breakdown (Retrieved from: Zeifman, 2017)
19
4. Implementation
Our goal is to create an Artificial Neural Network that serves as an Intrusion Detection System. During the process of optimizing the accuracy and the efficiency of it, we experimented with several ANN architectures and tried different structures concerning the total organization of the model. We suggest a deep learning approach with two or more hidden layers. The dataset that Kolias et al.(2016) provided, allowed us to build a supervised ANN because all the indexes were labeled. We chose the sets that classified the packets according to the methodology of the attack execution, especially the reduced ones (AWID-CLS-R-Tst, AWID-CLS-R-Trn). This chapter discusses the different approaches used and how the results are sensitive to the value of a number of parameters.
4.1 Keras and Tensorflow
To start with, we used Keras to build our ANN model. Keras(“Keras | TensorFlow” ,n.d.) is a high-level neural networks API, written in Python and capable of running on top of Tensorflow, CNTK(Seide et al., 2016) or Theano (Ketkar,2017). It was developed with a focus on enabling fast experimentation. It supports both convolutional networks and recurrent networks, as well as combinations of the two. Moreover, Keras models can run seamlessly on Graphics Processing Unit (GPU) and Central Processing Unit (CPU) (Keras | TensorFlow).
To perform the complex numerical computations required for the building of the ANN we used Tensorflow. TensorFlow(“TensorFlow”, n.d.). is an open source software library for high performance numerical computation. A very useful tool, in the process of creating the models was SciPy(“Scientific Computing Tools for Python — SciPy.org”, n.d.). SciPy (pronounced “Sigh Pie”) is a Python-based ecosystem of open-source software for mathematics, science, and engineering. In particular, we used NumPy and Matplotlib from the core packages. Matplotlib is a Python 2D plotting library which
20
produces publication quality figures (Hunter, 2007). NumPy is the fundamental package for scientific computing with Python.
4.2 Result Metrics
In order to evaluate the models, we will introduce 3 new metrics. The first one is the Recall or True Positive Rate (TPR):
𝑇𝑃𝑅 =
𝑇𝑃
𝑇𝑃+𝐹𝑁
Recall represents the percentage of correctly classified instances.
The second metric that we will use is the Miss Rate or False Negative Rate (FNR):
𝐹𝑁𝑅 =
𝐹𝑁
𝑇𝑃+𝐹𝑁
Miss ia the rate of malicious packets that were incorrectly classifies as harmless.
The last one is the False Alarm or False Positive Rate (FPR):
𝐹𝑃𝑅 =
𝐹𝑃
𝐹𝑃+𝑇𝑁
False alarm happens when a normal packet is considered malicious and thus the ids alarms the system, needlessly.
Where TP stands for True Positives, TN for True Negatives, FP for false Positives and FN for False Negatives.
21
4.3 Artificial Neural Network Models
The key difference between the two approaches used, is the number of the classes of the output. The first was one Multi-Class Classifier and the second was a hierarchy of four binary ANNs. In the following paragraphs we will describe the structure and functionality of both models in detail.
4.3.1 Multi-Class Classifier
The Multi-Class Classifier consists of 4 layers, the input layer, two hidden layers and the output layer. The main idea was simple; for starters, the ANN is trained with the labeled data of the AWID-CLS-R-Trn set and then we use the AWID-CLS-R-Tst set to make predictions.
The first parameter that required careful consideration was the input dimension. Each index in the dataset has 155 attributes. As already mentioned in the Section 3.3, using such a large number of features as input, makes the ANN incapable of creating efficient recognition patterns. Therefore, it was necessary to narrow down the input. Kolias et al.(2016) also note the importance of the feature reduction in their paper. More specifically they mention that “only 20 attributes are immediately related to the attacks contained in the training set”, and they provide a table containing these attributes (Table 4.1).
22
Table 4.1: Input set as suggested by Kolias et al. (Retrieved from: Kollias et al., 2016) Following the guidelines given in the paper we created an ANN that has 20 attributes as input, followed by two hidden layers with 16 and 10 neurons respectively, and lastly an output of 4 classes. The classes of the output, as described previously are Flooding, Injection, Impersonation and Normal. In order to decide the architecture of the ANN we used, we experimented with different numbers of layers and neurons. The common place between all the different models we created, was a descending number of neurons as the number of the hidden layer increased. The main idea, was to gradually form sets that have more things in common, and so, each packet can be part of larger groups to finally meet the requirements for the class it belongs to. Beginning from 20 neurons, which was the input layer, we end up with 4 neurons representing every output class. The activation function used in hidden layers is the RELU function. Since our model is deep learning one, it would be better to use n activation function which is not computationally expensive. The RELU function involves simpler mathematical operations and as a result is less expensive in comparison with tanh and sigmoid. In the output layer we used the
23
SOFTMAX activation function. SOFTMAX gives the opportunity to use the output values as predicted probabilities, because they are in the range of 0 and 1.
Another problem that we had to solve, is that the dataset contains mixed types of data. Beyond integers and floats, there are also hexadecimal numbers and strings. Moreover in case of a missing value the field is filled with a “?”. We cannot process data of many types in neural networks. To overcome this, we encoded the input to integers using the LabelEncoder class by Scikit-learn. For the “LABELS” attribute, we additionally converted the vector of integers to an one-hot encoding using the Keras function
to_categorical(). This way, for each index there is a binary matrix that has as many columns as the number of the output classes (here four). The column that corresponds to the true label of the index has a value equal to 1 and the rest are equal to 0.
Reducing and encoding the features is not sufficient in terms of data preparation. Apart from having a smaller input dimension, it is also important to handle the value range of its attributes. Therefore, Data Normalization is another important step. Data normalization refers to process of modifying the value range of an attribute to restrain it to narrower limits. In this case we used the MinMaxScaler class, once again by Scikit-learn, which transforms features by scaling each feature to a given range. This estimator scales and translates each feature individually, such that it is in the given range on the training set, i.e. between zero and one.
Taking a closer look to the training set, it is obvious that there is a great imbalance between the instances of each class. There are 1,633,190 normal packets, 65,379 Injection packets, 48,484 Flooding packets and 48,522 Impersonation packets. Leaving this proportion as is, would probably lead to overfitting as far as normal packets are concerned and underfitting for the rest of the classes. We reduced the number of the normal packets to 37,615. The new training dataset, consists of 200,000 indexes and it is way more balanced.
24
After training and testing the model the results were not that satisfactory. Table 4.2 is the confusion matrix of the results:
Actual/Predicted Flooding Impersonati on
Injection Normal SUM
Flooding 5269 333 0 2495 8097
Impersonation 586 884 0 18609 20079
Injection 0 17 14308 2357 16682
Normal 1923 18312 59 510491 530875
Table 4.2: Confusion Matrix - Multi-Class Classifier (Kolias et al. input)
The Recall Rate of each class, namely Flooding, Impersonation, Injection and Normal, is 65%, 4%, 86% and 96%, respectively. The problems, needing attention, are two. The first one is the False Alarm Rates. False Alarms of an ideal IDS should approach 0%, so there is still room for improvement. However, the most important problem is that for the misclassified packets that are initially labeled as malicious, the IDS classifies them -in the majority- as normals. So the Miss rate increases, making the system very vulnerable.
Actual/Predicted Correctly As another attack As normal
Flooding 5269 333 2495
Impersonation 884 584 18609
Injection 14308 17 2357
SUM 20461 934 23461
25
In order to improve the results we used a different set of features, as suggested by Aminanto et al. (2017) and the followed the same procedure (Table 4.4).
Table 4.4: Input set as suggested by Aminanto et al.
The new confusion matrix and the distribution of misclassified attacks are presented in Tables 4.5 and 4.6, respectively.
26
Actual/Predicted Flooding Impersonati on
Injection Normal SUM
Flooding 4920 0 0 3177 8096
Impersonation 3 14971 0 5285 20079
Injection 0 1 16667 14 16682
Normal 2244 28849 20845 478847 530875
Table 4.5: Confusion Matrix - Multi-Class Classifier (Aminanto et al. input)
Actual/Predicted Correctly As another attack As normal
Flooding 4920 0 3177
Impersonation 14971 3 5285
Injection 16667 1 14
SUM 36558 4 8476
Table 4.6: Actually/Predicted comparison - Multi-Class Classifier (Aminanto et al. input) Using this set of features as an input brought better recall rates to the total of the attack classes and also, a reduction the miss rate. However, the false alarm rate increased from 4% to nearly 10%.
4.3.2 Multiple Binary Classifiers
The main idea of the second approach is using multiple binary classifiers, each of them trained for a different class. The first one is trained to distinguish the normal packets from the rest(attacks). To do so, it was necessary to change the labels, which characterized a
27
type of an attack execution method, to the most generic label “attack”. The next level of classification is executed by three other binary ANNs, each trained to recognize a different type of execution method, namely Flooding Injection and Impersonation. In order to train the different ANNs, we used two different training sets. Firstly, we modified the dataframe, so that it contained only packets of the attack method it was interested to, as well as normal packets. Then we created a set including only the attack types. The main idea of the first approach was to feed the ANN with the characteristics of only one attack, in order to be specialized. The second approach follows the classic methodology of feeding an ANN, namely the packets that it is going to deal with. Since the first-level ANN cuts off the normal packets, the input of the second-level ANNs will mainly be the 3 type of the attacks. The labels are once more modified to meet the requirements of the binary ANNs. In short, when a packet is classified as an attack by the first classifier, it is then tested by the second-level ANNs to identify the method of the execution it belongs to.
Just as like the previous model, we used the two different set of features as input. The first set of inputs (as suggested by Kolias et al. (2016)) brought up the following confusion matrix on the first level of classification (attack/normal).
Actual/Predicted Attacks Normal SUM
Attacks 1317 43541 44858
Normal 547 530238 530785
Table 4.7: Confusion Matrix (Attack/Normal) - Multi Binary Classifiers (Kolias et al. input)
The false alarm has been reduced to a percentage below 1%, precisely to 0.1% and the recall of normal is nearly 100%. On the other hand, the recall rate of the attacks has
28
dropped to 2.9%. It is obvious, that there is no point for further classification. The IDS is neither efficient nor functional.
Last but no least, the same structure has been tested with the different set of features as input. The confusion matrix of the first level ANN is presented below
Actual/Predicted Attacks Normal SUM
Attacks 44108 750 44858
Normal 1801 53341 55142
Table 4.8: Confusion Matrix (Attack/Normal) - Multi Binary Classifiers (Aminanto et al. input)
The recall of normal is 97% while the attack recall is 98%. The improvement, comparing the model to the previous structures, is more than obvious. Every packet that is now considered an attack is now checked by the next levels classifiers, which are responsible for each of the attack methods.
Next the packets are checked for the Injection method
Actual/Predicted Injection Not Injection SUM
Injection 16668 0 16668
Not Injection 19077 9439 28516
Table 4.9: Confusion Matrix (Injection/Not Injection) - Multi Binary Classifiers (Aminanto et al. input)-Normal/Injection Training Dataset
29
Actual/Predicted Injection Not Injection SUM
Injection 0 16668 16668
Not Injection 9946 23477 33423
Table 4.10: Confusion Matrix (Injection/Not Injection) - Multi Binary Classifiers (Aminanto et al. input)-All Attacks Training Dataset
Table 4.9 shows the results of the Normal/Injection training set. There is a recall rate of 100 % concerning the attacks, although the false alarm is nearly 67% which is not desirable. The Table 4.10 shows the confusion matrix after using the training set including all types of attack. Recall Rate is 0%. In other words the ANN is totally unfunctional.
Concerning the Impersonation Classification, Table 4.11 shows the confusion matrix of the ANN trained with the Normal/Injection Dataset.
Actual/Predicted Impersonation Not Impersonation SUM
Impersonation 14603 5443 20046
Not Impersonation 3 19884 19887
Table 4.11: Confusion Matrix (Impersonation/Not Impersonation) - Multi Binary Classifiers (Aminanto et al. input) - Normal/Impersonation Training Dataset
The recall of normal are nearly 100% for the normal, which at the same time means almost 0% false alarm rate. The Impersonation recall is 73%, keeping the miss rate to a 27%.
30
Actual/Predicted Impersonation Not Impersonation SUM
Impersonation 15 20046 20046
Not Impersonation 6603 22544 19887
Table 4.12: Confusion Matrix (Impersonation/Not Impersonation) - Multi Binary Classifiers (Aminanto et al. input) - All Attacks Training Dataset
Just like the Injection Classification, Impersonation Recall Rate is approximately 0%. Flooding Classification had completely different outcomes, in comparison with the previous two attack methods. Table 4.13 shows the confusion matrix after using the Normal/Flooding training set. Although there is 0% false alarm, the Flooding recall rate is 0%.
Actual/Predicted Flooding Not Flooding SUM
Flooding 0 6872 6872
Not Flooding 0 42565 42565
Table 4.13: Confusion Matrix (Flooding/Not Flooding) - Multi Binary Classifiers (Aminanto et al. input)-Normal/Flooding Training Dataset
The results after training the ANN with the second dataset (Table 4.14) are very encouraging. We have a Flooding recall rate equaling 100% and 5% false alarm.
Actual/Predicted Flooding Not Flooding SUM
Flooding 5766 0 5766
31
Table 4.14: Confusion Matrix (Flooding/Not Flooding) - Multi Binary Classifiers (Aminanto et al. input)-All Attacks Training Dataset
Flooding attacks are orchestrated by a bunch of packets flooding the network. There is no need for these packets to have significant differences from normal traffic. Considering this, training a network to have distinguish normal packets from flooding ones, when there is no short temp memory to recognise a stream of packets, is not very effective.
After completing the classification from all binary ANNs we note a false alarm of 3 % and a miss rate of 13.8%.
4.4 Results
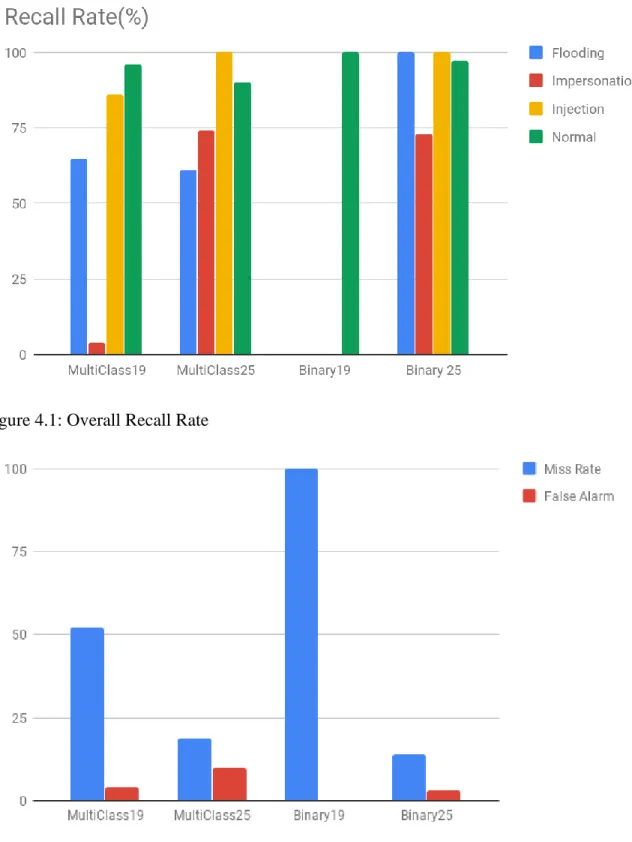
Binary classifiers, were more efficient in detecting attacks. The most efficient models, by looking the overall performance, are certainly the ones, using the input as suggested by Aminanto et al. (2017). The biggest flaw of the multiple binary classifiers is the more time needed due to the two-phase detection. The most suitable training set, for the second-level classification on the binary classifier, depends on the attack. Figures 4.1 and 4.2 show the performance of the different architectures for comparison. The number after the Classifier states the number of attributes used. 19 as suggested by Kolias et al. (2016), 25 as suggested by Aminanto et al.(2017).
As far as the binary classifiers are concerned, we used the results with better recall rate (Normal/One_Attack training set for Impersonation and Injection, All Attack types training set for Flooding).
32
Figure 4.1: Overall Recall Rate
33
5. Conclusions and Future Work
We experimented with 2 different sets of attributes, used as input, and 2 different ANN architectures. It is clear that the set suggested by Aminanto et al.(2017) is a better choice than the input set suggested by Kolias et al.(2016). This is even more obvious, in the Binary Classifier, where the fist level, that tells if a packet is normal or not, fails with a very notable recall rate 2.9%. Furthermore, we compared two different training sets during the second-level attack of the Multiple Binary Classifier, and we found the most suitable for each attack. The most rewarding results were those of the Flooding attack, in the Binary Classification. We achieved a detection rate of 100% and a 5% false alarm. The total miss rate which equals to 13.8% is also very encouraging.
In the near future, we plan to create a LSTM ANN to test if and how a short temp memory will impact the results. Moreover, we could redesign the second-level binary ANNs in order to run simultaneously. This way, we will save time and make the model even more efficient.
34
References
Aminanto, M. E., & Kim, K. C. (2018). Improving Detection of Wi-Fi Impersonation by Fully Unsupervised Deep Learning. Information Security Applications, 212-223. doi:10.1007/978-3-319-93563-8_18
Aminanto, M. E., Tanuwidjaja, H. C., Yoo, P. D., & Kim, K. (2017). Wi-Fi intrusion detection using weighted-feature selection for neural networks classifier. 2017 International Workshop on Big Data and Information Security (IWBIS). doi:10.1109/iwbis.2017.8275109
Barbeau, M., Hall, J., & Kranakis, E. (2006). Detecting Impersonation Attacks in Future Wireless and Mobile Networks. Secure Mobile Ad-hoc Networks and Sensors, 80-95. doi:10.1007/11801412_8
Bot Traffic Report 2016. (2017, January 26). Retrieved from
https://www.incapsula.com/blog/bot-traffic-report-2016.html
Cisco Visual Networking Index: Global Mobile Data Traffic Forecast Update, 2016?2021 White Paper. (n.d.). Retrieved from
https://www.cisco.com/c/en/us/solutions/collateral/service-provider/visual-networking-index-vni/mobile-white-paper-c11-520862.html
Da, S. I., Hernane, S. D., Andrade, F. R., Liboni, L. H., & Dos, R. A. (2017). Artificial Neural Networks: A Practical Course. Cham: Springer.
Datasets | MIT Lincoln Laboratory. (n.d.). Retrieved from https://www.ll.mit.edu/r-d/datasets
35
J. (2000, August). Modelling Ranunculus presence in the Rivers test and Itchen using artificial neural networks. In Proceedings of international conference on geocomputation, Greenwich, UK.
Denning, D. (1987). An Intrusion-Detection Model. IEEE Transactions on Software Engineering, SE-13(2), 222-232. doi:10.1109/tse.1987.232894
Dias, L. P., Cerqueira, J. J., Assis, K. D., & Almeida, R. C. (2017). Using artificial neural network in intrusion detection systems to computer networks. 2017 9th Computer Science and Electronic Engineering (CEEC).
doi:10.1109/ceec.2017.8101615
Giovinazzo, W. A. (2017, May 11). Overfitting / Underfitting – How Well Does Your Model Fit? Retrieved from
https://meditationsonbianddatascience.com/2017/05/11/overfitting-underfitting-how-well-does-your-model-fit/
Haykin, S. S. (1999). Neural networks : a comprehensive foundation.
HIDS (Host-Based Intrusion Detection System) - Bauman National Library. (n.d.). Retrieved from
https://en.bmstu.wiki/HIDS_(Host-Based_Intrusion_Detection_System)
Hunter, J. D. (2007). Matplotlib: A 2D Graphics Environment. Computing in Science & Engineering, 9(3), 90-95. doi:10.1109/mcse.2007.55
JEFTOVIC, M. A. (2018). MANAGING MISSION - CRITICAL DOMAINS AND DNS: Demystifying nameservers, dns, and domain names. S.l.: PACKT
PUBLISHING LIMITED.
36
http://kdd.ics.uci.edu/databases/kddcup99/kddcup99.html
Ketkar, N. (2017). Introduction to Theano. Deep Learning with Python, 35-61. doi:10.1007/978-1-4842-2766-4_4Keras | TensorFlow. (n.d.). Retrieved from
https://www.tensorflow.org/guide/keras
Kolias, C., Kambourakis, G., Stavrou, A., & Gritzalis, S. (2016). Intrusion Detection in 802.11 Networks: Empirical Evaluation of Threats and a Public Dataset.
IEEE Communications Surveys & Tutorials, 18(1), 184-208. doi:10.1109/comst.2015.2402161
Lakshmi, I. B., Lakshmi, B. S., & Karthikeyan, R. (2014). Detection and prevention of Impersonation attack in wireless networks. International journal of advanced research in computer science & technology, 2(1), 267-270.
Malhotra, A. (2018, February 1). Tutorial on Feedforward Neural Network ? Part 1 ? Akanksha Malhotra ? Medium. Retrieved from
https://medium.com/@akankshamalhotra24/tutorial-on-feedforward-neural-network-part-1-659eeff574c3
Model Fit: Underfitting vs. Overfitting - Amazon Machine Learning. (n.d.). Retrieved from https://docs.aws.amazon.com/machine-learning/latest/dg/model-fit-underfitting-vs-overfitting.html
NumPy — NumPy. (n.d.). Retrieved from http://www.numpy.org/
OWASP Top Ten 2017 Project - OWASP. (n.d.). Retrieved from
https://www.owasp.org/index.php/Category:OWASP_Top_Ten_2017_Project
Protić, D. (2018). Review of KDD Cup '99, NSL-KDD and Kyoto 2006+ datasets.
37
Regan, R., & Manickam, J. M. (2017). A Survey on Impersonation Attack in Wireless Networks. International Journal of Security and Its Applications, 11(5), 39-48. doi:10.14257/ijsia.2017.11.5.04
Samuel, A. L. (1959). Some Studies in Machine Learning Using the Game of Checkers. IBM Journal of Research and Development, 3(3), 210-229. doi:10.1147/rd.33.0210
Scientific Computing Tools for Python — SciPy.org. (n.d.). Retrieved from https://scipy.org/about.html
Seide, F., & Agarwal, A. (2016, August). CNTK: Microsoft's open-source deep- learning toolkit. In Proceedings of the 22nd ACM SIGKDD International Conference on Knowledge Discovery and Data Mining (pp. 2135-2135). ACM.
Shah, B., & H Trivedi, B. (2012). Artificial Neural Network based Intrusion Detection System: A Survey. International Journal of Computer Applications, 39(6), 13-18. doi:10.5120/4823-7074
Sommer, R., & Paxson, V. (2010). Outside the Closed World: On Using Machine Learning for Network Intrusion Detection. 2010 IEEE Symposium on Security and Privacy. doi:10.1109/sp.2010.25
TensorFlow. (n.d.). Retrieved from https://www.tensorflow.org/
Thanthrige, U. S., Samarabandu, J., & Wang, X. (2016). Machine learning techniques for intrusion detection on public dataset. 2016 IEEE Canadian Conference on Electrical and Computer Engineering (CCECE).
38
Thing, V. L. (2017). IEEE 802.11 Network Anomaly Detection and Attack Classification: A Deep Learning Approach. 2017 IEEE Wireless Communications and Networking Conference (WCNC).
doi:10.1109/wcnc.2017.7925567
Understanding Denial-of-Service Attacks | US-CERT. (n.d.). Retrieved from https://www.us-cert.gov/ncas/tips/ST04-015
Usha, M., & Kavitha, P. (2016). Anomaly based intrusion detection for 802.11 networks with optimal features using SVM classifier. Wireless Networks,
23(8), 2431-2446. doi:10.1007/s11276-016-1300-5
Van der Aalst, W. M., Rubin, V., Verbeek, H. M., Van Dongen, B. F., Kindler, E., & Günther, C. W. (2008). Process mining: a two-step approach to balance between underfitting and overfitting. Software & Systems Modeling, 9(1), 87-111. doi:10.1007/s10270-008-0106-z
WhiteHat Security 9th Website Security Statistics Report. (2010, May 6). Retrieved from https://www.slideshare.net/jeremiahgrossman/whitehat-security-9th-website-security-statistics-report
Zeifman, I. (2017). Bot traffic report 2016. Retrieved from