A loadable task execution recorder for Linux
Mikael ˚
Asberg, Johan Kraft and Thomas Nolte
MRTC/M¨alardalen University
P.O. Box 883, SE-721 23,
V¨aster˚as, Sweden
{
mikael.asberg,johan.kraft,thomas.nolte
}
@mdh.se
Shinpei Kato
The University of Tokyo
7-3-1 Hongo, Bunkyo-ku,
Tokyo 113-8656, Japan
[email protected]
Abstract—This paper presents a task recorder for Linux-basedoperating systems, in the form of a loadable kernel module. To the best of our knowledge, this is the first Linux task recorder which does not require kernel patches (kernel modifications). This complies with the requirements in the area of embedded systems where reliability and stability are important properties, hence, proven versions of Linux are therefore preferred.
The implementation is based on the loadable real-time sched-uler framework RESCH (REal-time SCHedsched-uler). RESCH uses only exported Linux kernel primitives as a means for controlling scheduling. The disadvantage with this solution is that it can only detect scheduling events of the tasks being scheduled by RESCH itself, since it can not directly manipulate nor have knowledge of the tasks in the Linux task ready queue. In order to verify the correctness of the task recording, a comparison has been made with a second recorder, which uses a kernel patch. Our tests indicate that the new, RESCH-based, recorder gives identical results1.
I. INTRODUCTION
The overall aim of our research is the development of hierarchical scheduling. Hierarchical scheduling has several advantages, stretching from enabling design time parallel de-velopment of system parts, simplifying integration, to runtime temporal partitioning and safe execution of tasks. Our previous work includes practical issues of this kind of scheduling [1] as well as the theoretical advantage [2] of this scheduling technique, in real-time systems. However, the hierarchical scheduling technique is rarely an integrated part of an erating system (except for, e.g., ARINC653 compliant op-erating systems that are commonly found in avionics appli-cations). Indeed, there is a need to develop/implement new scheduling algorithms, such as hierarchical scheduling, in the area of real-time systems. Looking from a practical point of view, it is an advantage if hierarchical scheduling (and other scheduling techniques) can be implemented easily and efficiently without modifying the kernel. The latter makes it easier for both developers and users since there is no need to maintain/apply kernel patches (kernel modifications) every time the kernel is replaced/updated. Moreover, keeping the scheduler isolated in a kernel module, without modifying the kernel, simplifies debugging and potential certification of its correctness (component-based development advantages). We see that RESCH [3] is useful because it has the advantages mentioned.
1The work in this paper is supported by the Swedish Foundation for
Strategic Research (SSF), via the research programme PROGRESS.
RESCH is a scheduling framework intended to make life easier for scheduler developers in Linux based RT/GP OSs (Real-Time/General Purpose Operating System). A key moti-vation for using RESCH is that it does not need any kernel modifications, secondly, it makes scheduler development eas-ier because it abstracts the complexity of scheduling aspects and presents a simple and easy scheduling interface to the user. However, while development of schedulers are simplified with this framework, it lacks support for debugging the schedulers. Our vision is to make the RESCH framework a complete scheduler development base. We want it to have all necessary tools for creating schedulers, and everything should be totally independent of kernel patches. This also has the advantage that it is easy to develop RESCH for other platforms, hence, making scheduler development platform independent. In order to comply with our vision, we want the integrated debugger in RESCH to be free of kernel patches as well.
With this paper, we present a task execution recorder, which is capable of debugging schedulers. The task recorder (we will refer to it as a recorder for the rest of the paper), is able to record the following scheduling events during run-time:
1) The time instance when a task is released (even though it might not start to execute).
2) The time instance when a task starts to execute. 3) When there is a task switch, the recorder distinguishes
between preemption and non-preemption.
4) The time instance when a task finishes its execution. The output from the recorder is a simple text-file containing task switch events. We have converted this file format to fit the trace visualization tool Tracealyzer2.
A. System model
We assume fixed priority preemptive scheduling of pe-riodic tasks, according to the pepe-riodic task model [4]. A task i is presumed to have the following parameters,
hTi,WCETi, Di, prii, where the period Ti represents the
frequency in which the task is released for execution,WCETi
is the worst case execution time of the task, the relative deadlineDi(within the period) is when the task must complete
its execution (RESCH monitors this) and pri is the task
priority (higher value represents higher priority). Also, all tasks are assumed to execute on the same core, i.e., single-core.
2For more information about Tracealyzer, see
B. RESCH
As mentioned previously, RESCH is a patch-free scheduling framework for Linux. It supports periodic tasks which can be scheduled in a fixed-priority preemptive manner. RESCH runs as a kernel module (in kernel space), giving both an interface to users in user space (e.g. a task specific interface likert_wait_for_period()) as well as in kernel space. The kernel space API (Application Programming Interface) has the interface shown below:
1) task run plugin( )
2) task exit plugin( )
3) job release plugin( )
4) job complete plugin( )
These functions can be implemented by aRESCH plugin
(Figure 1), i.e., a kernel module that has access to the RESCH kernel API. These functions are called in RESCH core at certain events. Functions 1) and 2) are executed every time a task registers/unregisters to RESCH. With register we mean that the task does a RESCH API call, transforming it to a
RESCH task, which creates a RESCH TCB (Task Control
Block) and puts it in the RESCH ready-queue etc. A RESCH TCB has, among other real-time specific data, a reference to its corresponding Linux task TCB (task struct). The primitives 3) and 4) are called whenever a RESCH task is released for execution or when it has finished its execution. The plugins get these scheduling notifications and can thereby affect scheduling, trace tasks etc.
RESCH
plugin RESCHplugin
…
RESCHpluginfair task
Linux kernel RESCH core
real-time task RESCH task
Fig. 1. RESCH framework
In Linux, since kernel version 2.6.23 (October of 2007), tasks can be either a fair task or a real-time task. The latter group has higher priority (0-99 where 0 is highest) than fair tasks (100-140). A task that registers to RESCH is automatically transformed to a real-time task. RESCH is responsible for releasing tasks, and tasks registered to RESCH must notify when they have finished their execution in the current period. In this way, RESCH can control the scheduling. RESCH uses an absolute-time clock, i.e., it does not wrap around. Also, release times are stored as absolute values, so release patterns are exact.
The cost of having a patch-free solution is that RESCH can only see scheduling events related to its registered tasks, i.e., higher priority real-time tasks, which are not registered in RESCH, can thereby interfere with RESCH tasks without the
RESCH core detecting it. A simple solution to this problem is to schedule all real-time tasks with RESCH.
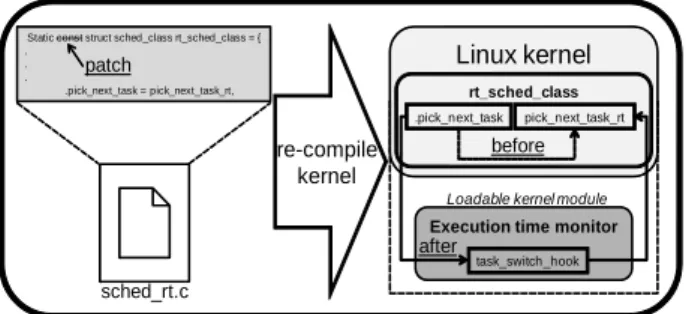
C. Task-switch hook patch
Our previous work [5] includes an implementation of a
task switch hook (Figure 3), residing in a kernel module,
which is called by the Linux scheduler at every scheduler tick. This solution requires modification of two code-lines in two separate kernel source files (sched rt.c and sched f air.c). The modification of file sched rt.c is illustrated in Figure 3 (a similar change is done in sched f air.c). Linux has (since kernel version 2.6.23) two scheduling classes, namely thef air and thereal-timescheduling classes. When a new task should be released, the Linux scheduler iterates through its scheduling classes (first the real-timeclass, secondly thef airclass) in order to find the next task to release. This is shown in Figure 2.
1: class = sched class highest; 2:for(; ; ){
3: p = class->pick next task(rq); 4: if(p)
5: returnp; 6: class = class->next; 7:}
Fig. 2. Kernel function:pick next task
The modification (Figure 3) makes it possible to re-direct a scheduling class’ function pick next taskto a user defined function (i.e., our function task switch hook), in a kernel module. This function (hook) can be inserted and removed during runtime.
Static const struct sched_class rt_sched_class = { . . . .pick_next_task = pick_next_task_rt, sched_rt.c re-compile kernel Linux kernel rt_sched_class .pick_next_task
Execution time monitor task_switch_hook after
Loadable kernel module
pick_next_task_rt patch
before
Fig. 3. Hook patch
In this paper our overall goal is to implement a patch-free task execution recorder in Linux for debugging purposes, i.e., which can be useful for a scheduler or application developer. Our solution enables debugging on any Linux-based RT/GP OS, as long as the Linux interface is not changed, since RESCH and the recorder are both loadable kernel modules that calls the Linux kernel functions. Hence, our recorder is more general than patched solutions since it is difficult to port these between different platforms.
The main contributions of this paper are:
1) We have implemented a (patch-free) task recorder with the use of RESCH, which enables debugging at task level, in Linux based RT/GP OS.
2) We have evaluated our solution by implementing yet an-other (patched) recorder, using the technique presented in [5], and compared the results from the two recorders. The outline of this paper is as follows: in Section II we describe the two recorder implementations. Section III compares the trace result from the two recorders. Section IV presents related work, and finally, Section V concludes.
II. IMPLEMENTATION
The following section presents a recorder implementation based on RESCH, and a second implementation based on a hook patch [5].
A. RESCH plugin recorder
The recorder is implemented as a plugin (see Figure 1) in RESCH. Although, it could also become an integrated part of RESCH core at a later stage.
It is important to note that in order for the recording to be correct with this plugin, no higher priority real-time tasks (that are not registered by RESCH) are allowed to run. Also, the current recorder implementation does not support multi-core, hence,load balancingmust be disabled (a function in Linux that migrates tasks to other CPUs based on load). Support for multi-core is possible, but without load balancing. The reason is that RESCH cannot detect task migrations made by the Linux scheduler.
Figure 4 shows the necessary data needed to store a scheduling event (i.e. task switch). The member rid is the index to the RESCH task TCB. We use this identifier because is has a smaller range than the Linux task id (PID), and thereby require less memory. The timestamp is stored in micro-seconds, i.e., our recorder can record approximately 35 minutes (assuming we have 32 bits) since we use one bit for storing the preemption flag (informing whether there has been a preemption or not).
1:structtask switch event{
2: charnext rid;// rid(0−64)is the RESCH task id.
3: charprev rid;
4: unsigned inttimestamp;// Bit nr31hold preempt. f lag.
5:};
Fig. 4. Event structure
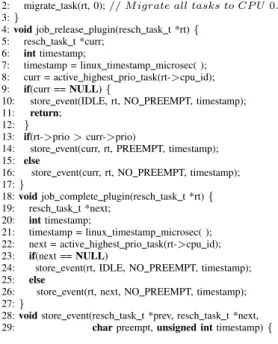
task_run_plugin, line (1) Figure 5, is called every time a task registers to RESCH. Since the current version of our recorder does not support multi-core, we migrate all tasks to one CPU (CPU #0 in this case).
Figure 5 show parts of the recorder implementation (in simplified form) in RESCH. Line (4) and (18) (Figure 5) are called by the RESCH core at every task release and completion. In this way, not only can we record task switches, but also detect when a task is released and also show this information graphically in the Tracealyzer.
1:voidtask run plugin(resch task t *rt){
2: migrate task(rt, 0);// M igrate all tasks to CP U0.
3:}
4:voidjob release plugin(resch task t *rt){ 5: resch task t *curr;
6: inttimestamp;
7: timestamp = linux timestamp microsec( ); 8: curr = active highest prio task(rt->cpu id); 9: if(curr ==NULL){
10: store event(IDLE, rt, NO PREEMPT, timestamp); 11: return;
12: }
13: if(rt->prio>curr->prio)
14: store event(curr, rt, PREEMPT, timestamp); 15: else
16: store event(curr, rt, NO PREEMPT, timestamp); 17:}
18:voidjob complete plugin(resch task t *rt){ 19: resch task t *next;
20: inttimestamp;
21: timestamp = linux timestamp microsec( ); 22: next = active highest prio task(rt->cpu id); 23: if(next ==NULL)
24: store event(rt, IDLE, NO PREEMPT, timestamp); 25: else
26: store event(rt, next, NO PREEMPT, timestamp); 27:}
28:voidstore event(resch task t *prev, resch task t *next,
29: charpreempt,unsigned inttimestamp){
Fig. 5. Recorder implementation
B. Hook patch recorder
As mentioned previously, our patched recorder is based on a task-switch hook implementation [5]. This implementation consists of two hooks. One hook is executed when Linux calls the scheduling classreal-time, the other one whenf airclass is called. The two hooks are never called in the same scheduler tick, only one of them (depending on if there are any real-time tasks eligible to execute). We use the similar data-structures in this implementation as the one presented in section II-A. A difference between the two approaches is that the hook patch implementation only detects a switch between tasks, i.e., it cannot know when a task is released (for which the RESCH implementation can). This will differentiate the trace results a bit.
III. EVALUATION
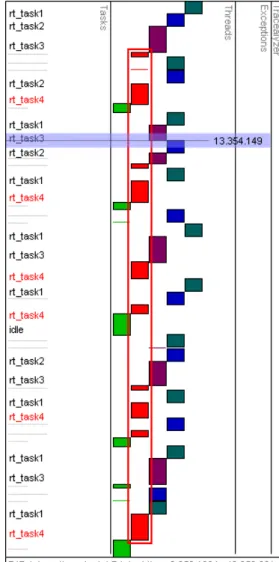
We have tested our RESCH plugin recorder by running it in parallel with the hook patch implementation, i.e., the two recorders recorded the same trace at the same time. The recorder we compare with [5] was chosen because of its simplicity (easy to install, load/unload, modify source code etc.), small amount of source code and the fact that it records correctly since its hook is placed at the point where the Linux scheduler does the task context switches. We ran the task set in Table I on an Intel Pentium Dual-Core (E5300 2,6GHz) platform, equipped with a Linux kernel version 2.6.31.9, running withload balancingdisabled. The recorded tasks ran on the same core, i.e., all tasks were migrated to CPU #0 at initialization phase. The trace from both implementations are visualized in Figure 9 and 10 with the Tracealyzer application. The tasks were scheduled by the RESCH core scheduler (i.e.,
we used no plugin scheduler) according to the parameters in Table I. Name T WCET D pr rt task1 4 1 4 4 rt task2 5 1 5 3 rt task3 8 2 8 2 rt task4 9 2 9 1 TABLE I
TASK SET USED IN THE EXPERIMENTS
Note that the absolute time-line in Figure 9 is 1 second behind Figure 10, but the relative time should match eachother since they were executed at the same time. The task ID:s in Figure 6 are the new modified PIDs (which are needed in order to reference RESCH TCBs from native Linux TCBs) and therefore different than the ones in Figure 7, which are the native PIDs.
If the user marks a task fragment, Tracealyzer will display a red box (e.g. taskrt task4in Figure 9 and 10) around the task instance, if it can detect the instance (which is not the case in Figure 10). In Figure 9 though, the Tracealyzer can separate between task instances, since the plugin recorder records task releases, e.g. line 20-21 in Figure 7, which represents the fourth fragment ofrt task4 in Figure 9.
Figure 6 and 7 shows the data recorded by both recorders. The data is represented in the format: prev: <id1> <name1>
next:<id2> <name2> <t-stamp> <preempt>, where id1 and name1
represents the task id and name of the task that is finishing (possibly preempted), id2 and name2 represents the task id and name of the task that is starting to execute, t-stamp is the timestamp in absolute time when this event has occurred and the flag preempt is set to 1 or 0 depending on if there is a preemption (1=preemption). The recorded data (Figure 6 and 7) corresponds to the graphical representation (Figure 9 and 10) from the start of the graphs (4.350.156 respectively 3.350.160) to the marked time-lines (14.354.148 respectively 13.354.149). The time in the graphs are represented in the format second.milli-second.micro-second. The difference in time (1 second) is due to that both recorders record absolute timestamps (and the tool visualizes in absolute time) and one recorder was started approximately 1 second before the other one.
1: prev: 0 idle next: 32769 rt task1 3350160 1 2: prev: 32769 rt task1 next: 32770 rt task2 4266631 0 3: prev: 32770 rt task2 next: 32771 rt task3 5183029 0 4: prev: 32771 rt task3 next: 32772 rt task4 7038580 0 5: prev: 32772 rt task4 next: 32769 rt task1 7350149 1 6: prev: 32769 rt task1 next: 32772 rt task4 8266565 0 7: prev: 32772 rt task4 next: 32770 rt task2 8354148 1 8: prev: 32770 rt task2 next: 32772 rt task4 9270908 0 9: prev: 32772 rt task4 next: 0 idle 10726636 0 10: prev: 0 idle next: 32769 rt task1 11350157 1 11: prev: 32769 rt task1 next: 32771 rt task3 12266246 0 12: prev: 32771 rt task3 next: 32770 rt task2 13354149 1
Fig. 6. Recorded data (Hook patch)
1: prev: 0 idle next: 3900 rt task1 4350156 1 2: prev: 3900 rt task1 next: 3901 rt task2 4354149 1 3: prev: 3901 rt task2 next: 3900 rt task1 4354159 0 4: prev: 3900 rt task1 next: 3902 rt task3 4354150 1 5: prev: 3902 rt task3 next: 3900 rt task1 4354160 0 6: prev: 3900 rt task1 next: 3903 rt task4 4354151 1 7: prev: 3903 rt task4 next: 3900 rt task1 4354161 0 8: prev: 3900 rt task1 next: 3901 rt task2 5266627 0 9: prev: 3901 rt task2 next: 3902 rt task3 6183025 0 10: prev: 3902 rt task3 next: 3903 rt task4 8038576 0 11: prev: 3903 rt task4 next: 3900 rt task1 8350148 1 12: prev: 3900 rt task1 next: 3903 rt task4 9266561 0 13: prev: 3903 rt task4 next: 3901 rt task2 9354147 1 14: prev: 3901 rt task2 next: 3903 rt task4 10270905 0 15: prev: 3903 rt task4 next: 0 idle 11726633 0 16: prev: 0 idle next: 3900 rt task1 12350153 1 17: prev: 3900 rt task1 next: 3902 rt task3 12354149 1 18: prev: 3902 rt task3 next: 3900 rt task1 12354159 0 19: prev: 3900 rt task1 next: 3902 rt task3 13266243 0 20: prev: 3902 rt task3 next: 3903 rt task4 13354147 1 21: prev: 3903 rt task4 next: 3902 rt task3 13354157 0 22: prev: 3902 rt task3 next: 3901 rt task2 14354148 1
Fig. 7. Recorded data (RESCH plugin)
The difference between the two traces is that the RESCH plugin recorder records task releases by recording a fake pre-emption and running the released task for 10 micro-seconds, e.g., lines 1-7 in Figure 7, though this is not the case (its just for visualization). Although, this enables the Tracealyzer to calculate and show the response time of a task. Other than that the preemption depth differs in the two traces (due to that the two recorders record preemption differently), the traces are almost identical (the recorded time points may differ a few micro-seconds at most). Figure 8 shows the RESCH plugin trace, visualized with the tool Grasp [6]. The tasks vertical positions are ordered by priority with the lowest priority at the top (including the idle task) and the time is scaled down 100000 times. The figure clearly shows the task frequency.
IV. RELATED WORK
The idea of our solution is based on the replay debugging approach [7], which records system events online and replays them offline. In later work [8], the replay debugging has been extended to be compiler- and OS-independent. While the replay debugging works with off-the-shelf compilers for application-level debugging, our solution is self-contained software using Tracealyzer [9] for OS-level debugging, and it is primarily focused on real-time scheduler debugging.
The SCHED DEADLINEproject [10], which is in charge of the EDF scheduler implementation for Linux, has used the sched switch tracer provided by the Ftrace toolkit [11] to output the records of context switches. The output logs are then converted to the VCD (Value Change Dump) format so that GtkWavecan visualize the task execution traces. The trace can of course be converted to the Tracealyzer or Grasp [6] format. Given that Ftraceis supported by the Linux community, it is reasonable to use this toolkit to trace task executions for kernel debugging, but it is dedicated to the Linux kernel, so it is not necessarily suitable for real-time scheduler debugging. For instance,sched switchdoes not catch job releases, however,
0 50 100 150 200 250 300 350 400 idle rt_task4 rt_task3 rt_task2 rt_task1
Fig. 8. RESCH plugin trace visualized with Grasp [6]
Fig. 9. Example trace with RESCH plugin
context switches are precisely traced and it can distinguish between task completions and task preemptions. Our solution is more flexible and integrated in that it is available not only for the Linux kernel but also for other OSs, once the RESCH
Fig. 10. Example trace with hook patch
framework is ported.
DTrace [12], SystemTrap [13], LTT [14], and LTTng [15] are advanced tools for OS debugging. They are oriented for tracing entire kernel events, so it is required that the
developers, in a high degree, understand how to use them. Meanwhile, our solution is more simplified by focusing on real-time scheduler debugging, and it is very easy to use in practice.
Real-Time Application Interface for Linux (RTAI) [16] is a collection of loadable kernel modules and a kernel patch which together provides a rich real-time API to the user. It gives the possibility to add/delete hooks for every task-start, task-switch and task-delete. These hooks give the possibility to monitor task execution in a detailed level.
V. CONCLUSION
We have implemented a task execution recorder in a stock Linux kernel, without applying kernel patches, with the use of the loadable real-time scheduler framework RESCH. The recorder is able to record task releases (with or without preemption) and task switches. The recorded data is later converted, offline, to a format suitable for the visualization tool Tracealyzer. In this way, the trace can be visualized graphically. The assumptions made, in order for the tracing to be correct, are that there should not exist any (unregistered RESCH) tasks that have higher priority than the (RESCH) tasks to be recorded, and that load balancing is disabled. Our results indicate that our recorder does a correct trace, by comparing the results with a trace made by a patched recorder. The second (patched) recorder is assumed to trace correct, since it is called by the Linux scheduler at every scheduler tick. The two recorders were executed in parallel, i.e., they recorded the same trace. Hence, an exact comparison is possible since the execution time of the tasks will be the same in both cases, and will therefore not affect the comparsion results. We showed that our recorder got the same trace result as the patched solution (with only a few micro-seconds of difference).
As future work we will continue with evolving the RESCH framework. This includes the development of new scheduler plugins, such as hierarchical scheduling (for both uni- and multi-core), adjust our recorder to fit with multi-core and implement RESCH for other platforms. In this way, plugin schedulers, recorders etc. can be moved to other platforms (supported by RESCH) without modification. We will also explore the possibilities of doing visualizations of the trace during run-time, rather than offline as in this paper.
REFERENCES
[1] M. Behnam, T. Nolte, I. Shin, M. ˚Asberg, and R. J. Bril, “Towards hierarchical scheduling on top of VxWorks,” inProc. of the OSPERT workshop, 2008.
[2] M. Asberg, M. Behnam, F. Nemati, and T. Nolte, “Towards˚ Hierarchical Scheduling in AUTOSAR,” in Proc. of the ETFA conference, 2009. [Online]. Available: http://www.mrtc.mdh.se/index. php?choice=publications&id=1793
[3] S. Kato, R. Rajkumar, and Y. Ishikawa, “A Loadable Real-Time Scheduler Suite for Multicore Platforms,” Technical Report CMU-ECE-TR09-12, 2009. [Online]. Available: http://www.contrib.andrew. cmu.edu/∼shinpei/papers/techrep09.pdf
[4] C. Liu and J. Layland, “Scheduling algorithms for multi-programming in a hard-real-time environment,”ACM, vol. 20, no. 1, pp. 46–61, 1973.
[5] M. ˚Asberg, T. Nolte, C. M. O. Perez, and S. Kato, “Execution Time Monitoring in Linux,” in Proc. of the W.I.P. session in the ETFA conference, 2009. [Online]. Available: http://www.mrtc.mdh.se/index. php?choice=publications&id=1792
[6] M. Holenderski, M. M. H. P. van den Heuvel, R. J. Bril, and J. J. Lukkien, “Grasp: Tracing, Visualizing and Measuring the Behavior of Real-Time Systems,” inInternational Workshop on Analysis Tools and Methodologies for Embedded and Real-time Systems, July 2010. [7] H. Thane and H. Hansson, “Using Deterministic Replay for Debugging
of Distributed Real Time Systems,” inProc. of the ECRTS conference, 2000, pp. 265–272.
[8] H. Thane, D. Sundmark, J. Huselius, and A. Pettersson, “Replay Debugging of Real-Time Systems Using Time Machines,” inProc. of the IPDPS conference, 2003, pp. 288–295.
[9] T. Maragria and B. Steffen, editors, “Leveraging Applications of Formal Methods,”1stInternational Symposium, ISoLA. Springer, pp. 140–141, 2004.
[10] D. Faggioli and F. Checconi, “An EDF scheduling class for the Linux kernel,” inProc. of the Real-Time Linux Workshop, 2009.
[11] T. Bird, “Measuring Function Duration with Ftrace,” in Proc. of the Japan Linux Symposium, 2009.
[12] B. Cantrill, M. Shapiro, and A. Leventhal, “Dynamic Instrumentation of Production Systems,” inProc. of the USENIX conference, 2004, pp. 15–28.
[13] V. Prasad, W. Colhen, F. Eigler, M. Hunt, J. Keniston, and B. Chen, “Locating System Problems Using Dynamic Instrumentation,” inProc. of the Ottawa Linux Symposium, 2005, pp. 49–64.
[14] K. Yaghmour and M. Dagenais, “Measuring and characterizing system behavior using kernel-level event logging,” in Proc. of the USENIX conference, 2000, pp. 13–26.
[15] M. Desnoyers and M. Dagenais, “The LTTng Tracer: A low impact performance and behavior monitor of GNU/Linux,” in Proc. of the Ottawa Linux Symposium, 2006, pp. 209–223.
[16] D. Beal, E. Bianchi, L. Dozio, S. Hughes, P. Mantegazza and S. Papacharalambous, “RTAI: Real Time Application Interface,” Linux Journal, vol. 29, no. 10, 2000.