DEMAND RESPONSE
PILOT PROJECT
Final Report
Prepared for the
Center for Commercialization
of Electric Technologies
816 Congress Avenue, Ste. 1260
Austin, Texas 78701
March 2009
Fowler Energy Company
4520 Spicewood
Springs Road
Austin, TX 78759
Frontier Associates
1515 S. Capital of Texas
Hwy., Ste. 110
Austin, TX 78746
(THIS PAGE INTENTIONALLY LEFT BLANK)
Table of Contents
EXECUTIVE SUMMARY ... 1 PROJECT DESCRIPTION/OVERVIEW ... 4 HOUSTON PILOT ... 6 DALLAS PILOT ... 9 PROJECT ACTIVITIES ... 12 ACHIEVEMENTS IN 2007 ... 12 JANUARY – JULY, 2008 ... 14INSTALLATION AND SYSTEM VERIFICATION ... 15
CURTAILMENT ... 15
DATA COLLECTION AND ANALYSIS ... 16
DATA COLLECTION ... 16
DEMAND RESPONSE DATA ANALYSIS ... 16
DEMAND RESPONSE AND LOAD PROFILES ... 30
EXIT SURVEY OF PROGRAM PARTICIPANTS ... 33
ESTIMATION OF THE MARKET‐LEVEL IMPACTS ON PRICES FROM A COMMERCIAL‐SCALE DEMAND RESPONSE PROGRAM ... 37
CHALLENGES ... 47
FINDINGS ... 51
KW IMPACTS ... 51
PROVEN TECHNOLOGY ... 51
IMPLICATIONS FOR SETTLEMENTS ... 52
DEMAND RESPONSE IN OFF‐PEAK SEASONS ... 52
MARKET IMPACTS ... 52
CCET DR PILOT RECOMMENDATIONS ... 54
APPENDIX A: ADDITIONAL INFORMATION PERTAINING TO CONTROL TECHNOLOGIES ... 58
COMVERGE ... 58
CORPORATE SYSTEMS ENGINEERING ... 62
Table of Figures
Figure
1.
Houston
and
Dallas
Program
Overview
Diagrams
...
5
Figure
2.
Comverge
System
Architecture
Diagram
...
7
Figure
3.
Customer
Web
Portal
...
8
Figure
4.
Utility
Web
Portal...
8
Figure
5.
Sample
CSE
Customer
Thermostat
Web
Interface
...
10
Figure
6.
Downstream
BPL
Communications,
CSE/Current
Group
...
11
Figure
7.
August
27
Curtailment
Event
–Air
Conditioner
Cycling
from
3
PM
to
7
PM
...
20
Figure
8.
October
3
Curtailment
Event
–Thermostat
Offset
from
3
PM
to
5
PM
...
21
Figure
9.
Participant
Household
kW
Impacts
in
Dallas:
All
Curtailment
Events,
BPL
Area
Participants
...
23
Figure
10.
Histogram
of
Thermostat
Offset
kW
Impacts
...
25
Figure
11.
Histogram
of
50
percent
Cycling
kW
Impacts
...
25
Figure
12.
Histogram
of
kW
Impacts
of
the
August
27
Curtailment
Event
...
27
Figure
13.
Predicted
Event
Day
Household
Demand
Response
...
30
Figure
14.
Scaled
Load
Profiles
and
Average
Customer
Energy
Use
–
Res
Hi
Participants
on
October
3
rd
...
31
Figure
15.
Scaled
Load
Profiles
and
Average
Customer
Energy
Use
–
Res
Lo
Participants
on
October
3
rd
...
31
Figure
16.
Overall,
how
satisfied
are
you
with
the
demand
response
program?
...
33
Figure
17.
How
satisfied
are
you
with
your
new
thermostat?
...
34
Figure
18.
How
could
the
program
be
improved?
...
34
Figure
19.
Since
the
program
started,
have
you
noticed
any
specific
occasions
on
which
your
thermostat
was
being
externally
controlled
by
your
retail
electric
provider?
...
35
Figure
20.
Did
you
experience
any
discomfort
due
to
your
thermostat
being
controlled
by
your
retail
electric
provider?
...
35
Figure
21.
How
would
you
classify
your
discomfort?
...
36
Figure
22.
What
was
the
primary
reason
that
you
agreed
to
participate
in
the
pilot
program?.
36
Figure
23.
Typical
Balancing
Energy
Supply
Curve
...
38
Figure
24.
Effects
of
Demand
Response
on
the
Market
‐
Clearing
Price
of
Balancing
Energy
...
39
Figure
25.
Close
Up
View
of
Effects
of
Demand
Response
on
the
Market
‐
Clearing
Price
of
Balancing
Energy
...
40
Figure
26.
Effects
of
Demand
Response
on
Market
‐
Clearing
Price
of
Balancing
Energy:
500
MW
Needed
to
Resolve
a
Constraint
(Case
1)
...
41
Figure
27.
Effects
of
Demand
Response
on
Market
‐
Clearing
Price
of
Balancing
Energy:
250
MW
of
Demand
Reduction
Needed
to
Resolve
Constraint
(Case
2)
...
41
Figure
28.
Changes
in
Price
due
to
Curtailment
...
43
Figure
29.
Curtailment
Effect
...
44
Figure
30.
Percent
Change
in
Daily
Average
Balancing
Energy
Prices
...
44
Figure
39.
Comverge
System
Architecture
Diagram
...
59
Figure
40.
ZigBee
Configuration
Diagram
...
60
Figure
41.
Customer
Web
Portal
...
61
Figure
42.
Utility
Web
Portal...
62
Figure
43.
Sample
CSE
Customer
Thermostat
Web
Interface
...
63
iii
Figure
44.
Load
Control
Dispatch
Application
...
64
Figure
45.
Downstream
BPL
Communications,
CSE/Current
Group
...
65
Figure
46.
System
Diagram
–
CSE
System
Architecture
...
65
Table of Tables
Table
1.
Summary
of
Contractual
Relationships
...
13
Table
2.
Summary
of
Progress
in
2007
...
14
Table
3.
Schedule
of
Implemented
Curtailment
Events
...
15
Table
4.
Baseline
Method
Savings
Estimates
–
Average
of
Curtailed
Intervals
...
19
Table
5.
Estimated
Savings
by
Event
...
19
Table
6.
Overall
kW
Impacts
of
Curtailment
...
22
Table
7.
Regression
Results
–
Curtailment
Strategy
...
24
Table
8.
Regression
Results
–
Hourly
kW
Impacts
of
Regression
Events
by
Date
...
26
Table
9.
Regression
Results
–
Hourly
kW
Impacts
of
Curtailment
Events
by
Date:
Fixed
Effects
Model
...
28
Table
10.
Summary
of
Results
...
42
Demand Response Pilot Program Draft Final Report 1 Center for Commercialization of Electric Technologies
Executive Summary
The Demand Response (DR) Pilot Program of the Center for the Commercialization of Electric
Technologies (“CCET”) was a collaboration between three Retail Electric Providers (REPs Direct Energy, Reliant Energy, and TXU Energy), three Transmission and Distribution Service Providers (TDSPs American Electric Power, CenterPoint Energy – Houston Electric, and Oncor Electric Delivery), and demand
response-enabling technology providers (Comverge and Corporate Systems Engineering) that began in early 2007. It was undertaken in order to explore the opportunities and challenges associated with implementing residential demand response programs in the restructured Electric Reliability Council of Texas (ERCOT) market. The ERCOT market structure, as well as the use and integration of the latest technologies for advanced metering, intelligent grid operation, and in-home controls, make this pilot program unique.
Residents of the Dallas and Houston service areas living within the broadband over power line (BPL) footprints of Oncor Electric Delivery (OED) and CenterPoint Energy – Houston Electric (CEHE) – the areas in which BPL communications capacity were in place - were recruited for participation in the pilot by the REPs from among their existing customers. The Pilot involved the participation of 213 households in the OED service territory and 133 households in the CEHE service area. In addition to bill rebates or similar incentives offered by the REPs, customers were given free programmable, communicating thermostats in exchange for their participation in the program, which involved allowing their air conditioners (and, where applicable, pool pumps and electric water heaters) to be controlled remotely for a limited number of test curtailment events. While a number of challenges (from technological and legal holdups to hurricanes) limited the success of the CCET DR Pilot in terms of measured demand reduction, overall the Pilot accomplished its objectives of demonstrating the technical and operational feasibility of residential demand response in Texas’s deregulated market. The major findings of the CCET DR Pilot are summarized in the following paragraphs.
Proven Technology. It is possible to successfully integrate many of today’s most advanced technologies for monitoring electricity usage, communicating with thermostats controlling air conditioner operation at homes, networking devices within homes, and controlling customer appliances through a voluntary residential demand response program. This pilot program has also demonstrated that demand response programs may be successfully implemented in an “unbundled” competitive electricity market where separate organizations are responsible for the various activities that must be coordinated in order to operate a voluntary demand response program.
kW Impacts. In curtailments called in the late summer and fall of 2008, an average demand reduction of 0.6 kW was estimated for participating homes in Dallas. The demand reduction that was achieved varied depending upon the curtailment strategy employed and customer-specific factors. Had Hurricane Ike and some equipment delays not prevented the deployment of the program during the hottest period of the summer, and had more effective curtailment strategies been employed, we believe that an average demand reduction closer to 1 kW per home would have been attained.
Settlement Implications. Despite the fact that not all curtailment events for this pilot were timed to coincide with daily or seasonal demand peaks, comparison of averaged participant load shapes to the ERCOT load profiles for curtailment events showed that, during modeled curtailment events, participant energy use averaged between 1 and 2 kWh less than that predicted by the load profile. As load control and DR programs are brought to scale, the potential savings on marginal purchases on the balancing energy services market may become significant, particularly when curtailments are timed to coincide with periods of peak prices.
Demand Response in Off-peak Seasons. Given the importance of timing curtailment to periods of peak prices, it is important to note that many of the significant price spikes that have occurred in recent years
in the ERCOT market have been due to constraints occurring in the fall and spring “shoulder” months. Because curtailments were called for this project in September and October, including some of the more successful curtailment events (in terms of estimated load reduction), the findings of this study indicate that DR programs in Texas could provide additional value if market participants contract with participant customers not only for a certain number of summer peak hours, but also for additional hours in the shoulder months. For shoulder month curtailments to be successful, curtailment strategies will need to be adapted to the ambient conditions (e.g. cycling strategies must be more aggressive on cooler days for load reduction to occur).
Market Effects. Had a “commercial-scale” demand response program been in effect during spikes in the price of balancing energy during the summer of 2008, wholesale prices could have been reduced by over 60% during the period of the spikes. This calculation assumes that reduced demand would have enabled ERCOT to “slide down the bid stack,” thus permitting a much lower supply side offer to set the market clearing price of balancing energy (MCPE) during those periods. Under some plausible assumptions, the total value of the reductions in the MCPE during peak periods that could be provided by demand response is estimated to be $160 million.
While this pilot program demonstrated that the technology works and the necessary coordination is possible, many of the challenges inherent in reaching a successful program were underestimated when this pilot was originally designed. Some of the brand-new technologies selected for this pilot had not yet been fully tested in the field, resulting in significant equipment-related delays. Coordination among all the entities involved in this project required the negotiation of numerous contracts to address many issues that had never previously been addressed. Many activities required “manual” efforts, since meter data management systems and procedures for the sharing of data were still under development at the time the pilot was undertaken. Fortunately, many of the problems that this pilot experienced are now being resolved through various projects at the Public Utilities Commission of Texas (PUCT) and the Electric Reliability Council of Texas (ERCOT), and through implementation of systems at the respective utilities.
Recommendations:
The findings described above led the project team to the following recommendations. Processes are in place to address the issues raised in some of these recommendations; however, the experience of the CCET DR Pilot team reinforces their importance and may help elucidate the directions these processes should take.
1. Settle ERCOT Wholesale Prices on 15-Minute Intervals. Market participants’ level of interest in aggressively pursuing demand response may be determined by whether and how ERCOT decides to use 15-minute interval data for wholesale settlements. Rule 25.130 (h) established for ERCOT the objective of being able to use 15-minute interval data for this purpose by January 31, 2010, and ERCOT has been working for some time to establish the procedures that will allow them to accomplish this objective.
2. Deemed Savings or Stipulated Values for Use in ERCOT Settlement. A cost-effective and viable “interim solution” is needed while ERCOT’s settlement system is being enhanced, so that DR program participants’ load shed during curtailment events may be better recognized. Such a solution could facilitate the development of residential demand response programs in the ERCOT market in the short term.
3. Establish a Preferred Method for Quantifying Savings. Even with advanced metering, quantifying savings requires a method to establish the counterfactual – what would have been consumed absent the curtailment event. In this pilot, savings were estimated according to two general methods: day-matching techniques and regression analysis. While each method has its advantages, in this pilot regression techniques were preferred, in part because this pilot was interested not only in estimating savings, but also in explaining the estimates. The inclusion of additional explanatory variables (e.g. temperature, hour of day) provides a greater level of
understanding of the estimated results than are available with day-matching methods. For future DR implementations, establishing clear guidelines for the methods to be employed to estimate savings would help simplify the process, driving down M&V costs. It may also be appropriate to specify different methods for different purposes.
4. Plan to Provide REPs and Curtailment Services Providers better information on market prices and appropriate times for deploying demand-side resources in the future. To maximize the value of investments in residential DR-enabling technology, market participants must be able to anticipate periods of peak prices. In the planned nodal wholesale market system, 15-minute advance price signals will not be provided. Any steps that could be taken to provide advanced notice of wholesale prices in the nodal market would increase the future effectiveness of demand response efforts.
5. Expand Opportunities for Residential Demand Response. The value of residential demand response is not limited to the annual value of reduced generation purchases on the balancing energy services market. Currently, residential direct load control can participate in some programs, such as the Emergency Interruptible Load Service (EILS) program, but has limited ability to provide ancillary service, such as non-spinning reserves. Technological challenges would have to be
overcome and revisions to protocols made, for residential DR resources to provide non-spinning reserves.
6. Promote “smart appliances” in Texas. Future opportunities for Residential Demand Response are likely to include direct load control programs like the CCET DR Pilot, but will also include the introduction of information (e.g. prices, real time power use) to households via the “Smart Grid,” with the advanced meter providing a gateway into the home and using home area networks for communication between appliances and devices in the home. Promotion of smart appliances that can communicate on a HAN will increase consumers’ ability to manage their energy use and increase the loads available to DR programs.
7. Address the “Stranded Investment” Problem. Investments in customer-sited DR technology may be “lost” to the market (as well as to the market participant who made the investment) when a customer changes retail provider or moves out. Changes in retail providers and customer move-outs present two types of challenges: 1) informational – the subsequent provider may not be aware that the resource exists, and 2) technological – the subsequent provider may not be able to
communicate with the resource. PUCT Project #34610 is establishing business rules for access to home area network (HAN) devices, which should address the information issue. Technological issues are also being addressed via continued development of standards in the communications protocols, including requirements that devices be tested by 3rd parties for interoperability. It should
also be noted that the potential loss of the DR resource presents a disincentive for market participants to make the initial investment to put the resource in place.
Demand Response Pilot Program Draft Final Report 4 Center for Commercialization of Electric Technologies
Project Description/Overview
The Demand Response (DR) Pilot Program of the Center for the Commercialization of Electric
Technologies (“CCET”) was undertaken in order to explore the opportunities and challenges associated with implementing residential demand response programs in the restructured Electric Reliability Council of Texas (ERCOT) market. The ERCOT market structure, as well as the use and integration of the latest technologies for advanced metering, intelligent grid operation, and in-home controls, makes this pilot program unique.
The CCET DR Pilot had the following specific objectives:
• Demonstrate that demand response technology solutions can be cost-effectively implemented for
residential customers in Texas by leveraging advanced meter and intelligent grid technology.
• Provide insight into the specific challenges of implementing demand response in Texas’s
largely-deregulated market.
• Demonstrate that market participants in different segments of the unbundled competitive market
can work together to achieve mutual benefits.
• Measure and verify demand response data to determine energy and demand impacts of demand
response offerings and allow estimates of the potential market size.
• Recommend appropriate changes to the Substantive Rules of the Public Utility Commission of
Texas’ (“PUCT”) and to ERCOT’s Protocols that would enable the ERCOT market to better
recognize the value of demand response programs involving energy consumers who are presently
settled1 based upon profiles of customer load that represent averages across the entire
residential class.
• Examine the economic market effects of hypothetical large-scale demand response programs in
ERCOT to inform policy-makers and market stakeholders of the benefits associated with pursuing the recommendations resulting from this study.
This report recounts the success of this pilot program in meeting these objectives.
In the CCET Board Meeting on January 11, 2007, the Demand Response Pilot was approved and a schedule proposed. In part, this pilot program was a response to House Bill (HB) 2129 from the 79th Legislature, Regular Session. Governor Perry signed HB 2129 on June 18, 2005, and the bill went into effect on September 1, 2005. HB 2129 requires the PUCT to establish a non-bypassable surcharge for an electric utility or transmission and distribution utility to use to recover reasonable and necessary costs incurred in deploying advanced metering and meter information networks to residential customers and nonresidential customers other than those required by the independent system operator to have an interval data recorder meter. By September 30, 2010, the PUCT is required to evaluate whether advances in technology, changes in the market, or other unanticipated factors would allow meters or various meter-related products or services to be provided more efficiently or more effectively through
competition, and make recommendations for legislation the PUCT considers appropriate. It is hoped that the results of this pilot will assist the PUCT in the evaluation that it is required to undertake.
The program was operated in neighborhoods served by Oncor Electric Delivery (OED) in Dallas and CenterPoint Energy – Houston Electric (CEHE) in Houston in which broadband over power line (BPL) networks were in place. These two Transmission and Distribution Service Providers (TDSPs) provided access to their advanced metering infrastructure, including interval data, and much of the project funding. AEP-Texas also provided some funding and participated in the program’s development. Three Retail Electric Providers (“REPs”) participated in the CCET Demand Response Pilot Program: Reliant Energy (Reliant), TXU Energy (TXU), and Direct Energy (Direct). Their roles included recruitment of
1 Settlement refers to the process whereby the quantities of electricity sold by generators and purchased by load-serving entities
each 15 minutes is estimated, and the value of power involved in transactions is determined, thereby facilitating payments from sellers to purchasers.
Demand Response Pilot Program Draft Final Report 5 Center for Commercialization of Electric Technologies
customers for the program and oversight of the calling of curtailments. Various technology providers contributed the control equipment and systems necessary to curtail the electricity purchases of contributing residential energy consumers in Houston and Dallas.
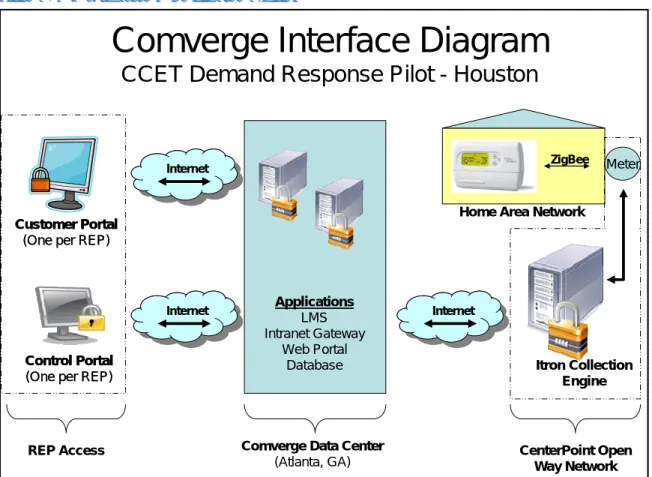
Figure 1. Houston and Dallas Program Overview Diagrams
Although the same three REPs were involved in program activities in Houston and Dallas, different TDSPs, technology providers, and metering and communications infrastructure were used in the two cities. This arrangement produced some differences between program activities in the two cities; the remainder of this section describes the pilot programs in each city, highlighting these differences.
TDSP Oncor
Tech Providers
Corporate Systems Engineering Current Group Comverge REP TXU Energy REP Direct Energy REP Reliant Energy
Dallas Program
TDSP CenterPoint Tech Providers Comverge REP TXU Energy REP Direct Energy REP Reliant EnergyHouston Program
Houston
Pilot
Prior to the restructuring of the ERCOT electricity market, the electric utility serving Houston operated a large and successful residential load control program which relied upon radio frequency signals to curtail air conditioners at the utility’s request. While residential load control is not new to the Houston market, the use of intelligent grid technologies and advanced meters to control loads and monitor changes in usage in response to curtailment requests is new.
In 2006, CEHE worked with Itron and IBM to restructure a pilot program for a limited deployment of advanced meters. By the end of the year, 10,000 meters had been installed, as well as a basic testing platform for back office support of the pilot. Plans at that time included migrating the test environment into an operating back office system that would be integrated with legacy systems to support billing requirements. The CCET Demand Response Pilot team was informed early in January 2007 that customer data could be available on an end-of month basis as early as July 2007, and validated, edited, and estimated (VEE’ed) data could be available as early as October 2007 assuming PUCT approval of CEHE’s meter deployment plan by May. However, the PUCT did not approve changes to their Substantive Rules under Project No. 31418 until the May 10, 2007 PUCT Open Hearing Meeting, and did not formally adopt them until May 25, 2007 (with an effective date of May 30, 2007). This delayed some CEHE
implementation activities.
In early 2007, CEHE opened its Technology Center at its South Houston Service Center, which
demonstrates within a lab environment the proposed advanced metering infrastructure (AMI) and future grid technologies. The center includes a display that features the selected Itron advanced meters and associated advanced metering system. In June 2007, CEHE also installed advanced meters within its broadband over power line (BPL) footprint at the Inverness Apartments and demonstrated the following PUCT-mandated basic functionalities:
• Move in and Move Out with Meter Read: Connect and Disconnect remotely through the portal in
a apartment complex
• Receive Usage Value: The interval read and register read (usage data) were retrieved from the
database and displayed on the Portal
• On Demand Read (ODR) on Request: The portal also allows the user to request an ODR if the
usage data is not sufficient (an ODR is sometimes referred to as an interactive read).
• Energy Consumption Data (Hourly, Daily, and Monthly): Displays a consumer’s energy
consumption in a graphical interface.
• Demand Response and Load Management (ZigBee): The end user can control the apartment’s
temperature settings through Programmable Thermostats.
In Houston, thermostats for the CCET DR pilot were provided by Comverge. The Comverge SuperStat III is a ZigBee-enabled programmable communicating thermostat (PCT) manufactured through a partnership between Comverge and White Rodgers. The thermostat is fully programmable either locally or over the Internet, supports a wide variety of system configurations, is a one-piece design for easy installation, and can be controlled by the utility company over an AMI network. Equipment installation began in November 2007 and continued through June 2008. System testing occurred from June 2008 to October 2008. The dispatch system architecture uses CEHE’s BPL network as the wide area network (WAN) for communicating with Itron cell relays in the field. The cell relays act as the “collector” and can
communicate with up to 1,000 individual meters located at customers’ homes. The system also utilizes a “mesh network” whereby individual meters can communicate with each other and with equipment inside the home including the PCT thermostat and load control switch for pool pumps and electric water
heaters. The mesh network acts as a communications path back to the cell relay. The meter management software platform, called the Itron Collection Engine, manages the communications with cell relays and individual meters and passes data back to a meter data management (MDM) system. Comverge’s load
management software (LMS) communicates with the collection engine through a secure Virtual Private Network (VPN) tunnel. A system architecture diagram is shown in Figure 2.
Figure 2. Comverge System Architecture Diagram
Customer Portal (One per REP) Customer Portal
(One per REP)
Control Portal (One per REP) Control Portal
(One per REP) Itron Collection Engine
Comverge Data Center (Atlanta, GA)
Comverge Interface Diagram
CCET Demand Response Pilot - Houston
Home Area Network
Meter ZigBee Internet Internet Applications LMS Intranet Gateway Web Portal Database
REP Access CenterPoint Open
Way Network
Internet
Internet InternetInternet
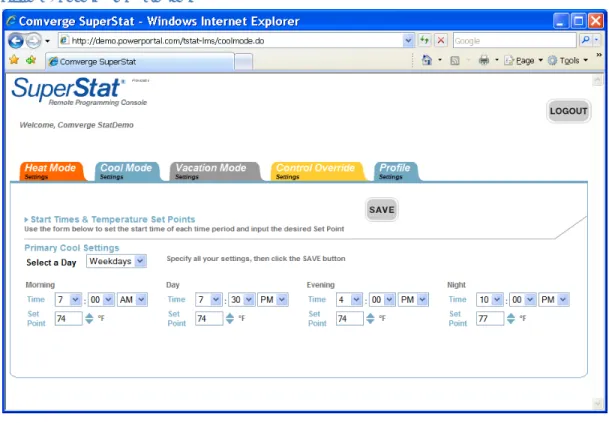
Comverge provided a web portal for customers to access and program their thermostats over the Internet. A screen shot from the portal is shown in Figure 3. The web portal’s capabilities include secure log-in with a user name and password assigned to each account with the ability to change the password online, programming of both cooling and heating for all periods, vacation mode whereby customers could set a “hold” temperature for specific dates and times and override functions for control events.
Each of the REPs also had access to a web portal for scheduling DR control events. A screen shot from the portal is shown in Figure 4. The REP’s web portal assigned a secure login with user name and password to each REP, allowed for advance scheduling of control events using online calendars and pull-down control strategies, and provided the ability to cancel or reschedule events if necessary. The web portal also provided a system log showing all control event information including type, date, duration, and number of devices controlled.
Key issues for Comverge in their interactions with the TDSPs included security, REP access to the system, tracking the REP of record, connection of the load management software to the Itron Data Collection Engine (DCE), and developing a technical solution that would not interfere with the overall system operation. A system access agreement was established between CEHE and Comverge that provided the necessary protection for both companies, and a similar agreement was signed between CEHE and each of the REPs. The physical connection of the LMS software (located in Comverge’s Atlanta data center) and CEHE’s CE (located in Houston) was through a secure VPN tunnel.
Figure 3. Customer Web Portal
Figure 4. Utility Web Portal
Dallas
Pilot
In 2007, Oncor Electric Delivery agreed to encourage residential customers’ participation, , through their Retail Electric Providers (REPs), in programs allowing them to reduce their electricity consumption in response to requests by OED for load curtailment when reliability of the OED transmission and/or distribution system was threatened. The Residential Demand Response pilot program was designed to allow REPs to curtail and/or cycle select residential customers’ thermostats, central air conditioner (A/C) compressors, and pool pumps by appropriate technology attached to the customers’ end-use equipment. OED’s goals for this pilot were threefold:
• to achieve a reduction of 1,500 kW in 2008 to prove the viability of demand response,
• to demonstrate the capability of Current Communication’s broadband over power line (BPL)
technology to carry two-way communications for REPs for demand response purposes, and
• to demonstrate the utilization of meters that provide 15-minute interval consumption data and
the BPL system.
REPs were to be paid an incentive for demand reductions achieved.
Prior to the onset of this project, Current Communications and OED had reached an agreement whereby Current would pay OED for access to OED facilities for the installation of BPL equipment. OED, in turn, agreed to pay Current for use of BPL services associated with automated metering, distribution
automation, and substation monitoring. Current’s BPL technology consisted of installing fiber optic cable from an electrical substation to a point along a distribution feeder where the communication signal would be “injected” onto the primary circuit. This signal would flow down the circuit, be routed around
transformers to the secondary/service, and end up at each customer’s meter. Communication from the meter into the home would be over customer wiring using the HomePlug protocol. It was intended that the project would use this BPL/HomePlug communication scheme to monitor energy conditions and operate customer equipment to allow load to be shed as conditions warranted. This project would be one of the first to utilize two-way communications to verify load reduction.
At the outset of the pilot project, REPs were to contract with Current for customer communications. In May, 2007, a Texas PUC ruling concerning demand response mandated that the local TDSP provide communication for the REPs.
OED agreed to provide 15-minute interval meter data for each customer recruited to the pilot at the end of each month. This data would then be utilized to establish the actual demand reductions achieved during load shed events during the month.
Payments under the OED pilot program were to be limited to single family residential customers in the OED service area where BPL facilities were installed. The residential customer was required to have a monthly summer peak of 1,000 kWh and a central A/C system. Customers were required to sign up for the service with their respective REP. All applications were due by May 30, 2008 to be eligible for the 2008 program.
Initially, it was proposed that the pilot be offered during the Summer Peak Demand Season, June 1 through September 30, from the hours of 1 p.m. to 7 p.m. Central Daylight Time, excluding weekends and federal holidays. A customer’s device was to be activated at OED’s request for a total of 17 hours during a peak season. One Scheduled Curtailment event, of one hour duration, was required to be implemented by the Service Provider at the start the Summer Peak Demand Season each year of the Contract. No one unscheduled event was to exceed a four hour period, and the total duration of
Unscheduled Curtailments were not to exceed 16 hours, nor be less than one hour. Ultimately, the three REPs participating in the OED project - Direct Energy, Reliant Energy, and TXU Energy - did not sign up for the above proposals due to project delays and length of commitment.
Demand Response Pilot Program Draft Final Report 10 Center for Commercialization of Electric Technologies
All meters deployed by OED were provided by Landis + Gyr. These meters recorded 15-minute interval readings internally, and were capable of being interrogated periodically to upload the interval readings to home-office data systems over the BPL network.
29,000 Dallas customers with meters on the BPL system were identified as available for REPs to recruit for the pilot project. Each REP recruited from their respective existing customers for this pilot. Due to slow customer recruitment and technology delays involving communications and switch development (which were inter-related issues, as some REPs preferred not to begin recruitment until they were convinced that the enabling technology was ready. By the time the project actually began, TXU Energy had reached agreement with their project customers to use the customer’s personal internet access rather than BPL to enable thermostat control. By this time, OED owned the BPL system and Current operated it for them.
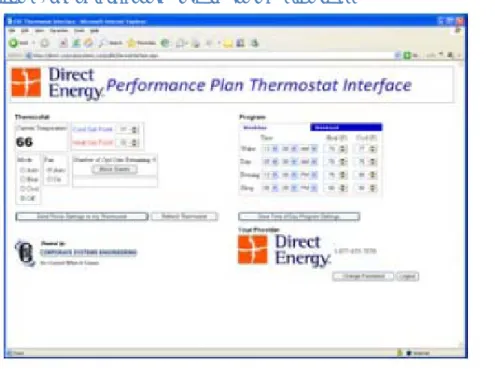
Thermostats installed for participant customers of two of the three participating REPs in the Dallas area were provided by Corporate Systems Engineering (CSE). Thermostats were installed between August and November of 2008, with CSE providing software and hardware and CSE Services providing installations for one REP and training and support for the other. For the third REP, Comverge provided the hardware, software, and dispatch services independent of the Oncor/Current Group infrastructure.
The thermostats installed for participating REPs using CSE’s equipment were CSE/Aprilaire two-way communicating thermostats. They were installed along with a communications bridge, also developed by CSE, which was installed at the air handler. The bridge enabled BPL communications from Current/Oncor to be communicated to the thermostat using the home’s electrical wiring and the HomePlug protocol, and enabled the in-home devices (thermostats and switches) to communicate via BPL to the head-end system. Once each thermostat and/or load control switch was installed, it was provisioned through Current to assign a private IP address to each device within Current’s BPL network. As soon as an IP address was assigned, the device was ready to participate in load control events and, in the case of thermostats, be accessed by the homeowners over the internet. Customer installations were scheduled by CSE, and the provisioning of the devices to the network was a coordinated effort between CSE and Current (who was operating the network on behalf of OED).
Demand Response Pilot Program Draft Final Report 11 Center for Commercialization of Electric Technologies
CSE designed, tested, and demonstrated the successful operation of the customer web portal, an example of which is provided in Figure 5, which allowed customers to view and change settings on thermostats.
CSE also designed and implemented a fully operational dispatch program for communications from dispatch through the BPL Network to the household, whereby the REPs can control demand response events from a designated authorized computer. This dispatch program allows the user to control any or all thermostats and devices installed and operating on the Current Network, and has the ability to receive confirmation and status signals from the installed thermostats. The CSE Dispatch Software Program installed on the REPs’ computers gave them the ability to call and implement an event at any time; however, the REPs did not execute any events during the Pilot. For the Pilot, all events were initiated by CSE.
Whether commands originated with the customer or were set using the dispatch application, they were sent to a Command Processor at CSE’s Indianapolis host site where they were further processed and validated. Once successfully validated, the device directives and the list of devices to be controlled (for a given curtailment event) were sent to the CSE Point Of Presence (POP) server in Dallas. The server was located within the Current BPL footprint and was required to give the Dispatchers and homeowner access to the Private IP addresses in the Current BPL network. Once at the POP server, the IP address of the device in question was looked up, a TCP/IP connection was established with the device, and the commands were passed through to affect the appropriate device in the desired way.
gure 6. Downstream BPL Communications, CSE/Current Group
Demand Response Pilot Program Draft Final Report 12 Center for Commercialization of Electric Technologies
Project Activities
The CCET demand response pilot took place over the course of a two-year period. This section outlines what was accomplished during the various phases of the project.
Achievements
in
2007
This project was challenging to participants on many fronts. Many of the business relationships needed were new, and not all the technology needed was fully mature and commercially available. During 2007, the parties defined the various business relationships and negotiated and put appropriate contracts into effect, although this took longer than expected. Delays were experienced in acquiring the control devices (e.g., thermostats and control switches) necessary to curtail and control select electrical loads of program participants through home-area networks, due in part to the newness of the technology being deployed. Nonetheless, considerable progress was achieved in 2007:
• A number of meetings and conference calls were held in order to develop among the parties a
shared understanding of the pilot project’s goals and activities. Some key logistical issues were successfully resolved involving:
o Responsibilities of each party.
o Technology analysis, including the features and availability of control equipment.
tems.
o Establishing channels for communications and control.
o Financial compensation to the REPs from CCET and the TDSPs.
o Determination of the demand reduction quantities that will be used for calculation of energy
efficiency payments from TDSPs to REPs.
o Scheduling of program activities, including participant recruitment, equipment delivery, and
equipment installation.
• Contractual arrangements were successfully established among the numerous parties involved in
the pilot program, as noted in Table 1.
• The staff of ERCOT was invited and became actively engaged in the project.
• The project Research Plan was refined and incorporated into a revised Program Plan, which was
approved by the CCET Board.
• An interim solution was established for communications, load control, and meter data access for
the Houston Pilot whereby a VPN tunnel was configured to allow the Comverge Load
Management System to communicate between firewalls from the Comverge’s Atlanta datacenter and CEHE's OpenWay Data Collection Engine server down to the advanced meters to the ZigBee-enabled Comverge SuperStat Basic thermostats and Digital Control Units. Although the
acquisition of 15-minute interval data from CEHE was initially a manual process, the REPs worked with CEHE's web portal design to facilitate the automated access of meter data to at least the day after, as required by current PUCT advanced meter rules.
• New state-of-the-art control equipment (i.e., programmable thermostats and load control
switches) from Comverge (for program implementation in the CEHE service area) and Corporate Systems Engineering (for program implementation in the OED service area) were ordered. Initial testing of the Comverge thermostats was performed.
• Two different technologies for in-home communications were selected to be tested as part of the
pilot: ZigBee™ wireless in the CEHE area and HomePlug™ on existing 120 Vac home wiring in the
OED area.
• Formats and procedures for sharing the load data of participants among the parties involved in
this Pilot program were established.
• Marketing Plans were developed by the REPs.
• A project Communications Plan was established.
Demand Response Pilot Program Draft Final Report 13 Center for Commercialization of Electric Technologies
• Members of the Project Team participated in meetings of the ERCOT Profiling Working Group, the
Group, the ERCOT Demand Side Task Force, and the PUCT’s g. In each of these forums, the experiences of the CCET Demand
hared.
ng basic information about , space heating, and water heating equipment and dwelling
In previous tests the units responded in
uccessfully completed load shed events tests using its s were completed for each REP. These tests represented a
a load ERCOT Demand Side Working
Advanced Metering Rulemakin Response Pilot Program were s
• A preliminary Test Plan was developed.
• A data collection instrument was created for the purpose of collecti
participants and their air conditioning characteristics.
• A variety of approaches to measuring the impacts from a demand response program were
delineated.
• Customer recruitment activities were initiated.
• Participant recruitments, equipment procurement, equipment testing, and initial equipment
installation were initiated. Installation crews were trained.
• Comverge conducted tests from Atlanta using the VPN that tested the temperature hold and
other features of the thermostats with good results.
about 5 seconds. However, the initial test had limited success when it was discovered that Itron’s security required that the meters be enabled to receive the Comverge signals. Once this setting was changed, the system response was typically 5-10 seconds.
• Corporate Systems Engineering s
equipment and systems. These test
completed end-to-end system test, the equivalent of what a REP would execute during shed event.
Table 1. Summary of Contractual Relationships
Contracts Parties TDSP Research Project Funding CCET – OED & CEHE
CCET management of research funds CCET – Direct, Reliant & TXU Energy Efficiency Market
Transformation Program Funding OED – Direct, Reliant & TXU – Direct, Reliant & TXU CEHE
Material & Services Comverge – Direct, Reliant & TXU Current – Direct, Reliant & TXU ASP (Application or Ancillary)
Service Provider Agreements
OED – Corporate Systems OED – CURRENT
Comverge – CEHE
CEHE – Direct, Reliant, TXU
License Agreement Corporate Systems – Direct, Reliant, & TXU GridPoint and Direct
Meanwhile, various members of the CCET project team monitored and contributed to a number of activities at the PUCT and ERCOT that affected future prospects for demand response programs in the ERCOT market:
• The PUCT enacted rules outlining the required functionality for advanced meters through Project
No. 31418 and added a requirement that TDSPs carry demand response control messaging over osed new Energy Efficiency Rule that could facilitate
irement that energy efficiency measures e a 10-year minimum life and by removing communications networks utilized for advanced metering.
• The Staff of the PUCT released a prop
demand response efforts by removing the requ implemented through a Standard Offer Program hav
Demand Response Pilot Program Draft Final Report 14 Center for Commercialization of Electric Technologies
certain incentive caps and restrictions upon load management. However, the proposed rule would also constrain a TDSP’s ability to fund future research projects.
• The PUCT approved an expanded Emergency Interruptible Load Program (“EILS”), which will
require ERCOT to open opportunities for residential demand response programs to receive a greeing to curtail usage during an ERCOT system
007. payment from the market in return for a
emergency.
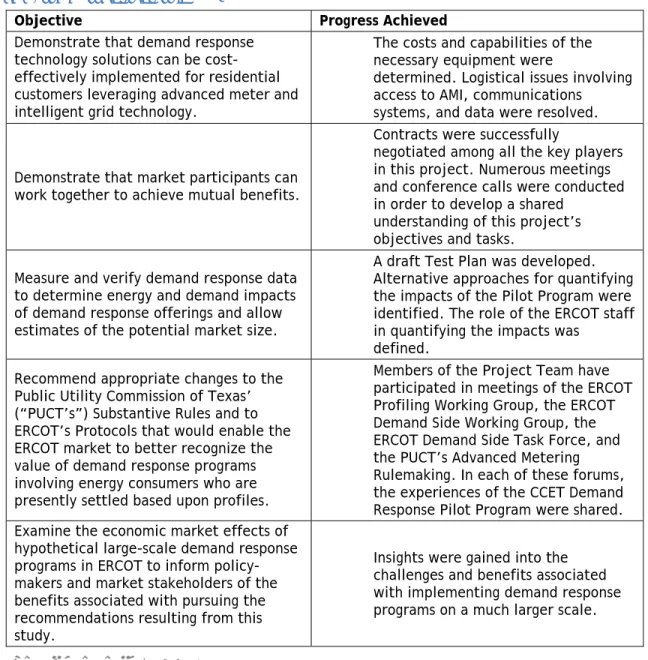
Table 2 summarizes the progress achieved toward each of the primary objectives of this project in 2
Table 2. Summary of Progress in 2007
Objective Progress Achieved
Demonstrate that demand response • The costs technology solutions can be
cost-effectively implemented for residential customers leveraging advanced meter and intelligent grid technology.
and capabilities of the necessary equipment were
determined. Logistical issues involving access to AMI, communications
systems, and data were resolved.
Demonstrate that market participants can work together to achieve mutual benefits.
cessfully
negotiated among all the key players in this project. Numerous meetings and conference calls were conducted
• Contracts were suc
in order to develop a shared understanding of this project’s objectives and tasks.
Measure and verify demand response d a ngs and allow
size.
• A draft Test Plan was developed. tive approaches for quantifying
he Pilot Program were identified. The role of the ERCOT staff
he impacts was
ata Alterna
to determine energy and demand imp cts the impacts of t of demand response offeri
estimates of the potential market in quantifying t defined. Recommend appropriate changes to th
ublic Utility Commission of Texas’ nd to enable t
ize the lue of demand response programs volving energy consumers who are resently settled based upon profiles.
ct Team have roup, the ERCOT Working Group, the ERCOT Demand Side Task Force, and
PUCT’s Advanced Metering making. In each of these forums,
s of the CCET Demand Program were shared. e • Members of the Proje
P
(“PUCT’s”) Substantive Rules a ERCOT’s Protocols that would
t to better recogn he Demand Side ERCOT marke va in p
participated in meetings of the ERCOT Profiling Working G
the Rule
the experience Response Pilot Examine the economic market effects
ypothetical large-scale demand respo rograms in ERCOT to inform
policy-akers and market stakeholders of the
• Insights were gained into the challenges and benefits associated of
h nse
p m
benefits associated with pursuing the recommendations resulting from this study.
with implementing demand response programs on a much larger scale.
January
–
July,
2008
In the first half of 2008, the primary responsibility of the REPs was to recruit participants from their ired of respective customer bases within the BPL footprints in Dallas and Houston. The pilot guidelines requ that the REPs only market to their existing customers. Before recruitment could begin, a number contractual agreements had to be arranged. Table 1 provides a summary of those contracts.
Demand Response Pilot Program Draft Final Report 15 Center for Commercialization of Electric Technologies
REPs used different forms of direct marketing, combined with healthy incentives, to encourage their customers in the BPL footprint to participate in the program. Due to the compressed schedule and
for ide project objectives of having 500 participants in each city. stallation of enabling technology began in late 2007 and continued into the late summer of 2008. By
ad been completed that the team was able to perform the first for all Houston customers and for TXU’s Dallas customers. System
veri ng for households at which the CS nologies were installed began in
Dall
Cu
The s beginning
Aug ent events for the p e
associated data were carried out as shown in
Tab
Date Time of Day # of
relatively small number of potential participants within each TDSP’s AMI footprint, REPs focused these efforts on maximizing signups, and provided greater incentives than would be considered economical a large-scale program. Even so, recruitment proved challenging and the REPs were not able to prov sufficient customers to meet the original
Installation
and
System
Verification
In
early August, sufficient installations h system verification test on August 8th
fication testi E/Current Group tech
as on September 19th.
rtailment
curtailment verification testing event on Aug
ust 22nd. Subsequent curtailm ust 8
th was followed by additional curtailment
urpose of shedding load and collecting th Table 3.
ts
le 3. Schedule of Implemented Curtailment Even
(Hour Ending) Hours
Dallas Houston Proprietary Algorithms Used? A/C Curtailment Strategy Temperature (°F) Ave/High A/C Curtailment Strategy Temperature (°F) Ave/High 8/8/2008 5 pm 1 50% Cycling 87/96 50% Cycling 85/96 No 8/22/2008 4 pm 1 50% Cycling 87/97 50% Cycling 82/90 No 8/27/2008 4 pm - 7 pm 4 33% Cycling 87/97 33% Cycling 83/93 No 9/4/2008 4 pm - 5 pm 2 50% Cycling 78/89 50% Cycling 80/90 No 9/11/2008 4 pm - 5 pm 2 33% Cycling 84/93 No Curtailment Events- HURRICANE IKE Yes
9/19/2008 5:10 pm 1 3 degree Tstat offset 74/85 No
9/25/2008 4 pm 1 3 degree Tstat offset 79/89 No
10/3/2008 4 pm - 5 pm 2 3 degree Tstat offset 78/93 No
10/21/2008 3 pm - 4 pm 2 3 degree Tstat 33% Cycling/ offset
71/82 50% Cycling 69/81 No
11/5/2008 3 pm - 6 pm 4 3 degree Tstat 33% Cycling/ offset
Demand Response Pilot Program Draft Final Report 16 Center for Commercialization of Electric Technologies
Data Collection and Analysis
The TDSPs were responsible for compiling data from the advanced meters installed at participant households and providing these data to the M&V contractor (Frontier Associates LLC, herein, “Frontier”). Upon receipt of these data, the M&V contractor performed a number of analyses, as described in this section.
Data
Collection
Estimation of the impacts of residential load control requires the recording and analysis of significant volumes of data. Data collection proved a challenge for the CCET Pilot, as the TDSPs were in the process of upgrading their automated data collection systems to handle the significantly higher volume of data that the advanced meters produce as compared to the meters they replaced (2,880 data points per mete
for a 30-day month, which previously generated only 1 data point). Because this was a pilot program, ad r
e put in place for the transmission and extraction of these data. Data were and provided to Frontier for analysis.
the ractor (Frontier) had to develop and implement rocedures by which to fill in certain gaps in the received data. To do this, Frontier took advantage of the
oth OED and CEHE provide daily or sub-daily register
read information that could be used to estimat g 15-minute intervals b ) subtracting the
sum of the 15-minute interval reads that had been register reads from the cu
register read for that time period, and (b) distributin ene nsum h
intervals ta din ion pat from ays.
Additionally, some demographic data about participating customers were provided by the REPs, although
ata obta ring the stalla ited. Weather data y bu rature,
cloud cover, dew point, and wind speed were obtained from NWS monitoring stations at DFW and IAH
s for th d during hich ed.
Houston Data
l d for Houston was compromised by a meter ch occu ard the
end of August. CEHE discovered that the signal emitted by the ZigBee chip in its meters was not
ientl d ha o upg ith gr wer. in the anged o
the meters, taking with them data that had not been interrogated from those meters. These meters were
se events prior e out were lost. The change out affected data for all
August curtailment events, leaving only d ptember 4 event prior to the onset of Hurricane
hich s testin st of October. Data from participant households we
provided to Frontier in text files.
rov D s-a f 2008. Like CEHE, OED’s ability to automate the
ttal data was com d by the switch 5-minute interval meters. Data were
developed through a series of manu ns of their data systems, and provided to Frontier in
s. ided urly mber of customer twor e
customers were brought into the pilot b f the REPs.
a
nse a
A number of methods are available for g demand response data. Generally, methods are broken
to two categories: day-matching algorithm or the use of regression techniques. The CCET pilot set two objectives for analyzing the curtailment event data from this project:
hoc systems had to b eventually compiled
The data that the M&V consultant received were not Validated, Edited, or Estimated (VEE’ed) by TDSPs. For both Dallas and Houston data, the M&V cont
p
additional data provided by the advanced meters; b e missin
made between ased on (a
g the remaining terns mulative ption among t rgy co surrounding d e
with missing da accor g to consumpt
the d ined du in tions were lim , including dr lb tempe
airport e perio w testing occurr
Interva ata collection ange out that rred tow
suffic y powerful, an d t rade to one w eater po Technicians field ch ut
later re t, and data for to the chang
ata for the Se
Ike, w uspended g in Houston until the 21 re
Dallas Data
OED ptransmi ided data for the and storage of alla rea at the end oplicate to 1 al interrogatio
data from a nu y one o
text file OED also prov ho s on a PLC ne k. Thes
Dem nd
Respo
D ta
Analysis
analyzin in
Demand Response Pilot Program Draft Final Report 17 Center for Commercialization of Electric Technologies
• (“Ex-post”) To develop an accurate estimate of the de
curtailments, and mand reduction achieved through project
f the day-matching algorithms currently used by system operators around the country (including and ERCOT). The objective of this exercise was to identify which method might
and savings from a direct load control program in Texas.
d,
omparison of Day-Matching Methods
;
the matching chniques may be as simple as prior day averaging, the techniques implemented by the major system
ork ISO (NYISO), ISO New England (ISO-NE), and tions demonstrate an important characteristic of these methods; they are that the most important days for establishing the baseline demand during a
e ed upon
BL Window.” The 10 days making up the CBL Window are identified by he other methods, with some minor differences. It begins two days prior (days of non-holiday weekdays) to the day of the curtailment, and excludes days for which the
t weekdays preceding each curtailment event, urtailment.
• (“Ex-ante”) To predict demand savings that could be expected from a production level
deployment of residential direct load control in Texas.
Furthermore, the M&V team set out to compare demand response estimates produced according to a number o
the NYISO, ISO-NE, PJM, be best for estimating dem
The estimation of curtailment impacts was complicated by the difficulty the M&V consultant had in obtaining curtailment event logs. Ideally, had it been known exactly which customers were curtailed, an in the case of air conditioner cycling, at what time the air conditioners were turned off and back on, this information could have been paired with the 15-minute interval data collected from the TDSPs to demonstrate more precisely the demand impacts of curtailment.
C
Day-matching techniques are generally considered useful for ex post estimates of curtailment impacts they are good for estimating the demand and energy impacts of a given curtailment event. However, they are less useful for predicting the impacts of future events, because they are specific to the conditions surrounding that event.
Day-matching involves the establishment of a baseline demand against which to compare the actual amount of energy consumed during a curtailment event; the difference between the baseline use and measured (interval) use is the estimated savings. While establishing the baseline for day
te
operators around the country are generally more complex.
For this pilot, the project team estimated the baseline demand according to the methods employed by three independent system operators (ISOs): the New Y
PJM. The following descrip generally designed so
curtailment event are the hotter days preceding the event (not including weekends or holidays, which ar generally thrown out). The underlying assumption is that demand-side resources are typically call on the days in which demand is projected to be highest, which tend to be the hottest days.
NYISO Baseline:
The NYISO’s Customer Baseline Load (CBL) is identified by taking the hourly average load (the average load in a given hour) across a 5 day “CBL Basis” period. The CBL Basis is identified by taking the highest 5 of the 10 days making up the “C
criteria similar to t similar type – e.g.
average daily event period usage was less than 25% of the average of the other days. An elective weather-sensitive CBL method is also provided by NYISO, but this was not pursued.
The following data are required for calculation of the CBL:
• Hourly load data for non-holiday, non-curtailmen
with a minimum of 10 days prior to the first c
Demand Response Pilot Program Draft Final Report 18 Center for Commercialization of Electric Technologies
PJM Baseline:
The PJM baseline calculation methodology does not differ greatly from that of the NYISO metho days are selected by the same criteria (including only non-holiday weekdays), and daily usage is averaged (called the ADEPU, or average daily event period usag
d. Ten e). The 10 days’ usage is averaged as
O, the five highest f those 10 days are selected, and hourly usage for those 5 days is averaged to establish the hourly
hods.
:
t weekdays preceding each curtailment event,
e rollary to NYISO’s CBL Basis Period) is much higher than NYISO’s. In is pilot, the general finding was that the PJM baseline and the NYISO baseline were generally the same,
h, for each of the 24 hours in a day. ISO-ed
the hours t, but is only applied if the adjustment would increase the baseline.
stimation of the various baselines was hindered by a variety of complications. The baseline methods
nd many customers in this study
• Computationally burdensome: the additional computational structure that was created led to long
run-times for calculations of baseline for large sets of data. One enhancement was made that allowed for shorter run-times, but it did not come until late in the analysis.
well, to create the ADEPL (average daily event period level). Each day’s ADEPU is compared to the ADEPL, and if any day’s ADEPU is less than 75 percent of the ADEPL, that day is thrown out, the next most-recent eligible day is selected, and each of the 10 days’ ADEPU is again compared to the ADEPL. This process is repeated until 10 valid days have been identified. Then, like the NY IS
o
baseline. PJM adjusts the baseline for day-of event weather effects on customer load using two met The average of hour method compares the ratio of usage in the two hours prior to the event to the baseline usage in those same two hours.
The following data are required for calculation of the PJM baseline
• Hourly load data for non-holiday, non-curtailmen
with a minimum of 10 days prior to the first curtailment.
• Load data for the 2 hours preceding each curtailment event
In theory, the PJM baseline should only be the same as, or higher than the NYISO baseline, as th criteria for inclusion in the ADEPL (co
th
so findings are presented for both under the heading of the NYISO baseline.
ISO‐NE Baseline:
ISO-NE refers to its baseline as the Customer Baseline (CB). Under ISO-NE’s protocol, the CB is estimated ased on the average hourly load, rounded to the nearest kW
b
NE’s protocol differs from other protocols in that it is essentially a weighted moving average. It is updat each day according to this formula:
CB d = 0.9 * CB d-1 + 0.1 * MeterReading d
At the end of each day, the baseline for each hour is updated by multiplying the previous day’s baseline for that hour by 0.9, and adding it to one-tenth of the day’s meter read for that same hour. The ISO- NE also provides for adjustments to the baseline used for a curtailment day based on the load in
prior to a curtailmen Data Required:
• Hourly load data for non-holiday, non-curtailment weekdays preceding each curtailment event,
with a minimum of 5 days prior to the first curtailment. Load data for the 2 hours preceding each curtailment event
Baseline Calculation
E
proved to be:
• Difficult to implement: the determination of a baseline for home for one event was a fairly
straight forward task, but dealing with the many events a required additional computational structure.
Demand Response Pilot Program Draft Final Report 19 Center for Commercialization of Electric Technologies
• Problematic when data gaps occurred: ranking methods used ranking algorithms that could not
omer dified NE-ISO method was implemented that corrected for this
ing this modified method for the
thods
and NY ISO baseline methods for
roduced savings estimates that ranged from negative savings for cycling events
Estimates (kW)
handle days with identical values. Methods of gap-filling were designed in an attempt to overcome this, but data gaps of multiple days continued to present problems.
• Unreliable for single home predictions, particularly when using 15-minute interval data.
• Designed for situations that differed from those encountered in the current project.
• Used weather normalization methods that did capture short-term weather fluctuations.
Other key points:
• The NY-ISO and PJM methods produced very similar results, so the PJM method was abandoned
for the sake of computational load reduction.
• The NE-ISO method uses a weather-adjustment that is biased toward over-estimating energy
usage. Baseline values are only adjusted when the baseline value is less than the actual cust load at the start of an event. A mo
upward bias in the baseline, but the full consequences of us analysis were not investigated.
Estimated Demand Reduction using Day‐matching Me
Initial analysis indicated that the calculated savings using the ISO-NE
would be low. This preliminary conclusion was drawn by combining all calculated savings estimates each 15-minute interval (the difference between the calculated baseline estimate and the actual measured usage) in which a curtailment occurred. The average of calculated savings estimates is presented by curtailment type in Table 4.
The NY ISO method p
(more energy use with curtailment) to 0.3 kW for temperature offset events.
Table 4. Baseline Method Savings Estimates – Average of Curtailed Intervals
Average of Calculated Savings
ISO-NE NY ISO
All Curtailments 0.373 0.074
Temperature Offset Events 0.825 0.297
Cycling