Procedia Computer Science 22 ( 2013 ) 902 – 911
1877-0509 © 2013 The Authors. Published by Elsevier B.V. Selection and peer-review under responsibility of KES International doi: 10.1016/j.procs.2013.09.173
ScienceDirect
17th International Conference in Knowledge Based and Intelligent Information and Engineering Systems - KES2013
Feature Selection Based on Information Theory
in the Clock Drawing Test
Mohamed Bennasar
a,
Rossitza Setchi
a,*, Antony Bayer
b, Yulia Hicks
a aSchool of Engineering, Cardiff University, UKbSchool of Medicine, Cardiff University, UK
Abstract
The Clock Drawing Test is one of the most widely used screening tools for cognitive impairment and dementia. Since its introduction, more than fifteen scoring systems have been developed to assess the clock drawings. However, very little research has been conducted to study the significance of the elements (features) of the clock drawings for the correct diagnosis of dementia. This paper employs a feature selection method called Feature Interaction Maximization (FIM) to identify the most significant visual features of the test, which can be associated with dementia. The proposed approach is tested with a dataset of 648 clock drawings produced by dementia patients and healthy individuals. The results are compared with other methods used by medical experts. Furthermore, the paper compares the FIM method with an alternative feature selection method based on Information Gain. The results show that the FIM method selects features with higher discriminative power which leads to a deeper understanding of the Clock Drawing Test.
© 2013 The Authors. Published by Elsevier B.V.
Selection and peer-review under responsibility of KES International.
Keywords: Clock Drawing Test; Feature Selection; Information Theory; Interaction Information
1.Introduction
The term ‘dementia’ is used to describe the loss of cognitive ability, which is usually progressive and eventually severe and which affects memory, attention, problem-solving, and communication skills. People of any age can be affected by dementia, but it is most common among elderly people. One in six people over 80, and one in fourteen people over 65 suffer from some type of dementia [1]. A 2005 report from the Alzheimer's Society estimates that more than 683,597 people in the UK suffer from dementia (1.1% of the entire UK population). This number is expected to increase to 940,110 by 2021 and 1,735,087 by 2051, which shows an increase of 38% over the next 15 years and 154% over the next 45 years [1].
Until recently, early diagnosis of dementia had been a low priority as the disease was considered untreatable and irreversible. With more effective treatments becoming available, early diagnosis has become more important as it is the first step in understanding and managing the condition. Due to its simplicity, sensitivity, and specificity, the Clock Drawing Test (CDT) has become, in the last 30 years, one of the most widely used screening tools for assessing the degree of cognitive impairment [2, 3].
* Corresponding author. Tel.: +44-29-20875720; fax: +44-29-20874716.
E-mail address:[email protected].
© 2013 The Authors. Published by Elsevier B.V.
Selection and peer-review under responsibility of KES International
Open access under CC BY-NC-ND license.
The CDT is used as a measure of spatial dysfunction. It requires a wide range of perceptual and intellectual skills, which makes it a good screening tool to assess comprehension, planning, visuospatial ability, visual memory, motor programming and execution, concentration, abstraction, and response inhibition [4]. In this test, individuals are asked to draw the face of a clock, mark in the hours, and then draw the clock hands to indicate a specific time (for example, “5 minutes to 3 o’clock”). The drawings are then assessed using various scoring systems with a different degree of complexity, ranging from a simple binary rating to complex qualitative and quantitative assessments [4]. Research shows a high correlation between the results obtained via CDT and those acquired by other more detailed and time-consuming cognitive screens. The CDT has the additional advantage of being well accepted by patients [5].
Research indicates that patients with more severe dementia show more deficits in the clock drawing task, as compared to those with mild impairment [6]. Therefore, it might be expected that there are distinctive features which can be measured and used to classify the drawings. More than fifteen well validated scoring systems have been developed to capture the defects in the clock drawings associated with dementia. These systems use qualitative, quantitative, or mixed methods based on strict and well- structured protocols and a history of findings and experts’ opinion [7].
This paper introduces a new approach to the automatic analysis of the elements of the clock drawings and suggests that the proposed approach can provide a deeper understanding of the CDT results by employing filter feature subset selection. The approach was evaluated using 648 clock drawings provided by the Memory Clinic at Llandough Hospital in Cardiff, UK. This work is a part of a project aimed at developing a clinical decision support system for early detection of dementia. It aims at assisting clinicians at the point of care with detecting early symptoms of dementia.
The rest of the paper is organised as follows. Section 2 describes the CDT, whilst Section 3 reviews feature selection and related work. Section 4 briefly presents the novel Feature Interaction Maximization method used to identify the most discriminative features in the clock drawings, outlines the experiment conducted, and presents the results. Finally, Section 5 concludes the paper.
2.Clock Drawing Test (CDT)
There are two types of clock drawing test administration. In the first type, the subject is provided with a plain sheet of paper and asked to draw a clock face, place the numbers on it and set the hands on a specific time. In the second type, called the pre-drawn clock test, the individual is given the same task but is also provided with a pre-drawn circle. The CDT makes an impression of being a simple task. However, in reality it is a complex task that requires many brain functions to be employed in order to complete the task. Therefore, any loss of the required functionality in the brain is reflected in the resulting clock drawings [6]. Figure 1 shows examples of drawings produced by patients during their screening.
Several scoring systems have been proposed to analyse the errors in the clock drawings [5, 6, 8, 9, 10, 11]. Specialists agree that the ideal CDT scoring system must be brief, quick, easy to score, generalisable, and highly predictive of dementia [3]. A recent comparative study identified that the scoring systems developed by Shulman et al. in 1986 [5], Mendez et al.in 1992 [9], and Sunderland et al.in 1989 [10] have the best diagnostic accuracy [7]. It was also suggested that the scoring system proposed by Tuokko et al. in 1992 [11] has a high discrimination power in detecting dementia [12], although this system has been also criticised for its complexity [3].
A few studies have studied the significance of the elements (i.e. features) of the clock drawings for the correct diagnosis of dementia. Lessing et al. [9] have studied the features indicating errors in the clock drawings in an attempt to reduce the number of features and to select the most important features that indicate dysfunction. Their study, combining three scoring systems [9, 11, 13], has identified a list of 24 features. The six most important features reported in [9] are: wrong time, no hands, missing numbers, number substitution, repetition, and refusal to draw a clock. Jouk and Tuokko [3] have studied Tuokko’s scoring system [11] to find the most important features out of the 24 features that the scoring system employs. The experiment uses 356
clock drawings including 80 cases of dementia and 276 classified as normal. A binary value is used for the dementia status (0= normal, 1= dementia). The authors employed logistic regression to find the significant features in the clock drawings. The experiment conducted has highlighted the five most significant features: missing numbers, repeated numbers, number orientation, extra marks, and number distance. Both studies [3, 9] assume that the features are independent and study the relation between dementia states and each feature individually.
a b c
d e f
g
Fig.1. Examples of clock drawings drawn by patients at the Llandough hospital: (a) Normal, (b) Alzheimer’s disease, (c) Alcoholic Dementia, (d) Mild Dementia, (e) Mixed Dementia, (f) Vascular Dementia and (g) Parkinson’s disease.
3.Feature selection and related work
Feature selection is another approach used to determine the significance of features in diagnosis tasks. It plays an important role in classification algorithms and is particularly useful in dimensionality reduction for selecting the features with high discriminative power and discarding those that are irrelevant and/or redundant [14].
There are three groups of feature selection methods: wrapping, embedded, and filter methods [15]. The wrapping methods are classifier-dependent; they employ a classifier to assist the goodness of a selected subset according to its classification accuracy. These methods are computationally very expensive and might suffer from over-fitting [16]. The embedded methods are also classifier-dependent. They are different from the
wrapping methods as they use feature selection as part of the learning stage. The disadvantage of the embedded methods is that they are very specific to the learning algorithm [14].
The filter methods are classifier-independent; they select the subset feature that maximises a specific goal function. The filter methods are simple and computationally efficient. They use a variety of measures to find the feature significance. Examples include Pearson correlation coefficients [17], Fisher’s discriminate ratio [18], Scatter criterion [19], Single Variable Classifier [20], Mutual Information [21], and the Relief Algorithm [22, 23].
Information measure is one of the widely used measures in filtering methods. It determines the amount of information that features share with the class label [24]. Mutual Information (MI) is the quantity of shared information between two variables. Strongly related variables share high MI while zero Mutual Information shows that they are independent.
The value of MI can be calculated using entropy. It is the amount of uncertainty about a random variable. Suppose F { ,f1 }} }fN is a discrete variable, and C { , ..,c1 } cM} is a class label. If the probability density function is p fi the entropy of
F
then it is defined as:1 log( ) N i i i F f H
¦
p p f (1)As mentioned earlier, MI is the amount of shared information between two random variables, which means that MI is the reduction of uncertainty by a random variable if the other one is known. MI is defined as:
I F C
; H C H C F( / ) (2) 1 1 , ( ; ) , log( ) ( ) N M i j i j i j i j p f c I F C p f c p f p c¦¦
(3) where 0dI F C( , )dH C( ).If the clock drawing is considered a multivariate dataset, where F are the features of the drawings, and C is the diagnosis of the patient, the significance of the drawing element for the correct diagnosis can be measured using MI.
Mutual Information (also known as Information Gain, IG) is also a measure of correlation. The feature with the highest MI is considered the most significant feature for the diagnosis; its main limitation is the assumption of independence between features, which is not always true. Therefore, many feature subset selection methods based on information theory have been proposed. Feature Interaction Maximization (FIM) [25] is one of the recently developed filter feature selection methods based on interaction information.
( ; ; )j i j, ;i j; i;
I F F C I F F C I F C I F C (4)
Interaction information can be positive, zero, or negative. It is positive when the two features together can provide information which is provided by each of them individually; it is negative when both of them provide the same information, and zero when the two features are independent in the context of the diagnosis label [26]. The proposed approach employs the ‘maximum of the minimum’ criterion. The feature selected by the FIM method is defined as follows:
arg max( ; ( ; ; )) s i f S i s FIM f I f C min I f f C (5)The method selects a feature and takes into consideration those which have already been selected. In particular, each step in the method selects the feature, which has a high MI with the class label and high interaction with the features within the selected subset.
The method employs the following forward greedy search:
1. (Initialisation) Set
F
m
“initial set of n features;” Sm “empty set”.2. (Computation of the MI with the output class) for each feature fiF compute I C f( ; ).i 3. (Choice of the first feature) Find the feature
f
i that maximizes ( ; )I C fi ; set F \ { };mF fi setS { }m fi .4.(Greedy selection) Repeat until S k:
a) (Computation of the interaction information between variables) for all pairs of variables
i; ;sI f f C with fiF f, , sS compute ; ;I
fi f Cs , if it is not already available. b) (Selection of the next feature) Choose feature arg max( ; ( ; ; )) s i f S i s FIM f I f C min I f f C .5. Output the set S containing the selected futures.
4.Experimental setup
This section introduces the clock drawing data used. Next, it describes the experiment conducted. Finally, it presents the produced results.
4.1 Clock drawing data
The data used in this study is provided by the Memory Clinic at Llandough Hospital in Cardiff, UK. The data consists of 648 clock drawings, accompanied by the age of the patient, their gender, and diagnosis. The data was collected between 1991 and 2009 as part of the patients’ examination procedure. The dataset includes twenty-seven different types of dementia. Following medical advice, the less frequent types are grouped together in this study in one class. As a result, seven distinctive classes were identified within the dataset: Alzheimer Disease (AD), vascular Dementia (VaD), Normal, Mild Cognitive Impairment (MCI), Functional disorder (depression and anxiety), Other Degenerative Dementia (ODD) (Parkinson’s disease, Dementia with Lewy Bodies, and fronto-temporal dementia), and other types of dementia (e.g. tumour, alcoholism, and head injury, etc.). Figure 2 shows the data distribution of each class.
This paper focuses on studying the significance of the clock elements in discriminating between normal and demented cases. Therefore, the data is split into two groups; normal and abnormal. The first group is formed using the drawings of healthy individuals and patients with functional problems; the rest of the data is treated as abnormal. All clock drawings were scanned and then several morphological image processing tasks were employed to enhance the quality of the clock drawing images.
This study employs 47 visual features (see Appendix A) that are defined after a comprehensive analysis of the medical literature [6, 9, 10, 11, 13]. This includes the majority of the features employed in the most common CDT scoring systems; new geometrical features are also added to the list based on additional data analysis.
4.2 Experiment
Two alternative methods, Information Gain (IG) and Feature Interaction Maximisation (FIM), are used in the experiment to select the most significant features. The feature set, which leads to a more accurate diagnosis in the classification experiment, is the one considered to be more informative. The continuous features in the dataset are discretised using a recently developed unsupervised discretisation method based on adjustable intervals [27]. The features selected by IG and FIM are used to train three classifiers, Naïve Bayes, K-nearest Neighbor, and SVM from the Matlab Statistics Toolbox, and the average classification accuracy achieved is
used as a performance measure of the selected subset. The classification accuracy is tested using 10 times 5-fold cross-validation; training and testing are performed after adding each feature to the subset. Therefore, the produced accuracy reflects the discriminative power of the whole subset after adding the new selected feature and is not based on the newly selected feature only. Figure 3 shows the framework used in the experiment.
Fig.2. Data distribution on the classes.
4.3 Results
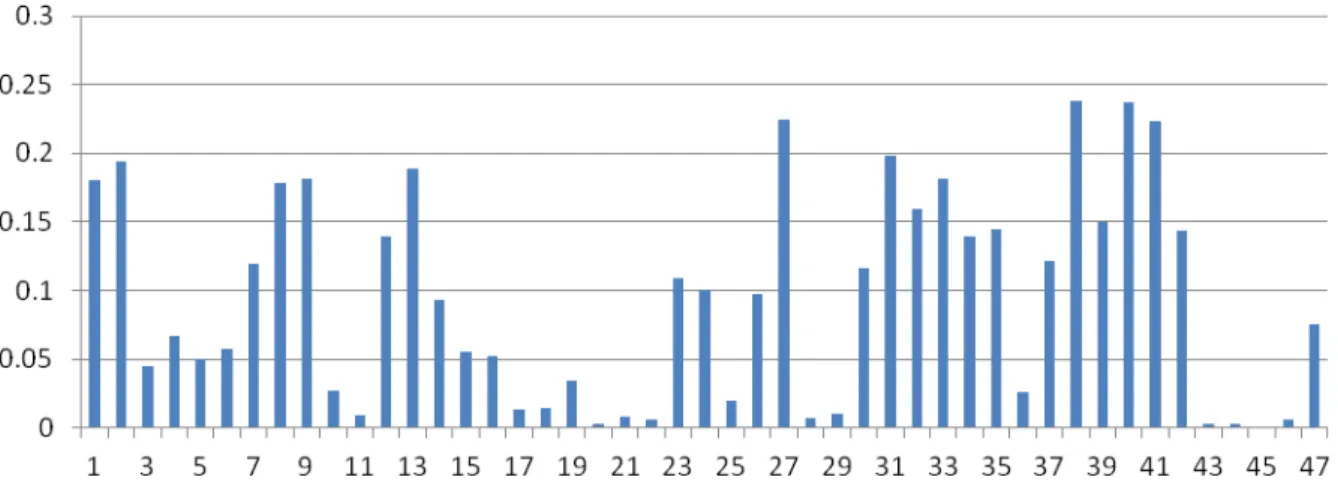
Figure 4 shows the result of applying the IG method, which has computed the amount of information that each feature in the clock drawing shares with the class label (i.e. diagnosis). The features are represented in the figure according to their order in Appendix A.
The figure shows that 15 out of the 47 features in Appendix A do not share significant information with the class. The ten features that individually contribute to the diagnosis and share a lot of information with the class are: the position of the minute hand, angle between clock hands, correct time, ratio between hands, displacement of the minute hand from the target number, numbers within the middle area of the clock face, maximum angle between numbers, maximum size of numbers, arrows on hands, and numbers within the outer area of the clock face.
Fig.4. Amount of information which features share with the diagnosis (class label)
The ten most important features selected by the FIM method are: the position of the minute hand, maximum size of numbers, minimum size of numbers, numbers within the middle area, ratio between hands, arrows on hands, the numbers whose orientation is more than 25 degrees, maximum angle between numbers, distance between the hands intersection and the centre, and the minimum angle between the numbers. It is clear that the features selected by FIM are different from those identified by IG. As explained in Section 3, FIM selects features to build the subset one by one; the feature selected is relevant to the class and not redundant to the features already selected within the subset.
The result of the FIM method was compared with the IG result in terms of average classification accuracy (see Figure 5). The classifiers have been trained on the selected features, starting from a single feature and finishing with all 47 features. The average accuracy of FIM on a subset of 5 features is 84.59%; with 10 features the accuracy reaches the highest average accuracy, which is 86.36%. Some features share high information with the class but are not selected by the FIM method. The figure shows that the FIM method has selected a better subset in terms of its discrimination power than the one selected by the IG method: with ten features the difference in the average classification accuracy between them is 1.96 %, while when using only 5 features this difference is extended to 5.65%.
Fig.5. Average classification accuracy based on the features selected by the FIM and IG methods
5.Conclusion
This paper presents the results of research aimed at identifying the most important features (elements) in the clock drawing test for the purpose of discriminating between normal and abnormal cases. The study uses a novel approach to study the significance of the clock features (elements). The results of the experiments with 648 patient drawings indicate the ten most important features which provide a high classification accuracy. These are: the position of the minute hand, maximum size of numbers, minimum size of numbers, numbers within the middle area, ratio between hands, arrows on clock hands, the numbers with orientation more than 25 degrees, maximum angle between numbers, distance between the hands intersection and the center, and the minimum angle between the numbers.
The results also show that the FIM feature selection method, when tested with the CDT data, outperforms Information Gain, which is a popular feature selection method. That means that the features that share high individual mutual information do not necessarily provide the best subset, which has the best classification accuracy.
Future work includes research on identifying the most informative features to discriminate between different types of dementia such as Alzheimer/ vascular, normal/ functional, and normal/ Mild Cognitive Impairment (MCI).
References
[1] Knapp M., Prince M., Dementia UK- The Full Report, Alzheimer’s Society, 2005.
[2] Mittal C. , Gorthi C., Rohatgi M., Early Cogntive Impairment: Role of Clock Drawing Test. Canadian Medical Association, 2010, 67(8), 859-864.
[3] Jouk A., Tuokko H., A Reduced Scoring System for the Clock Drawing Test using a Population-Based Sample. International Psychogeriatrics, 2012, 24:11, 1738-1748.
[4] Ismail Z., Rajji T, Shulman K., Brief Cognitive Screening Instruments: an Update International, Journal Of Geriatric Psychiatry, 2010, 25, 111-120.
[5] Shulman K., Shedletsky R., Silver I.. The Challenge of Time: Clock-Drawing Cognitive Function in The Elderly. International Journal Of Geriatric Psychiatry, 1986, 1: 135-140.
[6] Freedman M., Leach L., Kaplan E., Winocur G., Shulman K., Delis D., Clock Drawing a Neuropsychological Analysis. In Clock Drawing A neuropsychological Analysis; New York Oxford University Press, 1994.
[7] Aprahamian I., Martinelli J., Neri A., Yassuda M., The Clock Drawing Test a Review of its Accuracy in Screening for Dementia, Dementia and Neuropsychologia, 2009, 3(2), 74-80.
0 5 10 15 20 25 30 35 40 45 50 0.65 0.7 0.75 0.8 0.85 0.9 X: 10 Y: 0.8636 Number of features C lassi ficat ion A ccur a cy X: 47 Y: 0.8078 X: 5 Y: 0.8459 FIM IG
[8] Lessig M., Scanlan J., Nazemi H., Borson S., Time That Tells: Critical Clock-Drawing Errors for Dementia Screening, International Psychogeriatrics, 2008, 20, 459 – 470.
[9] Mendez M., Ala T., Underwood K., Development of Scoring Criteria for the Clock Drawing Task in Alzheimer’s Disease, Journal of the American Geriatrics Society, 1992, 40, 1095 – 1099.
[10] Sunderland T., Hill J., Mellow A., Lawlor B., Gundersheimer J., Newhouse P., Grafman J., Clock Drawing in Alzheimer’s Disease: A Novel measure of Dementia Severity. Journal of the American Geriatrics Society, 1989, 37, 725– 729.
[11] Tuokko H., Hadjistavropoulos T., Miller A., Beattie L., The Clock Test: A Sensitive Measure to Differentiate Normal Elderly From those with Alzheimer Disease, Jornal of the American Geriatrics Society, 1992, 40, 579 – 584.
[12] O'Rourke N., Tuokko H., Hayden S., Beattie B. , Early Identification of Dementia: Predictive Validity of the Clock Test, Archives of Clinical Neuropsychology, 1997, Vol. 12. No. 3, 257-267.
[13] Shulman K., Gold D., Cohen C., Zucchero C., Clock-Drawing and Mental And Demenia In The Comunity: A Longitudinal Study, International Journal Of Geriatric Psychiatry, 1993, 8, 487-496.
[14] Liu, H., Sun, J., Liu, L., J., Zhang, H., Feature Selection with Dynamic Mutual Information. Pattern Recognition, 2009, 42, 1330– 1339.
[15] Guyon I., Gunn S., Nikravesh M., and Zadeh L. A., Feature Extraction Foundations and Applications; Springer Berlin Heidelberg, New York, 2006.
[16] Brown G., Pocock A., Zhao M., and Lujan M. Conditional Likelihood Maximisation: A Unifying Framework for Information Theoretic Feature Selection. Journal of Machine Learning Research, 2012, 13, 27-66.
[17] Rodgers J., Nicewander W. A., Thirteen Ways to Look at the Correlation Coefficient, The American Statistician, 1988, 42, 59-66. [18] Lin T., Li H., Tsai. Implementing the Fisher’s Discriminant Ratio in a k-Means Clustering Algorithm for Feature Selection and Data
Set Trimming, J. Chem. Inf. Comput. Sci, 2004, 44, 76-87.
[19] Duda R., Hart P., Stork D., Pattern Classification, second ed; John Wiley and Sons, New York, 2001.
[20] Guyon I., lisseeff A., An Introduction to Variable and Feature Selection. Journal of Machine Learning Research, 2003, 3, 1157–1182. [21] Battiti, R.,Using Mutual Information for Selecting Features in Supervised Neural Net Learning. IEEE Trans. Neural Networks, 1994,
5, 537–550.
[22] Kira K., Rendell L., A Practical Approach to Feature Selection. In a practical approach to feature selection, ML92 Proceedings of the Ninth International Workshop on Machine Learning, 1992, 249–256.
[23] Liu H., Motoda H., Computational Methods of Feature Selection; Chapman and Hall/CRC, Boca Raton, 2008. [24] Cover T., Thomas J., Elements of Information Theory, second ed; John Wiley & Sons, 2006.
[25] Bennasar M., Setchi R., Hicks Y., Feature Interaction Maximisation, Pattern Recognition Letters, 2013 doi: http://dx.doi.org/10.1016/j.patrec.2013.04.002
[26] Jakulin, A., Machine Learning Based on Attribute Interactions. PhD Thesis. Computer and Information Science, University of Ljubljana, 2005.
[27] Bennasar M., Setchi R., Hicks Y., Unsupervised Discretization Method Based on Adjustable Intervals, 16th International Conference on Knowledge-Based and Intelligent Information & Engineering Systems, 2012, 79-87.
Appendix A. Features extracted from the clock drawing
1. Number of numbers within area 1 (outer area). 2. Number of numbers within area 2 (middle area). 3. Number of numbers within area 3 (inner area). 4. Number of numbers within quadrant 1. 5. Number of numbers within quadrant 2. 6. Number of numbers within quadrant 3. 7. Number of numbers within quadrant 4. 8. Minimum size of the numbers mm2. 9. Maximum size of the numbers mm2.
10. Ratio between the maximum number size and minimum size. 11. Number of numbers outside the contour.
12. Minimum angle between numbers. 13. Maximum angles between numbers.
15. Number of numbers left out from the drawing. 16. Number of duplicated numbers.
17. Sequential numbers are written following 12 (13, 14, 15 …). 18. Numbers not in sequence.
19. Numbers 3 and 11 not present. 20. Arabic numbers used.
21. Direction of written numbers. 22. Self correction of numbers. 23. Minute hand is present. 24. Hour hand is present.
25. More than two hands are drawn. 26. Self correction of hands. 27. Time is correct.
28. Time is indicated by writing minute number next to the hour number or next to 11. 29. Straight line is used between the two numbers.
30. Displacement of hour hand or mark from the target number. 31. Displacement of minute hand or mark from the target number. 32. Hands connected with target number.
33. Arrows on hands.
34. Displacement of arrows less than 4mm. 35. Arrows are pointing in the wrong direction. 36. Presence of superfluous.
37. Hands are joint or within 12 mm. 38. Position of minute hand.
39. Position of hour hand. 40. Angle between clock hands. 41. Ratio between hands.
42. Presence of stem of clock hands (near to the centre) is left out. 43. Time is written across the clock.
44. Time is written outside the clock.
45. Picture of a human face is drawn on clock. 46. Presence of written words.