RESE ARCH FE ATURE
UK-based myExperiment project (www.myexperiment.org), which has collected more than 1,000 life-science work-flows.2 The advent of these online repositories makes it
possible to assess the state of scientific workflow reuse. Software engineers commonly reuse components to attain higher quality and productivity.3 Many scientific
workflow development tools such as Taverna4 similarly
allow scientists to design a workflow using available Web services, and dedicated repositories help scientists find these services. For example, BioCatalogue,5 a sister
proj-ect to myExperiment, has catalogued more than 1,600 life-science Web services. Such online repositories have opened a gateway to scientific workflow reuse.
To advance the state of the art in service-oriented sci-ence,6 we analyzed the workflows stored at myExperiment.
Applying social-network analysis techniques,7 we aimed to
answer two questions: What is the current usage pattern of services in scientific workflows, and how can this knowl-edge be extracted to facilitate reuse? Based on our study’s results, we propose a new framework named CASE— Collection, Annotation, Search, and rEcommendation— to support scientific workflow reuse.
T
o accelerate data-intensive scientific explo-ration, many disciplines including biology and biomedicine have adopted workflows as data-pipeline orchestrators and Web services as computational components. A scientific workflow precisely describes a multistep procedure to streamline a composition of tasks and the dataflow among them.1 Services-computing technology enablesscientists to expose data and computational resources as Web services so that they become publicly available to other researchers. A scientific workflow thus may utilize published Web services as tasks to speed up workflow composition. The “Scientific Workflows” and “Web Services” sidebars provide more details.
Business workflows are generally organization specific and rarely shared across company boundaries. In contrast, the scientific world is more open, and researchers often publish workflows to share experimental routines with colleagues, who can either use those workflows unchanged or compose new ones from best practices and existing ser-vice components. Several domain-specific online workflow repositories have evolved in recent years, including the
Online workflow repositories let scientists share successful
experi-mental routines and compose new workflows from best practices and
existing service components. The authors share the results of a social-
network analysis of the myExperiment workflow repository to assess
the state of scientific workflow reuse and propose the CASE framework
to facilitate such reuse.
Wei Tan, University of Chicago and Argonne National Laboratory
Jia Zhang, Northern Illinois University
Ian Foster, University of Chicago and Argonne National Laboratory
Network Analysis
of Scientific
Workflows: A
We downloaded myExperiment workflows via its REST (Representational State Transfer) API2 on
20 March 2010. We were interested only in the repository’s 599 Taverna formatted workflows; the other workflows are less structured and some are completely freestyle.
We analyzed the structure of each Taverna workflow serialized in an XML-based language. We found that 280 of the workflows contained at least one Web service and that altogether there were 118 unique services. Because our goal was to identify the current usage pattern of services in workflows, we focused on these 280 work-flows and 118 services.
We abstracted these workflows and services into a workflow-service network, an undirected graph in which nodes represent workflows or services and edges represent the inclusive re-lations between them—that is, a workflow is connected to a service if it calls the service. From this network, we derived two additional networks: a workflow-workflow network in which two workflows are connected if they comprise services in common, and a service-service network in which two services are connected if they appear in some workflow together. We used Pajek,7 a widely used
social-network analysis tool, to produce all three graphs.
Table 1 summarizes the myExperiment data-set used in our study, including some metrics of the original and derived networks.
WORKFLOW-SERVICE
RELATION AND DERIVATIONS
We parsed the myExperiment workflows to create the workflow-service relation Q, formal-ized as an m × n matrix, where m is the number of workflows (280) and n is the number of ser-vices (118):
Q = [qij], 0 ≤ i ≤ m, 0 ≤ j ≤ n,
where qij = 1 if workflow i contains service j. We derived two more relations, W and S, from
Q as follows:
W = Q ∙ QT = [w
ij], 0 ≤ i, j ≤ m,
where wij = number of services shared by work-flows i and j, and w = number of services in
A
scientific workflow precisely defines a multistep procedure to seamlessly integrate and streamline local and remote heterogene-ous computational and data resources to perform in silico scientific exploration.1 Scientific and business workflows overlap in somerequirements and features, and some tools, such as Sedna,2 adopt the
industry-standard Business Process Execution Language (BPEL) for sci-entific workflows. However, fundamental differences exist between scientific and business workflows.3 One is that the execution model of
scientific workflows is dataflow oriented, while that of their business counterpart focuses on control-flow patterns and events.4 This
differ-ence is somewhat analogous to that between procedural and functional programming.5 Consequently, many research groups have explored
various dataflow-based models and languages, resulting in several sci-entific workflow authoring and management tools including Taverna (www.taverna.org.uk), Kepler (https://kepler-project.org), and Triana (www.trianacode.org).
References
1. C. Goble and D. De Roure, “The Impact of Workflow Tools on Data-centric Research,” T. Hey, S. Tansley, and K. Tolle, eds., The Fourth Paradigm: Data-Intensive Scientific Discovery, Microsoft Research, 2009, pp. 137-145.
2. B. Wassermann et al., “Sedna: a BPEL Based Environment for Visual Sci-entific Workflow Modelling,” I.J. Taylor et al., eds., Workflows for e-Science: Scientific Workflows for Grids, Springer, 2007, pp. 428-449. 3. B. Ludäscher et al., “Scientific Workflow Management and the Kepler
System,” Concurrency and Computation: Practice & Experience, Aug. 2006, pp. 1039-1065.
4. U. Yildiz, A. Guabtni, and A.H.H. Ngu, “Business versus Scientific Work-flows: A Comparative Study,” Proc. 2009 Congress on Services (SERVICES 09), IEEE CS Press, 2009, pp. 340-343.
5. V. Curcin and M. Ghanem, “Scientific Workflow Systems—Can One Size Fit All?” Proc. 4th Cairo Int’l Biomedical Eng. Conf. (CIBEC 08), IEEE Press, 2008, pp. 1-9.
WEB SERVICES
A
Web service is a programmable Web application component that has a standard interface and is universally accessible through standard network protocols.1 In the current service-oriented scienceparadigm, technologies, components, and experimental routines are increasingly wrapped in various services. Scientists can leverage such published services to quickly compose new scientific workflows.2 A
Web service is typically accessed via the Simple Object Access Protocol (www.w3.org/TR/soap) or Representational State Transfer.3 SOAP is
more heavyweight but able to perform rigid type checking, while REST is more lightweight without extra XML markup. MyExperiment pro-vides a REST API for users to fetch stored workflows.
References
1. L.-J. Zhang, J. Zhang, and H. Cai, Services Computing, Springer, 2007. 2. C. Goble and D. De Roure, “Curating Scientific Web Services and
Work-flows,” EDUCAUSE Rev., Sep./Oct. 2008, pp. 10-11.
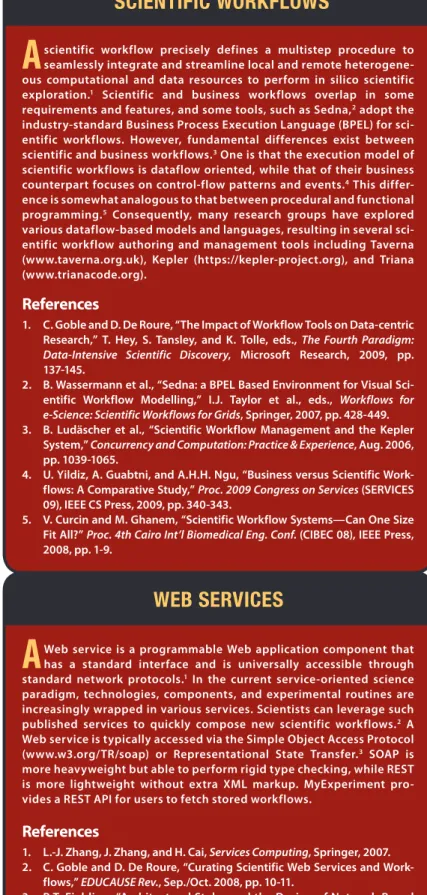
Figure 1. Workflow-service relation Q. (a) Visualization of Q with degrees. (b) Histogram of the number of services per workflow and the number of occurrences in workflows per service.
10 20 30 40 50 60 70 0 1 2 3 4 5 10
Number of occurrences in workflows15 20 30 40 50 More 50 100 150 200 250 0 1 2 3 Number of services (b) 4 5 More (a) Number of se rv ices Number of wo rkflows
RESE ARCH FE ATURE
services i and j are invoked and sii = number of workflows where service i is invoked.
Relation
Q
Q represents the 280 workflows that contain services. In the visualization of Q shown in Figure 1a, yellow
diamonds represent workflows, green circles repre-sent services, and an edge between a diamond and a circle indicates that the workflow calls the service. We performed a statistical analysis of Q, with the results summarized in Figure 1b. Most workflows contained few services (76 percent of workflows invoked only one service); no workflow contained more than four. On aver-age, each workflow that we considered consumed 1.36 services. Meanwhile, most services participated in only a few workflows (50 percent of services participated in a single workflow). Thirty-one services were called by two workflows and only four utility services by more than 20 workflows.
Degree centrality. From the dataset, we sought to identify the highly used services and workflows that invoked more services. We therefore configured Pajek such that node size represents its degree centrality or popularity—that is, the larger a node is, the more nodes
Table 1. Overview of myExperiment dataset.
Data Value
Taverna workflows with at least one Web service 280
Unique services 118
Operations 179
Average services per workflow 1.36
Average workflows per service 3.22
Average collaborators per service 1.44
Relation
W
In social-network analysis, a clique9 is a maximal
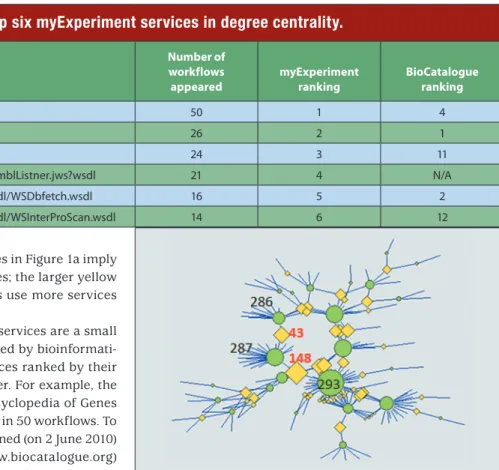
com-plete subgraph of three or more nodes, all of which are directly connected to one another. It usually represents an interest group whose members tend to have more ho-mogeneous opinions and share more common traits. In workflow-workflow relation W, two workflows (nodes) are connected if they both invoke common services. There-fore, a clique in W refers to a group of workflows that invoke common services. In other words, the group of workflows comprising a clique may share some common goals or requirements.
Figure 3 is a visualization of W, wherein each node represents a workflow, the node’s size connotes the number of services used, and the thickness of an edge indicates the number of services shared by the two workflows at both ends. The dense areas are cliques of workflows sharing common utility services. Over-lapped cliques may also imply some common interests or goals.
Relation
S
it connects to. The larger green circles in Figure 1a imply that more workflows use the services; the larger yellow diamonds imply that the workflows use more services as components.
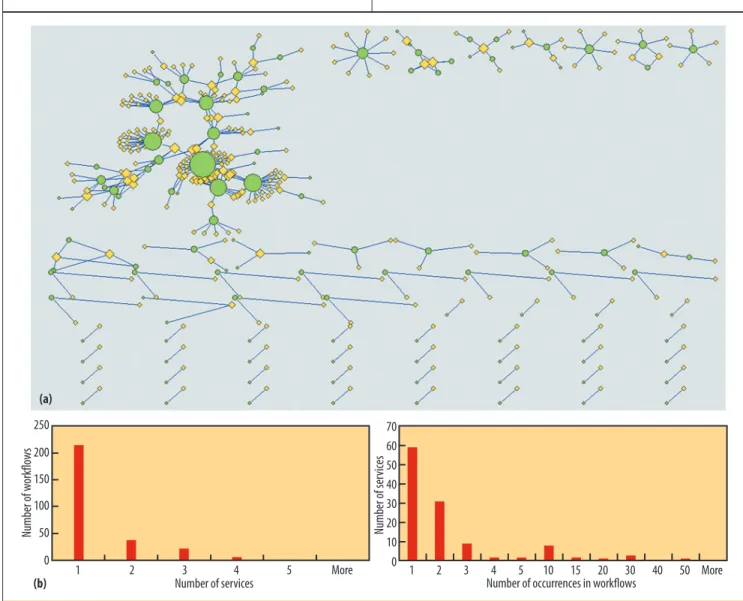
We found that the highly reused services are a small set of utility services widely employed by bioinformati-cians. Table 2 lists the top six services ranked by their degree centrality in descending order. For example, the top-ranked service is the Kyoto Encyclopedia of Genes and Genomes (KEGG), which appears in 50 workflows. To evaluate our findings, we also examined (on 2 June 2010) the six services’ BioCatalogue (www.biocatalogue.org) popularity rankings. The BioCatalogue dataset consists of 1,630 registered biology services, each with metadata, including popularity as measured by the number of times viewed. As the table shows, five of the services also have high BioCatalogue rankings (the sixth is currently inactive and thus not listed). This analysis confirmed that services frequently reused in myExperiment workflows also at-tract more interest in BioCatalogue.
Betweenness centrality. In addition to popularity, we examined how information flows through different serv-ices and workflows, aiming to identify the hinge servserv-ices or workflows in myExperiment. In social-network anal-ysis, betweenness8 is a node’s centrality measure: it
evaluates the connectivity of a node in its context, which is the number of shortest paths in the network that pass through a given node. Nodes that occur on many short-est paths between other nodes have higher betweenness than those that do not.
Figure 2 shows the largest strongly connected com-ponents in Q with betweenness centrality. For example, workflow w148 connects service s287 (Blast) with ser-vice s293 (KEGG); workflow w43 connects serser-vice s286 (EBI InterProScan) with s287. Comparing Figures 1 and 2, we find that w148 and w43 both have high between-ness values but low degree values. This indicates that
Service URL
Number of workflows
appeared myExperiment ranking BioCatalogue ranking
http://soap.genome.jp/KEGG.wsdl 50 1 4 http://xml.nig.ac.jp/wsdl/Blast.wsdl 26 2 1 http://xml.nig.ac.jp/wsdl/Ensembl.wsdl 24 3 11 http://phoebus.cs.man.ac.uk:8081/axis/EnsemblListner.jws?wsdl 21 4 N/A http://www.ebi.ac.uk/Tools/webservices/wsdl/WSDbfetch.wsdl 16 5 2 http://www.ebi.ac.uk/Tools/webservices/wsdl/WSInterProScan.wsdl 14 6 12
Figure 2. Visualization of the largest strongly connected com-ponents in Q with betweenness centrality.
RESE ARCH FE ATURE
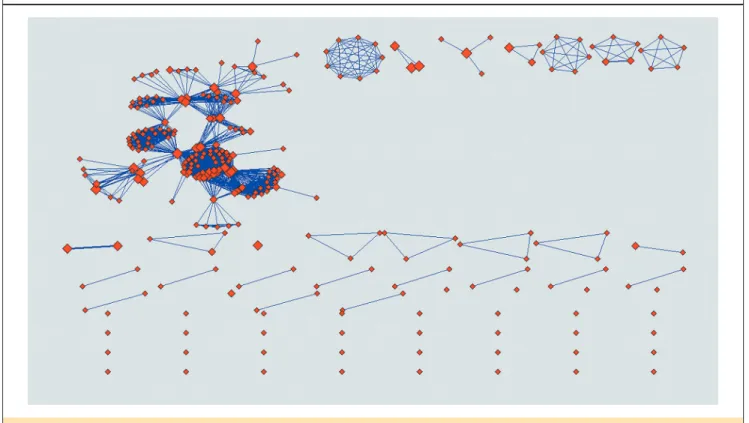
Figures 4a and 4b illustrate the degree and betweenness of S, respectively. The size of a node is proportional to its degree and its betweenness, respectively. An edge’s thick-seen as a collaboration network among services—that is,
services appearing in the same workflow collaborate with one another.
Figure 3. Visualization of workflow-workflow relation W. The dense areas indicate cliques.
Figure 4. Service-service relation S. (a) Visualization of a portion of S with degree centrality. (b) Visualization of a portion of S with betweenness centrality. (c) Histogram of the number of collaborators for services.
10 20 30 40 50 60 0 0 1 2 3 4 5
Number of collaborators6 7 8 9 10 11 More
Number of se
rv
ices
(a) (b)
Operations invocation network
To study finer-grained collaboration among services in our dataset, we zoomed in on S to the operation level. We derived a directed relation S', shown in Figure 5, by examining the invocation relations among service opera-tions. Nodes are operations in services, and a directed edge represents a data link between two operations in some workflow.
Operations in S' are grouped into weakly connected components called clusters, with each cluster assigned a unique parenthesized number. For example, at the top right corner of Figure 5, cluster 4 comprises five operations (8, 9, 34, 35, and 36). Altogether, there are 179 operations grouped in 48 clusters.
Based on S and S', we can define two levels of collabo-ration between services. The collabocollabo-ration relationship among services invoked in the same workflow in S is weak. Compared to S, S' contains operation-level information of both intra- and interworkflow invocation sequences. Thus, a strong collaboration relationship between two services implies a direct operation invocation between them in some workflow. For example, operation o35 calls o34 in one workflow and o36 in another.
ANALYSIS OF FINDINGS
ness is proportional to the number of workflows that share the two services on its ends. The figures highlight the most connected portion of S and neglect some isolated services. A service with high degree centrality collaborates with more peer services in all workflows; a service with high betweenness centrality means that service collaborations are more likely to go through it—that is, it has more control over the information flow between services. In Figure 4, for example, service s31 has relatively higher betweenness compared to its degree, while service s6 has a higher degree compared to its betweenness. (A given node’s absolute values of degree and betweenness centrality aren’t comparable, only its relative values, in a network. For example, a node may have higher degree centrality and lower betweenness centrality than other nodes in a network, and vice versa.)
To highlight the collaborative relationship among ser-vices, Figure 4c shows the distribution of the number of collaborators for services. On average, a service has only 1.44 collaborators; 54 services (46 percent) have no col-laborator at all. Most services have connections with only a couple of others.
In social-network analysis, a component is a set of net-work nodes connected by some relationship such that they are strongly connected. In this case, the largest component
RESE ARCH FE ATURE
• workflow-workflow: how mul- tiple workflows use common services; and
• service-service: how services collaborate with one another. Such knowledge embeds the best practice of using services in work-flows, and therefore is well suited to feed into a recommendation system to facilitate services-oriented work-flow reuse.
CASE FRAMEWORK FOR
WORKFLOW REUSE
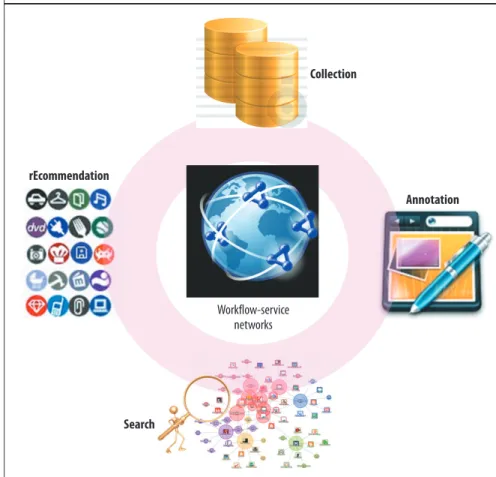
Advances in social-network anal-ysis and recommendation systems, which accumulate the wisdom of crowds, can help scientists discover relevant workflows and services and adapt them to their own ex-plorations, much as biomedical researchers use publication reposi-tories such as PubMed (www.ncbi. nlm.nih.gov/pubmed) to discover relevant findings. Toward this end, we propose the CASE framework for services-oriented scientific workflow reuse. CASE is an ongo-ing effort and, as Figure 6 shows, is centered on workflow-service networks and their associ-ated knowledge.
Collection
Workflows and services are incrementally collected from centralized repositories such as myExperiment and BioCatalogue as primary data sources. Additional informa-tion may be collected from Web servers hosting individual services, publication libraries like PubMed, websites of participating research institutions, and so on. Workflow-service networks are built and stored in CASE and serve as the information collection index that binds the four CASE components.
Annotation
Annotation (www.w3.org/2001/Annotea) is widely used to facilitate knowledge sharing. For example, Taverna lets authors annotate workflows and BioCatalogue lets users annotate services. Such volunteer-based human actions, however, may lead to fragmentary and inconsistent anno-tations scattered in disjointed resources. CASE integrates annotations generated from various heterogeneous data sources such as author annotations at different levels (for example, workflow, service, or data channels), user
com-What is the current usage pattern of services in scientific workflows? Three findings are significant:
• The use of life science services is low in myExperi-ment workflows, and only a couple of utility services are frequently used.
• Frequently used services in myExperiment workflows are also popular in BioCatalogue.
• Services used in myExperiment workflows largely function individually without collaborating with each other.
In summary, current service reuse in scientific workflows is unsatisfactory.
How can this knowledge be extracted to facilitate work-flow reuse? Our work demonstrates the effectiveness of constructing a workflow-service network and its derived networks. The usage pattern embedded in these net-works provides quantitative answers to the following four relationships:
• workflow-service: how workflows use services; • service-workflow: how services are used in different
workflows;
Figure 6. The CASE framework for workflow reuse is centered on workflow-service networks and their associated knowledge.
rEcommendation Annotation Collection Search Workflow-service networks
community, sponsored by the National Cancer Institute, for various application scenarios motivating our net-work analysis and CASE framenet-work. We thank Carole Goble and David De Roure for supporting our assess-ment of Taverna, myExperiassess-ment, and BioCatalogue. We also thank Ravi Madduri for constructive discussions on workflow reuse in caBIG. The work described in this article is partially supported by the National Cancer Insti-tute, the National Institutes of Health under contract N01-CO-12400, and the National Science Foundation under grant IIS-0959215.
References
1. I.J. Taylor et al., eds., Workflows for e-Science: Scientific
Workflows for Grids, Springer, 2007.
2. C.A. Goble et al., “myExperiment: A Repository and Social Network for the Sharing of Bioinformatics Workflows,”
Nucleic Acids Research, 25 May 2010, pp. W677-W682.
3. T. Xie et al., “Data Mining for Software Engineering,”
Com-puter, Aug. 2009, pp. 55-62.
4. T. Oinn et al., “Taverna: Lessons in Creating a Workflow
Environment for the Life Sciences,” Concurrency and
Com-putation: Practice & Experience, Aug. 2006, pp. 1067-1100. 5. J. Bhagat et al., “BioCatalogue: A Universal Catalogue of
Web Services for the Life Sciences,” Nucleic Acids Research,
19 May 2010, pp. W689-W694.
6. I. Foster, “Service-Oriented Science,” Science, 6 May 2005,
pp. 814-817.
7. W. de Nooy, A. Mrvar, and V. Batagelj, Exploratory Social
Network Analysis with Pajek, Cambridge Univ. Press, 2005. 8. Y.-L. Luo and C.-H. Hsu, “An Empirical Study of Research
Collaboration Using Social Network Analysis,” Proc. 2009
Int’l Conf. Computational Science and Eng. (CSE 09), vol. 4, IEEE CS Press, 2009, pp. 921-926.
9. G. Groh and V. Rappel, “Towards Demarcation and Mod-eling of Small Sub-Communities/Groups in P2P Social
Networks,” Proc. 2009 Int’l Conf. Computational Science
and Eng. (CSE 09), vol. 4, IEEE CS Press, 2009, pp. 304-311.
Wei Tan is a research professional associate at the Computa-tion Institute, a joint institute of the University of Chicago and Argonne National Laboratory. Contact him at wtan@ mcs.anl.gov.
Jia Zhang is an associate professor in the Computer Science Department at Northern Illinois University. Contact her at [email protected].
Ian Foster is director of the Computation Institute. He is also a senior scientist and Distinguished Fellow at Argonne Na-tional Laboratory as well as Chan Soon-Shiong Scholar and Arthur Holly Compton Distinguished Service Professor in the Department of Computer Science at the University of Chicago.
larity and usage patterns. To ensure performance, such annotations are stored independently of corresponding workflows and services. Automatic annotation elicitation, generation, and analysis instruments support services-oriented scientific workflow discovery, composition, and adaptation.
Search
CASE uses Apache Lucene (http://lucene.apache.org), an open source search engine, to index the information collection and associated annotations. Users can carry out full-text search to find artifacts of interest. In addition, the workflow-service networks support relation-aware search. For example, relation W can be used to locate workflows providing similar functions, and relation S' to predict a given operation’s most likely next step. An interactive GUI lets users visualize the search interface and results to navi-gate through the artifacts, zoom into details, or zoom out to global connections.
Recommendation
CASE’s ultimate goal is to provide recommendation sup-port in workflow composition. When a scientist is building a workflow in some integrated development environment, the CASE recommendation plug-in for this IDE observes the context, such as the user’s profile and the incomplete workflow. The plug-in then communicates with the rec-ommendation component in CASE and offers relevant suggestions. Examples include a collection of related ser-vices (referring to relation Q), a sequence of operations in a newly added service (referring to relation S'), a workflow snippet to produce a data object given the existing data objects in the incomplete workflow, and so on. Recom-mendation can be either passive (requested explicitly by users) or proactive (automatically delivered when CASE perceives such a need).