ON PARAMETER ESTIMATION AND VALIDATION OF DENGUE EPIDEMIC IN TANZANIA
*
,1MassaweLaurencia Ndelamo,
1
Faculty of Science, Technology and Environmental Studies
2
Mathematics Department, University of Dar es salaam, P.O. Box 35062, Dar es Salaam, Tanzania
3Faculty of Military Science, Stellenbosch University, Private Bag X2, Saldanha 7395, South Africa
ARTICLE INFO ABSTRACT
Discovery of a dengue outbreak early is
interventions resulting in reduced mortality and morbidity. A dengue mathematical model is useful tool for prediction of an outbreak and evaluation of control measures. However, such a model must be care
of health and social welfare in Tanzania are used to analyse various parameters of dengue transmission and outbreak model
and 2015 data from ministry of health and social welfare in Tanzania, number of dengue cases obtained in the year 2010 to 2015 are used as independent variable (observed data). Accuracy of the model for predicting outbreak is asses
obtained for Tanzania to be used as a predictive model to predict possible outbreak. Numerical simulations are performed to fit the model to available data for dengue fever disease in Tanzania a to determine the role played by some key parameters.
forecasted dataagree very close to the actual data.
Copyright © 2015 MassaweLaurencia Ndelamo et al. This
unrestricted use, distribution, and reproduction in any medium, provided the original work is properly cited.
INTRODUCTION
The dengue virus is the one of the arboviruses causes of classical dengue fever and dengue haemorrhagic fever primarily in the tropical and subtropical regions. Dar es Salaam city in Tanzania with the tropical climate has become an ideal region for dengue virus transmission (Karim
Dengue remains a serious threat for human health in Tanzania, as an effective dengue vaccine and anti-viral treatment are not currently available. Dengue control relies on controlling vectors of the disease, the mosquitoes Aedes aegypti. presence of Aedes aegypti mosquito was first identified in Dar es Salaam city in Tanzania followed by few regions in the year 2014.
In July 2010 for the first time in Tanzania, an outbreak of dengue fever was reported and over 40 people were infected. From 2010 to 2015 number of infected cases has been increasing. Moreover in the year 2014 the government of Tanzania announced the danger of the disease where people were alerted about the disease and the precaution to be taken. In the year 2014 between January and December and January
*Corresponding author: MassaweLaurencia Ndelamo Faculty of Science, Technology and Environmental Studies University of Tanzania, Dar es Salaam, Tanzania
ISSN: 0975-833X
Article History: Received 24th July, 2015
Received in revised form 15th August, 2015
Accepted 07th September, 2015 Published online 31st October,2015
Key words:
Dengue fever, Data, Outbreak, Prediction model, Forecasted, observed, Correlation, Ministry of health and social welfare in Tanzania.
Citation: MassaweLaurencia Ndelamo, Massawe Estomih, S. and MakindeOluwole Daniel, of dengue epidemic in Tanzania”, International Journal of Current Research
RESEARCH ARTICLE
ON PARAMETER ESTIMATION AND VALIDATION OF DENGUE EPIDEMIC IN TANZANIA
MassaweLaurencia Ndelamo,
2Massawe Estomih, S. and
3MakindeOluwole Daniel
Science, Technology and Environmental Studies, The Open University of Tanzania,
Dar es Salaam, Tanzania
Mathematics Department, University of Dar es salaam, P.O. Box 35062, Dar es Salaam, Tanzania
cience, Stellenbosch University, Private Bag X2, Saldanha 7395, South Africa
ABSTRACT
Discovery of a dengue outbreak early is the major step towards implementing effective dengue interventions resulting in reduced mortality and morbidity. A dengue mathematical model is useful tool for prediction of an outbreak and evaluation of control measures. However, such a model must be carefully parameterized and validated with epidemiological data. Data obtained from the ministry of health and social welfare in Tanzania are used to analyse various parameters of dengue transmission and outbreak model. Validation of the model is done with 201
and 2015 data from ministry of health and social welfare in Tanzania, number of dengue cases obtained in the year 2010 to 2015 are used as independent variable (observed data). Accuracy of the model for predicting outbreak is assessed through coefficient of determination
obtained for Tanzania to be used as a predictive model to predict possible outbreak. Numerical simulations are performed to fit the model to available data for dengue fever disease in Tanzania a to determine the role played by some key parameters. From the results, it is observed that the forecasted dataagree very close to the actual data.
This is an open access article distributed under the Creative Commons Att use, distribution, and reproduction in any medium, provided the original work is properly cited.
The dengue virus is the one of the arboviruses causes of classical dengue fever and dengue haemorrhagic fever primarily in the tropical and subtropical regions. Dar es Salaam city in Tanzania with the tropical climate has become an ideal virus transmission (Karim et al., 2012). Dengue remains a serious threat for human health in Tanzania, viral treatment are not currently available. Dengue control relies on controlling Aedes aegypti. The was first identified in Dar es Salaam city in Tanzania followed by few regions in the year
In July 2010 for the first time in Tanzania, an outbreak of 0 people were infected. From 2010 to 2015 number of infected cases has been increasing. Moreover in the year 2014 the government of Tanzania announced the danger of the disease where people were alerted about the disease and the precaution to be taken.
the year 2014 between January and December and January
MassaweLaurencia Ndelamo,
Science, Technology and Environmental Studies, The Open
to April 2015, 1025 people were
disease and 4 died of the disease from Dar es Salaam city. The regions which were affected with Dengue fever disease are Dar es Salaam with 1014 cases (Kinondoni
Ilala-269), Kigoma3, Mwanza2, Mbeya2, Kilimanj
Njombe1. Data from the ministry of health and social welfare in Tanzania are used to validate the proposed model.
Maximum likelihood estimator is used to determine the best fitting model. The idea is to have a parsimonious model that captures as much variation in the data as possible (Ngailo 2014).The accuracy of model is judged based on explanatory capacity (coefficient of determination, R square). The number of cases that would occur (forecasted) in Tanzania in the year 2010 to 2015 will be predicted with the regression equation obtained from the best-fit model and later on compare the number of cases that are actually obtained in those years. Pearson correlation coefficient is obtained to see the strength of correlation. Coefficient of determination is used to predict the correlation between the data obtain from the ministry of health and social welfare in Tanzania and data from the literature (Karim et al., 2012; Rohani
paper will forecast Dengue fever square curve fitting method.
Available online at http://www.journalcra.com
International Journal of Current Research Vol. 7, Issue, 10, pp.21720-21724, October, 2015
INTERNATIONAL
MassaweLaurencia Ndelamo, Massawe Estomih, S. and MakindeOluwole Daniel, 2015. “On parameter estimation and validation
International Journal of Current Research, 7, (10), 21720-21724.
z
ON PARAMETER ESTIMATION AND VALIDATION OF DENGUE EPIDEMIC IN TANZANIA
MakindeOluwole Daniel
, The Open University of Tanzania,
Mathematics Department, University of Dar es salaam, P.O. Box 35062, Dar es Salaam, Tanzania
cience, Stellenbosch University, Private Bag X2, Saldanha 7395, South Africa
the major step towards implementing effective dengue interventions resulting in reduced mortality and morbidity. A dengue mathematical model is useful tool for prediction of an outbreak and evaluation of control measures. However, such a model must fully parameterized and validated with epidemiological data. Data obtained from the ministry of health and social welfare in Tanzania are used to analyse various parameters of dengue . Validation of the model is done with 2010, 2011, 2012, 2013 2014 and 2015 data from ministry of health and social welfare in Tanzania, number of dengue cases obtained in the year 2010 to 2015 are used as independent variable (observed data). Accuracy of the sed through coefficient of determination. A well fit model is obtained for Tanzania to be used as a predictive model to predict possible outbreak. Numerical simulations are performed to fit the model to available data for dengue fever disease in Tanzania and From the results, it is observed that the
Creative Commons Attribution License, which permits
to April 2015, 1025 people were infected with dengue fever disease and 4 died of the disease from Dar es Salaam city. The regions which were affected with Dengue fever disease are Dar es Salaam with 1014 cases (Kinondoni-601, Temeke-144, and 269), Kigoma3, Mwanza2, Mbeya2, Kilimanjaro3, and Data from the ministry of health and social welfare in Tanzania are used to validate the proposed model.
Maximum likelihood estimator is used to determine the best The idea is to have a parsimonious model that much variation in the data as possible (Ngailo et al., 2014).The accuracy of model is judged based on explanatory capacity (coefficient of determination, R square). The number of cases that would occur (forecasted) in Tanzania in the year l be predicted with the regression equation fit model and later on compare the number of cases that are actually obtained in those years. Pearson correlation coefficient is obtained to see the strength of determination is used to predict the correlation between the data obtain from the ministry of health and social welfare in Tanzania and data from the literature ., 2012; Rohani et al., 2011). In particular this paper will forecast Dengue fever infected cases using least INTERNATIONAL JOURNAL OF CURRENT RESEARCH
MATERIALS AND METHODS
Model formulations
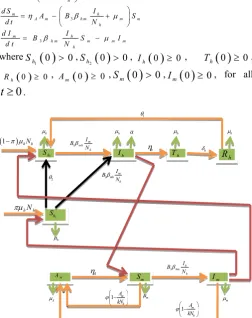
In this section, we adopt the model presented in (Rodrigues et al., 2013).The model based on two populations, humans and
mosquitoes with treatment, Human population
N
h is dividedinto five groups such as 1
h
S
- Careful human Susceptibles, 2h
S
- Careless human Susceptibles ,
I
h- infected human,T
h-treated infected human ,Rh - recovery infected human, so that
we have
1 2
h h h h h
N
S
S
I
T
R
and the population offemale mosquitoes, indexed by
m
is divided into three groupsthat is
A
m-Aquatic phase (that includes the egg, larva and pupastages),
S
m-Susceptibles (mosquitoes that are able to contractthe disease),
I
m-Infectives (mosquitoes capable of transmitting the disease to human). In formulating the model, the following assumptions are considered: Total human population
N
h is constant, The population is homogeneous, which means that every individual of a compartment is homogeneously mixed with the other individuals,
Immigration and emigration are not considered, Each vector has an equal probability to bite any host, Humans and mosquitoes are assumed to be born
susceptible i.e. there is no natural protection,
The coefficient of transmission of the disease is fixed and does not vary seasonally,
For the mosquito there is no resistant phase, due to its short lifetime,
The possibility of careless Susceptibles contracting dengue fever disease is higher than that for careful Susceptibles.
Susceptible individuals acquire Dengue fever through the bite of female Aedes mosquito with force of infections given by
1 1 m mh h h
I
B
S
N
, 2 2 m mh h hI
B
S
N
and 1 3 h hm h h I B S N
with2
> .
1B
B
Considering the above considerations and assumptions, we then have the following schematic model flow diagram for dengue fever disease with treatment, careful and careless susceptible:
From the above flow diagram, the model will be governed by the following equations:
1
1 1 2
1 1 2
1
h m
h h m h h h h h h h
d S I
N B S S R S
d t N
2
2 2 2
2 2
h m
h h m h h h h h h
d S I
N B S S S
d t N
1 1 2 2
h m
h h m h h h h
h
d I I
B S B S a I
d t N
h
h h h h h
d T
I T
d t (1)
1
h
h h h h
d R
T R
d t
1
m m
m m A A m h
d A A
S I A
d t k N
3
m h
A m h m m m
h
d S I
A B S
d t N
3
m h
h m m m m
h
d I I
B S I
d t N
where
1 0 0
h
S ,
2 0 0
h
S , Ih
0 0 , Th
0 0,
0 0h
R , Am
0 0,Sm
0 0,Im
0 0, for all0
[image:2.595.307.560.121.440.2]t
.Figure 1. Model flow diagram for dengue fever disease with treatment, careful and careless susceptible
Data Analysis
In this subsection, we adopt the idea of Ngailo et al. (2014) where the work is dedicated to fitting the predicted data of the models to the Tanzania data obtained from the ministry of health and social welfare in Tanzania and (http://www.wavuti. com/2014/05/wizara – ya –afya -kitengo- cha.html).
Parameters values were estimated by using maximum likelihood estimator so as to get the best fit between the computed and observed data. Statistical test is carried out in order to establish the relationship between forecasted and observed data using SPSS.
RESULTS
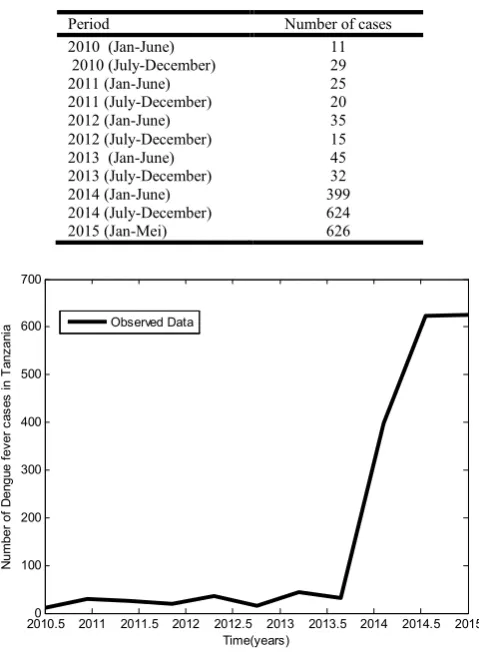
The original data set consist of 5years observations of the Tanzania dengue fever disease cases from January 2010 to April 2015 in six month interval as shown in Table 1.
1 h S 2 h S h I m I h R h T m S m A hNh
1 hNh
m
h
h
A
m
h
h
1
2
1mh m h I B N 2 m mh h I B N a 1 m h A kN 1 m h A kN A 3 h hm h I B N h
h
h
Table 1. Dengue fever cases which occurred between 2010-2014, semi-annually
Period Number of cases
2010 (Jan-June) 11
2010 (July-December) 29
2011 (Jan-June) 25
2011 (July-December) 20
2012 (Jan-June) 35
2012 (July-December) 15
2013 (Jan-June) 45
2013 (July-December) 32
2014 (Jan-June) 399
2014 (July-December) 624
2015 (Jan-Mei) 626
Figure 2. Raw data of dengue fever disease cases in Tanzania
From Figure 2, it is observed that the number of infected population is increasing as time goes.
Model Estimation and Evaluation
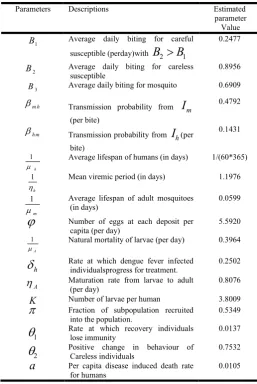
Maximum likelihood estimation is used to determine the best fitting of the model. The idea is to have a parsimonious model that captures as much variation in the data as possible. Usually the simple graph model captures most of the variability in most stabilized data (Ngailo et al., 2014). We use model system (1) to the observed data on dengue fever disease in Tanzania. The model system (1) is fitted to the data for infected individuals in Tanzania. Parameter values were obtained from the different literatures like (Rodrigue et al., 2013; Massawe et al., 2015; Dumont et al., 2008). Other parameter values are estimated to vary within realistic means and given as shown below:
0.375
hm
,m h 0 .3 9, 0 .9 6,B1 0 .0 9,2 0 .9
B ,B3 0 .7, 1
1 1
m
,k 3,A 0 . 3 5,
0 .2 5
A
, 1
3 6 5
h
, 1 / 3
h
, 4, 1 0 .0 1,
2 0 . 6
,a 0 .0 0 5,
h 0.9.Figure 3 shows the dynamic behaviour of predicted and observed data using model system (1) and actual data respectively
Figure 3. The dynamic behaviour of predicted and observed data using model system (1) and actual data respectively
From Figure 3 it is observed that, many actual data values lie within the limits. Few lie exactly, meaning that the predicted data is agree very closely to the actual data.
Parameters values were estimated by using maximum likelihood estimator so as to get the best fit between the computed and observed data and obtain the following parameter values as shown in Table 2.
For the purpose of management and planning of dengue fever disease in Tanzania it is important to project of prevalence of the disease in five years to come of the model. The model projects that there will be an increase on prevalence of dengue fever diseasein Tanzania. The same parameter values are used from Table 2.
Figures 4 show the projection of Dengue fever disease infected population in the society of Tanzania up to 2020.
Figures 4. The projection of Dengue fever disease infected population in the society
2010.50 2011 2011.5 2012 2012.5 2013 2013.5 2014 2014.5 2015 100
200 300 400 500 600 700
Time(years)
N
umb
er
of
D
en
gu
e
fev
er
c
a
s
e
s
in
T
a
nz
an
ia Observed Data
2010 2010.5 2011 2011.5 2012 2012.5 2013 2013.5 2014 2014.5 20150 100
200 300 400 500 600 700 800
Time(year)
D
e
n
g
u
e
f
e
v
e
r
d
is
e
a
s
e
in
fe
c
te
d
h
u
man
p
o
p
u
la
tio
n Observed data
Predicted data
20100 2011 2012 2013 2014 2015 2016 2017 2018 2019 2020 100
200 300 400 500 600 700 800
Time(year)
D
e
n
gu
e
f
e
v
e
r
d
is
ea
s
e
in
fe
c
te
d
h
u
m
a
n
p
op
u
lat
io
n Predicted data
[image:3.595.311.556.103.295.2]Table 2. Parameter values that give the best fit to the data in the model
From Figure 4, it is observed that the disease increase slightly at the beginning and increase sharply. This indicates that the application of treatment only is not enough. There is a need to educate society on how to get rid of the disease by using mosquito nets, mosquito repellent, removing vector breeding areas, insecticide application and control maturation rate to adult mosquito. Statistical test is carried out in order to establish the relationship between forecasted and observed data using SPSS.
Summary for statistics for Tanzania’s semiannually observed data is as shown in Table 3 and 4.
Table 3. Summary for statistics for Tanzania’s semiannually observed data
Model R R
Square
Adjusted R Square
Std. Error of the Estimate
1 0.921a 0.848 0.831 97.789
a. Predictors: (Constant), Observed Data
From Table 3 it is observed that coefficient of correlation (R) is +0.921 indicate that there is strong relationship between
[image:4.595.309.556.168.237.2]predicted and observed data as it takes the value between +1 and -1 so +0.921 is close to +1. Coefficient of determination (R Square) is +0.848 showing that there is strong relationship between Predicted and Observed data as it takes the value between 0 and +1 so +0.848 is close to +1. Therefore 85% of the total variability of the predicted data supports the observed data of the model.
Table 4. Coefficientsa
Model Unstandardized
Coefficients
Standardized Coefficients
t
P-value
B Std. Error Beta
1 (Constant) Observed Data
6.195 0.870
36.088
0.123 0.921
0.172 7.075
0.868 0.000
a. Dependent Variable: Predicted Data
From Table 4,
p<0.05
and then the coefficients in column B which help to predict the model, we havePredicted data
6.195
0.870 Observed data
.This implies that the predicted data increases by 0.870 for every unit increase in the observed data.DISCUSSION
In this paper, A compartmental model for Dengue fever disease was presented; based on two populations, humans (with temporary immunity, careful and careless susceptible) and mosquitoes with treatment. Modelling was examined with a special application to modelling dengue fever disease data in Tanzania. In particular, the least squire curve fitting analysis was explored and applied to the data from January 2010 to April 2015. The best fitting model based on how well the model captures the data. From the results, it is observed that the forecasted data agree very closely to the actual data.
Moreover statistical test is carried out in order to establish the relationship of forecasted and observed data. A statistical test showed significant correlation between predicted and observed number of cases in 2010-2015 (R =0.921, R square=0.848). Furthermore the correlation was significant.
Predicted data
6.195
0.870
Observed data
, meaning that if observed data is increases by one, the model predict that, the predicted data increases by 0.870, so model was found to be valid since the statistic assumption is satisfied.Conflict of interest
None.
REFERENCES
Dumont, Y., Chiroleu, F. and Domerg, C. 2008. “On a temporal model for the Chikungunya disease: modelling, theory and numerics,” Mathematical Biosciences, 213: 80– 91.
Karim, Md.N., Munshi, S.U., Anwar, N. and AlamMd.S.2012.Climatic factors influencing dengue cases in Dhaka city: a model for dengue prediction. Indian J Med Res., 136: 32-39
Parameters Descriptions Estimated
parameter Value
1
B Average daily biting for careful
susceptible (perday)with
B
2
B
10.2477
2
B Average daily biting for careless
susceptible
0.8956
3
B Average daily biting for mosquito 0.6909
m h
Transmission probability from
m
I
(per bite)
0.4792
h m
Transmission probability from
h
I
(per bite)0.1431
1
h
Average lifespan of humans (in days) 1/(60*365)
1
h
Mean viremic period (in days) 1.1976
1
m
Average lifespan of adult mosquitoes (in days)
0.0599
Number of eggs at each deposit percapita (per day)
5.5920
1
A
Natural mortality of larvae (per day) 0.3964
h
Rate at which dengue fever infectedindividualsprogress for treatment.
0.2502
A
Maturation rate from larvae to adult(per day)
0.8076
K Number of larvae per human 3.8009
Fraction of subpopulation recruitedinto the population.
0.5349
1
Rate at which recovery individuals lose immunity 0.01372
Positive change in behaviour of Careless individuals 0.7532a
Per capita disease induced death ratefor humans
Massawe, L.N., Massawe, E.S. and Makinde, O.D.2015.Temporal model for dengue disease with treatment. Advances in Infectious Diseases, 5: 21-36 Ngailo, E., Luvanda, E. and Massawe, E.S. 2014. Time Series
Modelling with Application to Tanzania Inflation Data.
Journal of Data Analysis and Information Processing, 2: 49-59.
Rodrigues, H.S., Monteiro, M.T.T. and Torres, D.F.M. 2013. Sensitivity Analysis in a Dengue Epidemiological Model.
Conference Papers in Mathematics, 1-7
Rohani, A., Suzilah, I., Malinda, M., Anuar, I., Mohd Mazlan, I., Maszaitun, S.M., Topek, O., Tanrang, Y., Ooi, S.C., Rozilawati, H. and Lee, H.L.2011.Aedes larval population dynamics and risk for dengue epidemics in Malaysia.
Tropical Biomedicine, 28: 237–248