http://www.scirp.org/journal/jbise J. Biomedical Science and Engineering, 2019, Vol. 12, (No. 3), pp: 212-224
https://doi.org/10.4236/jbise.2019.123015 212 J. Biomedical Science and Engineering
Automated Exudates Detection in Retinal Fundus Image
Using Morphological Operator and Entropy Maximization
Thresholding
G. H. Kom1,2, B. C. Wouantsa Tindo1,3, J. R. Mboupda Pone1,2, A. B. Tiedeu2,4
1Research Unit of Automation and Applied Informatics (URAIA), Department of Electrical Engineering, IUT-FV Bandjoun, University of Dschang, Bandjoun, Cameroon; 2Research Group on Medical Technologies Applied to the Tropics (GRETMAT), Laboratory of Electronics and Signal Processing (LETS), ENSP, University of Yaoundé I, Yaoundé, Cameroon; 3Research Unit for Condensed Matter, Electronics and Signal Processing (LAMACETS), Department of Physics, University of Dschang, Dschang, Cameroon; 4Signal Image and Systems Laboratory, Ebolowa, Cameroon
Correspondence to: G. H. Kom,
Keywords: Diabetic Retinopathy, Retinal Fundus Image, Exudates, Entropy Maximization, Thresholding Received: February 10, 2019 Accepted: March 17, 2019 Published: March 20, 2019 Copyright © 2019 by authors and Scientific Research Publishing Inc.
This work is licensed under the Creative Commons Attribution International License (CC BY 4.0). http://creativecommons.org/licenses/by/4.0/
ABSTRACT
Blindness which is considered as degrading disabling disease is the final stage that occurs when a certain threshold of visual acuity is overlapped. It happens with vision deficiencies that are pathologic states due to many ocular diseases. Among them, diabetic retinopathy is nowadays a chronic disease that attacks most of diabetic patients. Early detection through automatic screening programs reduces considerably expansion of the disease. Exudates are one of the earliest signs. This paper presents an automated method for exudates detection in digital retinal fundus image. The first step consists of image enhancement. It focuses on histogram expansion and median filter. The difference between filtered image and his in-verse reduces noise and removes background while preserving features and patterns related to the exudates. The second step refers to blood vessel removal by using morphological op-erators. In the last step, we compute the result image with an algorithm based on Entropy Maximization Thresholding to obtain two segmented regions (optical disk and exudates) which were highlighted in the second step. Finally, according to size criteria, we eliminate the other regions obtain the regions of interest related to exudates. Evaluations were done with retinal fundus image DIARETDB1 database. DIARETDB1 gathers high-quality medical images which have been verified by experts. It consists of around 89 colour fundus images of which 84 contain at least mild non-proliferative signs of the diabetic retinopathy. This tool provides a unified framework for benchmarking the methods, but also points out clear
https://doi.org/10.4236/jbise.2019.123015 213 J. Biomedical Science and Engineering
ciencies in the current practice in the method development. Comparing to other recent methods available in literature, we found that the proposed algorithm accomplished better result in terms of sensibility (94.27%) and specificity (97.63%).
1. INTRODUCTION
Diabetes is among number of diseases that involve problems with the hormone insulin. It is a group of metabolic disorders in which there are high blood sugar levels over extended period. Diabetes is a well known pathology and may cause abnormalities in the retina (diabetic retinopathy), kidneys (diabetic nephropathy), and nervous system (diabetic neuropathy) and is known to be a major risk for cardiovascu-lar diseases.
One of the most common conditions of diabetes, in both type I and type II patients is Diabetic Reti-nopathy (DR). Diabetic retiReti-nopathy is a microvascular complication caused by diabetes which can lead to blindness. In early stages of diabetic retinopathy typically there are no visible signs but the number and severity of abnormalities increase during the time. Diabetic retinopathy typically starts with small changes in retinal capillaries.
DR is an eye disease caused by the increase in insulin in blood and the leading cause of blindness ([1,
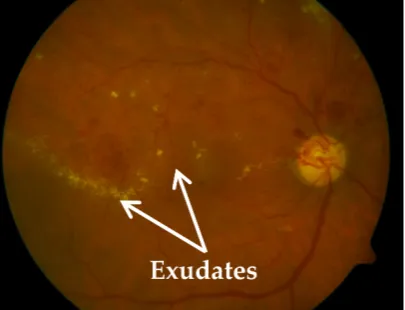
2]). It is a severe eye disease that affects many diabetic patients. It remains one of the leading causes of blindness and vision defects in developed countries [3]. Diabetic retinopathy is characterized by the de-velopment of retinal microaneurysms, haemorrhages and exudates ([4, 5]). Retinal exudates appear as spa-tially random yellow pathologies with varying sizes and shapes as shown in Figure 1. Exudates are one of the earliest signs of DR [6]. Early detection and treatment of this pathology are essential to prevent vision loss. The problems in accurately detecting exudates in fundus images are noise presence, low contrast, un-even illumination, and color variation [7]. Manual reading is very time consuming and because of the large number of normal patients in the screening programs, ophthalmologists need adequate technical know-how to diagnose symptoms of DR especially at an early stage of development when proper treat-ment is adequate although they may miss some subtle symptoms.
Given the devastating nature of diabetic retinopathy and the difficulties that patch is diagnosed, it would be interesting to move to an automatic diagnosis; this will allow the ophthalmologist to avoid false diagnosis. Thus, several methods of automatic detection of exudates in retinal fundus images have been developed.
1.1. Related Works
[image:2.595.198.401.546.701.2]In the corresponding literature for automate exudates detection, a large number of exudates detection
https://doi.org/10.4236/jbise.2019.123015 214 J. Biomedical Science and Engineering
algorithms have been proposed. Mostly, exudates segmentation and detection schemes are classified into four main groups: 1) Region growing, 2) Mathematical morphology based, 3) Threshold based, and 4) Machine Learning based algorithms [6]. Furthermore, we can find some special approaches falling out of these groups.
Welfer et al. [8] proposed an exudate detection method based on mathematical morphology. First, the images were subjected to contrast enhancement in Luv colour space. Then a set of morphological opera-tions such as regional minima detection, morphological reconstruction and H-maxima transform were performed to detect exudates. Harangi and Hajdu [9] employed an approach based on mathematical morphology and active contours. In this method, the exudate candidates were created using morphological operators. The exudates borders were detected by applying an active contour model, and a Naïve-Bayes classifer is applied to remove the false exudate candidates. Imani and Pourreza [10] presented an automat-ic method for the detection of retinal exudates. This method lies in the use of Morphologautomat-ical Component Analysis (MCA) algorithm to separate lesions from normal retinal structures to facilitate the detection process. In the first stage, vessels are separated from lesions using the MCA algorithm with appropriate dictionaries. Then, the lesion part of retinal image is prepared for the detection of exudate regions. The final exudate map is created using dynamic thresholding and mathematical morphologies. In [4], the au-thors proposed a method that can be divided into four stages: elimination of the optic disk, correction of brightness, segmentation of exudates and elimination of the background. To eliminate the optic disk from original image, the authors use active contour method. In the process of exudate segmentation, the authors use the algorithm introduced by Comaniciu and Meer [11], called Mean-shift segmentation. Entropy maximization is finally applied to separate the segmented exudates from background. Despite several ap-proaches developed for automatic detection of retinal exudates, they have not achieved sufficient perfor-mance (sensitivity and specificity) and the majority of these methods were tested in independent databases with different characteristics. Therefore, it is not possible to prove the approaches’ capacity to generalize. The approach developed in this paper does not require prior elimination of optic disk, even if it has an attribute similarity with those of exudates in terms of color and brightness. This method improves per-formances of algorithms mentioned above and more particularly those based on entropy maximization thresholding. This paper is organized as follows. The dataset used for experimental result are described in Subsection 1.2. Section 2 describes the proposed method. Section 3 present evaluation results, comparison with existing approaches and discussions. Finally, in Section 4 conclusions are given.
1.2. Database Description
For this study, images were taken from a public dataset namely DIARETDB1. DIARETDB1 [12] were used for evaluating and benchmarking diabetic retinopathy detection algorithms during experimental stu-dies. They contain digital images of eye fundus and expert annotated ground truth for several well-known diabetic fundus lesions (hard exudates, soft exudates, microaneurysms and hemorrhages). The original images and the raw ground truth are both available. Annotations of lesion were done by independent markings of 4 medical experts (a person with medical education and solid experience in ophthalmology was considered as an expert). Each image was available in digital form of size 1500 × 1152 with 24 bits per pixel resolution and was taken at 50 degree field-of-view digital fundus camera.
The dataset DIARETDB1 (Standard Diabetic Retinopathy Database Calibration, level 1) consists of 89 color retinal fundus images out of which 84 contain at least mild non-proliferative signs of the diabetic retinopathy and 5 were considered as normal, not containing any signs of DR based on mean visual ob-servation score. The ground truth result provided along with the database was based on expert selected findings relating to DR and normal fundus structures.
https://doi.org/10.4236/jbise.2019.123015 215 J. Biomedical Science and Engineering
microaneurysms, and 18 hemorrhages. Note that a single image may contain several finding types.
2. METHODS
2.1. Overall Scheme
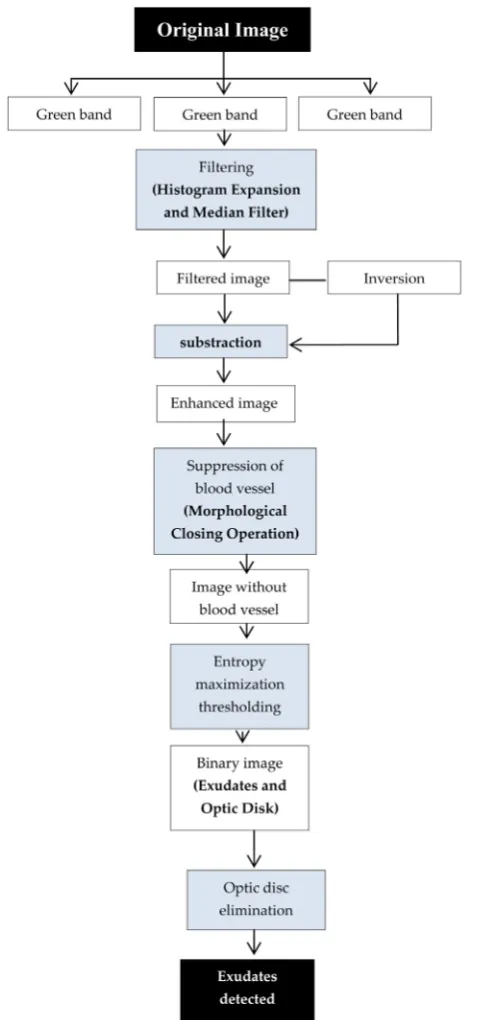
[image:4.595.180.423.189.700.2]In this section, the details of the method we used for diabetic retinopathy detection is discussed. Ex-udates usually appear in retinal fundus photographs as yellow-white patches with sharp margins and dif-ferent shapes [3]. The schematic workflow of the proposed method is shown in the Figure 2.
https://doi.org/10.4236/jbise.2019.123015 216 J. Biomedical Science and Engineering
Retinal digitized fundus image acquired by ophthalmologist which is the original RGB (truecolor) image is first converted into gray-scale image (Red, Green and Blue). Then, the method attempt to detect exudates is applied on green band image obtained below. The rest consists of two mains steps. The first step is the continuation of preprocessing which is done by applying histogram expansion and median fil-ter. Then difference between the filtered image and his inverse yielded to the enhanced image. The second step begins by morphological closing operation which is applied on the enhanced image to suppress blood vessels. This is follow by the segmentation of exudates and optic disk by entropy maximization. Finally, base on size criteria, optic disk is eliminated and it remains the regions of interest which are exudates. De-tails on the different steps are given below.
2.2. Preprocessing
The retinal images appear with low light, very noisy and carry a lot of information. Preprocessing images commonly involves removing low frequency background noise, normalizing the intensity of the individual particles images, removing reflections, and masking portions of images. Image preprocessing is the technique of enhancing data images prior to computational processing. Preprocessing consists of three steps: Resizing, RGB to Grayscale conversion image and Filtering.
Resizing is used to alter the size of an image. Most images are in truecolor. To separate the color components with intensity and brightness, the component retinal input images in the RGB color space are converted to grayscale image by normalizing the range of the R, G, and B components to the inter-val from 0 to 1. We extract the green channel image, because green channel shows high intensity be-tween exudates and background as compared to red and blue [13]. Filtering methods are used to sepa-rate the noise pixels from the regions of interest. In our project we use histogram expansion and me-dian filter.
2.2.1. Histogram Expansion
Also called dynamic expansion, its purpose is simply to give a low-contrast image the full dynamic range that is allowed by a linear expansion of the gray scale used by the image. Usually a better contrast is obtained. This method consists of making best use of the gray scale available on the image acquisition sys-tem. This comes down to extending the histogram so that the lowest value is at zero and the highest is at the maximum value.
The simplicity of this approach comes from the fact that a large class of filters can be implemented according to the changes of constant values α and β , chosen to obtain a modified image with better
con-trast. The linear transformation is described as follow.
Let
[
a a0, 1]
be the range of intensities of pixels present in the starting image and[
amin,amax]
theavailable interval (In general amin =0 and amax =255). The modified pixel MI i j
( )
, obtain after thedynamic expansion of pixel SI i j
( )
, in the starting image is given by the relation:( )
,( )
,MI i j = + ∗α β SI i j (1)
with min 1 max 0
1 0
a a a a
a a
α = ⋅ − ⋅
− (2)
and max min
1 0
a a
a a
β = −
− (3)
Relation (1) corresponds with linear T transformation:
( )
, T( )
,SI i j →M i j (4)
where SI i j
( )
, belongs to the interval[
a a0, 1]
and M i j( )
, to the interval[
amin,amax]
.https://doi.org/10.4236/jbise.2019.123015 217 J. Biomedical Science and Engineering 2.2.2. Median Filter
The median filter is a digital filter, often used for noise reduction. Noise reduction is a conventional preprocessing step to improve the results of future treatments (edge detection, for example). The median filter technique is widely used in digital image processing because it reduces noise while maintaining the contours of the image. The main idea of the median filter is to replace each entry with the median value of its neighborhood.
The median filter enables to eliminate the aberrant values without being limited to averaging them, which would tend to contaminate the neighboring values with this aberrance and make the image become blurred.
The median filter respects the contrast of the image (if we multiply all the values by a positive con-stant, the ordering of the values is unchanged) and the brightness of the image (adding a constant does not modify the scheduling either). In areas where the intensity is monotonous (only increasing or only de-creasing) the filter leaves the image unchanged. It respects the contours, and eliminates extreme values.
This operation leads to the reduction of the number of false positives (FP).
2.2.3. Subtraction Operation
[image:6.595.61.535.327.640.2]The two operations in subsequent paragraphs are very important in the automatic detection of retinal exudates. The preprocessing step ends with a simple difference between the filtered image and its inverse. An example can be seen on the retinal fundus image in Figure 3. On the original image (Figure 3(a)), the
https://doi.org/10.4236/jbise.2019.123015 218 J. Biomedical Science and Engineering
histogram expansion highlights the lesion and other dense adipose tissue from the rest of the parenchymal background (Figure 3(b)).
2.3. Segmentation
Segmentation is the part of partitioning a digital image into multiple segments. Simplify and/or change the representation of an image into something that is more meaningful and easier to analyze. Im-age segmentation is the front stIm-age processing, three advantIm-ages in imIm-age segmentation that are speed, good shape and reliable. In our project image segmentation consist into two steps: Optic disc detection, Blood vessels extraction.
2.3.1. Blood Vessels Extraction
Blood vessels appeared as networks of either deep red or orange-red filaments which take origin within the optic disc and were of progressively diminishing width [14]. The presence of this element in retinal image after preprocessing leaves the OD subdivided into several non-zero gray level regions. To give the OD a uniform distribution of gray level forming a single region, we proceed to the elimination blood vessels using a morphological closure that derives from the basic operators which are erosion and dilation.
2.3.2. Entropy Maximization Thresholding
After removing the blood vessels, we obtain an image with the OD defining a single region and hav-ing a uniform distribution of gray levels.
In this section, we will select and binarized the image candidate knowing that the exudates are ho-mogeneous in them color property and are characterized by a strong and brightness contrast comparable to other image. In the localization of exudates regions in digital retinal fundus images, it is essential that the expertise and experiences of the ophthalmologists be incorporated into computer visualisation processes for improvements in segmentation accuracy. The problem we want to solve is to detect lesions in Retinal fundus images which appear as bright, spot-like protrusions in the breast tissue. These lesions represent small areas in the image. A method suitable for such situations is thresholding by entropy maximization. Therefore the entropy maximization will be applied to eliminate the background of the image.
1) Basics on Entropy Maximization
Entropy maximization algorithm is a popular technique of global thresholding derived from Schan-non information theory [15]. In this technique, two classes problems are to be processed: one have typi-cally a class with many candidates (background pixels in our case) and a class with a few candidates (ex-udates and optic disk pixels).
Let C1 and C2 be classes of grey level in the original mammogram. Let T be the threshold that
leads to the partition of the image into the two classes C1 and C2. Then the entropy of the image is
eva-luated by the following equation:
( )
( )
1( )
2E T =E C +E C (5) For various values of T (which all lead to the partition of the image in two classes), we have different values of the sum (E C
( )
1 +E C( )
2 ). The algorithm will finally retain the threshold T for which, theentro-py reaches its maximum value. As can be seen, E is actually a function of T.
( )
1E C and E C
( )
2 are the entropies of class C1 and C2 respectively, given by the relations:( )
1(
1)
(
1)
0 ln
T
i
E C Pi C Pi C
=
= −
∑
∗ (6)( )
2(
2)
ln(
2)
N
i T
E C Pi C Pi C
=
= −
∑
∗ (7)probabili-https://doi.org/10.4236/jbise.2019.123015 219 J. Biomedical Science and Engineering
ties of the grey level i in the class C1 and class C2, respectively.
The value of T, which gives the maximal entropy value E T
( )
, is defined as threshold.( )
(
)
(
)
arg max
T = E T (8)
The logarithms function in Equation (6) and Equation (7) improve classes for which frequency of apparition are low.
2) Entropy Maximization Thresholding Algorithm Step 1: We build the histogram of the image to segment.
Step 2: We group the grey level of the image into 2 classes with a threshold T chosen arbitrarily among pixels of our histogram.
Step 3: We compute the entropy E T
( )
of the image for T varying from 0 to N. Step 4: We identify the value of T from which E T( )
is maximum as the threshold “s”.Step 5: According to the condition i > s pixels are grouped into two groups which leads us to a binary image with suspicious exudates and optic disk.
2.3.3. Optic Disk Detection and Elimination
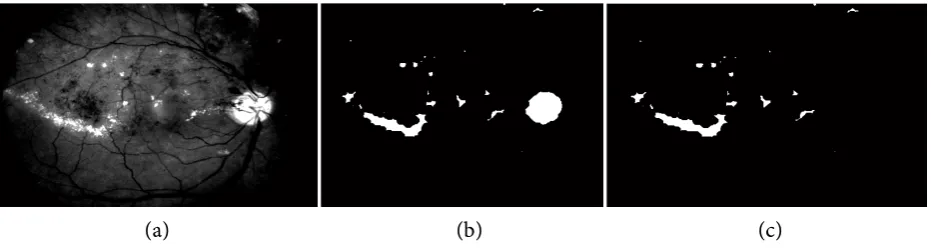
The OD is the point of the eye that does not see. It is a bright yellowish disk and elliptical contour in human retina from where the blood vessels and optic nerves emerge ([16, 17]). The optical disk has a larg-er size than the retinal exudates. To eliminate this element, we use a size-based critlarg-erion to remove in the binary image any region that has the maximum area. From enhanced image obtain during preprocessing step, we can see in the Figure 4 below exudates obtain after segmentation.
3. EXPERIMENTAL RESULTS AND DISCUSSIONS
3.1. Exudates Detection Ability
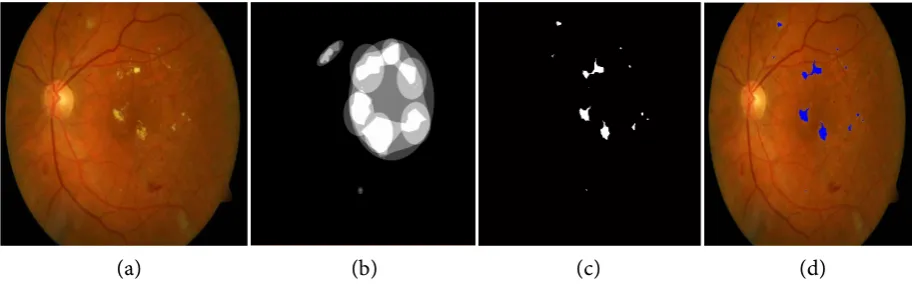
This section presents the results of exudates segmentation from the proposed method. An example of a retinal fundus image and its detection result is shown in Figure 5.
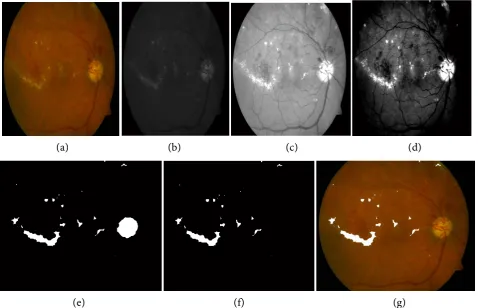
The following figure (Figure 6) shows some images of the DIARETDB1 database with their manual segmentations made by the ophthalmologists and confirmed by biopsy and the results of the segmented exudates as well as the image with the segmented exudates reconstructed and superimposed on the origi-nal image.
3.2. System Performances and Discussion
We carried out evaluation of the system we built in term of its capacity to detect all exudates. Then, the performance of our approach is estimated by comparing our results with the performance of ophthal-mologists.
Following the practices in the medical research, the fundus images related to the diabetic retinopathy
[image:8.595.67.533.565.689.2](a) (b) (c)
https://doi.org/10.4236/jbise.2019.123015 220 J. Biomedical Science and Engineering
(a) (b) (c) (d)
[image:9.595.61.540.74.382.2](e) (f) (g)
https://doi.org/10.4236/jbise.2019.123015 221 J. Biomedical Science and Engineering
[image:10.595.70.529.72.214.2](a) (b) (c) (d)
Figure 6. Result of the segmentation. Column (a) original image containing the exudates; Column (b) result of manual segmentation by experts; Column (c) segmented exudates; Column (d) seg-mented exudates reconstructed and superimposed on the original image (image N˚16, N˚5 and N˚15 in database).
are evaluated by using sensitivity and specificity per image basis. Sensitivity (Se) is the percentage of abnormal fundus images classified as abnormal, and Specificity (Sp) is the percentage of normal fundus images clas-sified as normal by the screening. Sensitivity and specificity are also referred to as the true positive rate (TPR) and true negative rate (TNR), respectively. Sensitivity is calculated according to images containing exudates and specificity is calculated according to images without exudates. The higher the sensitivity and specificity values, the better the diagnosis. Sensitivity and specificity are computed as:
TP Se TPR
TP+FN
= = (9)
TN Sp TNR
TN+FP
= = (10)
where TP (True Positives) is the number of abnormal fundus images found as abnormal with exudates pixels correctly detected, TN (True Negatives) is the number of normal fundus images found as normal with non-exudates pixels that are correctly detected as non-exudates pixels, FP (False Positives) is the number of normal fundus images found as abnormal with non-exudates pixels that are wrongly detected as exudates pixels and FN (False Negatives) is the number of abnormal fundus images found as normal with exudates pixel that are not detected as exudates [6].
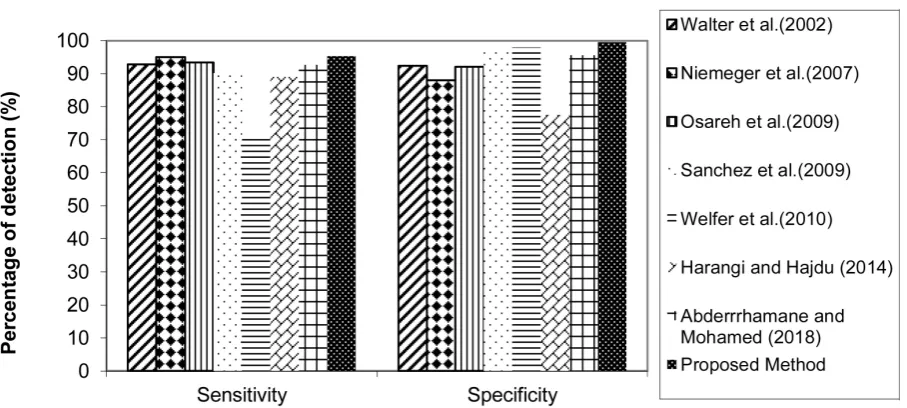
In the database described above in Section 1.2, among the 84 images with a sign of DR, 38 images contain exudates. The remaining 46 with the 5 normal images (i.e. 51 images) are without exudates. The re-sults obtained after calculating these parameters are respectively 95, 27% for Sensitivity and 99.53% for Specificity. Table 1 presents a performance comparison between the proposed method and the state-of-the-art methods.
This table below shows that the proposed approach produces a more improved result compared to the approaches listed in the state of the art (see Figure 7).
4. CONCLUSIONS
The color fundus images are playing a major role in the detection of exudates. Nowadays, the diabetic patients increased throughout the world. So, early detection of exudates is useful to reduce the occurrence of vision loss. At the same time automatic detection of exudates is useful to the ophthalmologists. The main purpose of the project is to detect hard exudates.
https://doi.org/10.4236/jbise.2019.123015 222 J. Biomedical Science and Engineering
Table 1. Performance of exudates detection.
Method Se (%) Sp (%)
Walter et al. (2002) 92.8 92.4
Niemeijer et al. (2007) 95 88
Osareh et al. (2009) 93.5 92.1
Sánchez et al. (2009) 90.2 96.8
Welfer et al. (2010) 70.5 98
Harangi and Hajdu (2014) 89 77.5
Abderrhamane and Mohamed (2018) 92.7 95.6
Proposed Method 95.27 99.63
Figure 7. Performance of exudates detection.
of exudates is enhanced. Blood vessel removal is applied on enhanced image using morphological operator then followed by Entropy maximization thresholding. Finally, OD elimination is applied and regions of interest (exudates) are detected. The proposed algorithm achieves better results than state-of-the-art me-thods in terms of the sensitivity and specificity (94.47% and 97.63% respectively). The proposed algorithm also works with lower quality retinal images. Our result suggests that the system is qualified to comple-ment the screening of DR. Future work will be needed for improving sensibility of our approach so that it can be useful for clinical application. Other perspective will be the detection. Microneurysm and Hae-morrhage could be added to the system, so that it increases the ability to verify the diabetic retinopathy. There may be problem in separating the pathologies from small vessels; it could be useful to extent this work to detect them.
ETHICAL APPROVAL
[image:11.595.75.529.292.496.2]https://doi.org/10.4236/jbise.2019.123015 223 J. Biomedical Science and Engineering
CONFLICTS OF INTEREST
The authors declare that there are no conflicts of interest regarding the publication of this paper.
REFERENCES
1. Ardiyanto, H., Nugroho, A. and Budiani, R.L. (2016) Maximum Entropy Principle for Exudates Segmentation in Retinal Fundus Images. International Conference on Information, Communication Technology and System (ICTS), Surabaya, 12 October 2016, 119-123. https://doi.org/10.1109/ICTS.2016.7910284
2. Marin, D., Gegundez-Arias, M.E., Ponte, B., Alvarez, F., Garrido, J., Ortega, C., Vasallo, M.J. and Bravo, J.M. (2018) An Exudate Detection Method for Diagnosis Risk of Diabetic Macular Edema in Retinal Images Using Feature-Based and Supervised Classification. Medical & Biological Engineering & Computing, 8, 1379-1390. https://doi.org/10.1007/s11517-017-1771-2
3. Sánchez, C.I., Hornero, R., López, M.I. and Poza, J. (2004) Retinal Image Analysis to Detect and Quantify Le-sions Associated with Diabetic Retinopathy. Proceedings of the 26th Annual International Conference of the IEEE Engineering in Medicine and Biology Society (EMBS), San Francisco, 1-5 September 2004, 1624-1627. https://doi.org/10.1109/IEMBS.2004.1403492
4. Abderrahmane, E. and Mohamed, F. (2018) Exudates Detection in Fundus Images Using Meanshift Segmenta-tion and Adaptive Thresholding. International Journal of Computer Methods in Biomechanics and Biomedical Engineering: Imaging & Visualization.
5. Biran, A. and Bidari, P.S.R. (2016) Automatic Methode For Exudats and Emorrhage Detection From Fundus Retinal Image. International Journal of Computer and Information Engineering, 10, 1599-1602.
6. Piotr, C., Majumdar, S., Francesco, C., Bashir, A.-D. and Andrew, H. (2018) Exudate Segmentation Using Fully Convolutional Neural Networks and Inception Modules. 2018 40th Annual International Conference of the IEEE Engineering in Medicine and Biology Society, Honolulu, 17-21 July 2018, 770-773.
7. Pereira, C., Gonçalves, L. and Ferreira, M. (2015) Exudate Segmentation in Fundus Images Using an Ant Colo-ny Optimization Approach. Journal Information Sciences—Informatics and Computer Science, Intelligent Sys-tems, Applications: An International Journal, 296, 14-24. https://doi.org/10.1016/j.ins.2014.10.059
8. Welfer, D., Scharcanski, J. and Marinho, D.R. (2010) A Coaseto-Fine Strategy Foe Automatically Detecting Ex-udates in Colour Eye Fundus Images. Computerized Medical Imaging and Graphics, 34, 228-235.
https://doi.org/10.1016/j.compmedimag.2009.10.001
9. Harangi, B. and Hajdu, A. (2014) Automatic Exudate Detection by Fusing Multiple Active Contours and Region Wise Classification. Computers in Biology and Medicine, 54, 156-171.
https://doi.org/10.1016/j.compbiomed.2014.09.001
10. Imani, H.R.P. (2016) A Novel Method for Retinal Exudate Segmentation Using Signal Separation Algorithm. Computer Methods and Programs in Biomedicine, 133, 195-205. https://doi.org/10.1016/j.cmpb.2016.05.016 11. Comanicu, D. and Meer, P. (2002) Mean Shift: A Robust Approach toward Feature Space Analysis. IEEE
Transactions on Pattern Analysis and Machine Intelligence, 24, 603-619. https://doi.org/10.1109/34.1000236 12. Kauppi, T., Kalesnykiene, V., Kamarainen, J.K., Lensu, L., Sorri, I., Raninen, A., Voutilainen, R., Uusitalo, H.,
Ainen, H.K. and Pietila, J. (2007) DIARETDB1 Diabetic Retinopathy Database and Evaluation Protocol. Pro-ceedings of the British Machine Vision Conference 2007, University of Warwick, UK, 10-13 September 2007, 61-65. https://doi.org/10.5244/C.21.15
https://doi.org/10.4236/jbise.2019.123015 224 J. Biomedical Science and Engineering 14. Sinthanayothin, C., Boyce, J.F., Cook, H.L. and Williamson, T.H. (1999) Automated Localisation of the Optic
Disc, Fovea, and Retinal Blood Vessels from Digital Colour Fundus Images. British Journal of Ophthalmology, 83, 902-910. https://doi.org/10.1136/bjo.83.8.902
15. Kapur, J.N., Sahooo, P.K. and Wong, A.K.C. (1985) A New Method for Grey Level Picture Thresholding Using the Entropy of Histogram. Computer vision, Graphics and Image Processing, 29, 273-285.
https://doi.org/10.1016/0734-189X(85)90125-2
16. Aquino, A., Gegundez-Arias, M.E. and Marin, D. (2010) Detecting the Optic Disk Boundary in Digital Fundus Image Using Morphological, EdgeDetetion, and Feature Extraction Techniques. IEEE transactions on medical imaging, 29, 1860-1869. https://doi.org/10.1109/TMI.2010.2053042