Studies on crystal structure, magnetic and conductivity
prop-erties of the titanium oxycarbide solid solution (TiO
1-xC
x)
David N. Miller, Abdul K. Azad, Heloise Delpouve, Lucille Quazuguel, Jun Zhou, Amit Sinha, Philip Wormald and John T.S. Irvine
The School of Chemistry, University of St Andrews, St Andrews, KY16 9ST, UK.
ABSTRACT
Titanium oxides and carbides are often considered as electrode materials in energy conversion and
stor-age devices due to their high potential conductivity and good stability. Titanium monoxide and titanium
carbide have structures that can both be described as rocksalt with the same cubic close packed titanium
sublattice with oxygen and carbon respectively occupying the octahedral interstices; however the oxide
is characterised by extensive defects on both sublattices whilst the carbide is stoichiometric and might
be considered as an interstitial metal. Despite the anticipated very different natures of the oxide and
car-bide sublattices, these two phases actually form a complete solid solution. In the present investigation,
TiO0.5C0.5 where half of oxygen of TiO is replaced by carbon has been confirmed by selected-area elec-tron diffraction studies. Low temperature magnetic and conductivity measurements confirm that all ox-ycarbide compositions are Pauli paramagnetic and good metallic conductors.
KEYWORDS Titanium monoxide, titanium carbide, titanium oxycarbide.
1. Introduction
Whilst titanium oxycarbides are known, especially in some engineering applications, the extent, chemistry
and physical properties of the solid solution have not been systematically explored. Titanium oxycarbide
has been considered to be a solid solution of titanium monoxide (TiO) and titanium carbide (TiC) with
general formula TiO1-xCx where oxygen and carbon occupy the octahedral interstitial sites in a face centred
cubic titanium lattice.1 Titanium monoxide, TiO, can exist as a number of phases all closely related to the
rock salt structure (space group Fm-3m). Titanium monoxide is one of a small number of compounds that
have vacancies on both the the metal and oxygen sublattices. In stoichiometric titanium monoxide 15%
of the titanium and oxygen sites are vacant.2 The stable room temperature phase of TiO is an ordered
monoclinic phase (space group B2/b) where metal and oxygen vacancies are located in every third (110)
cubic rock salt plane 3. This monoclinic phase is stable to up to 925°C . At elevated temperatures a cubic
rocksalt phase is stable where the location of the vacant Ti and O sites becomes random.4 The higher
temperature cubic TiO phase can be non-stoichiometric in the range TiO0.8-TiO1.25. For compositions
between TiO and TiO1.25 the low temperature and high temperature phases coexist to room temperaure.5
Titanium monoxide has been identified as a superconductor below 1 K and is Pauli paramagnetic and a
metallic conductor.6 The conduction band of TiO arises through the overlap of partially filled t
2g orbitals
formed by the crystal field splitting of the d-orbitals of neighbouring Ti(II) cations.7 Reduced titanium
oxides have been widely applied as electrodes in a range of electrochemical applications, especially for
the Magneli phases known as Ebonex8.
Titanium carbide has recently been successfully utilised as an electrode support in lithium air batteries9.
occupied by carbon atoms. Similar to other d-block interstitial carbides TiC is a very hard refractory
material with a melting point of 3160 °C. Non-stoichiometric titanium carbides, TiC1-x, can accommodate
vacancies on the carbon site up to 50%.10
The solid solution that exists between TiO and TiC represents an uninterrupted transition between the
predominantly ionic and covalent bonding between titanium and oxygen in TiO to the metallic refractory
nature of TiC and is accompanied by changes in defect structure and properties.
Early research into the titanium oxycarbide system concentrated on understanding the thermodynamics
to facilitate their use in the extractive metallurgy of titanium metal or the commercial production of
titanium carbide.11, 12 More recent studies have concentrated on applications that make use of the
properties of titanium oxycarbide itself. Titanium oxycarbides exhibit properties that are characteristic of
metallic, ionic and covalent systems. Titanium oxycarbides exhibit high hardness, electrical conductivity
and unique optical and catalytic properties. Studies on titanium oxycarbide thin films have shown that the
optical, mechanical and electrocatalytic properties can be tailored by altering the processing conditions.
13 Titanium oxycarbide nanotubes and thin films have been utilised as electrically conductive substrates
for electrocatalysts.14, 15 The high hardness of titanium oxycarbide makes it suitable for use in wear
resistant coatings.16, 17
Titanium oxycarbides are most often formed in an inert atmosphere or vacuum from the carbothermal
reduction of TiO2 with graphite or hydrocarbons11 or by the direct reaction of titanium metal with titanium
monoxide, TiO and titanium carbide, TiC.1 Other studies have demonstrated oxycarbide formation by the
direct reduction of Ti2O3 and TiO2 with CO,18 and the oxidation of titanium carbide.19, 20 Such methods
do not easily lend themselve to the synthesis of titanium oxycarbides with specific stoichiometries as there
is not full control on all three components. As such very few systematic studies have been carried out on
the effect of composition on the structure and properties of titanium oxycarbides. Studies have mainly
been limitted to individual compositions as in the case of Jiang et al. (TiO0.5C0.5)1,Tashmetov
case of the thermal expansion coefficient and conductivity study of Ivanov et al. 1 An exception to this is
Zainulin et al. who investigated the mechanism of oxygen incorporation into titanium carbides (TiOxC0.5,
TiOxC0.8, etc).20 So, despite the research effort that has been committed to understanding the
thermodynamics of titanium oxycarbides and the nature of nanostructured titanium oxycarbide thin films,
systematic studies on the structure and properties of titanium oxycarbides remain necessary. Here a study
of the solid state synthesis and bulk properties of titanium oxycarbides is presented across the entire solid
solution that exists between TiO and TiC.
2. Materials and Methods
Compounds in the series TiO1-xCx (x=0, 0.1, 0.2, 0.3, 0.33, 0.4, 0.5, 0.6, 0.67, 0.7, 0.8, 0.9 and 1) were
prepared by traditional solid-state reaction. Stoichiometric amounts of high-purity (>99%) TiO and TiC
(Aldrich) were mixed and ground in a Fritsch Pulverisette 7 planetary ball mill. The resulting powders
were compacted into pellets of 14 mm diameter using a uniaxial hydraulic press. The pellets were either
fired in a tube furnace in flowing argon at 1400-1450 °C for 12h or under vacuum in a Centorr Torvac
vacuum furnace at 1500 °C for 5h. The phase purity of the heat treated pellets was characterized through
X-ray diffraction (XRD). The partially reacted samples were subjected to repeated heat treatments with
intermittent grinding and consolidation till the formation of phase-pure oxycarbide was achieved.
Synthesis of oxycarbide under vacuum called for single or double heat treatments while processing under
flowing argon needed at least three heat-treatment cycles.
X-ray diffraction (XRD) data were acquired using a PANalytical Empyrean X-ray diffractometer, using
monochromated CuK1 radiation operated in reflection (Bragg Brentano) mode in the range 2 = 10 –
90° with a step size of 0.0170° and a time per step of 0.765s. The unit cells of the prepared materials were
Microstructural characterization of titanium oxycarbide specimens was carried out using a scanning
electron microscope (SEM, JEOL JSM 6700F) and a transmission electron microscope (TEM, JEOL
JEM-2010). SEM characterisation was carried out on the fracture surfaces of titanium oxycarbide
specimens. Samples for transmission electron microscopy were prepared by grinding oxycarbide samples
in a mortar and pestle in acetone. A pipette was used to place a drop of the oxycarbide particle suspension
on a holey carbon film on a 3mm copper grid. The density of samples was measured by Micromeritics
AccuPyc gas pycnometer using helium.
Solid state nuclear magnetic resonance (nmr) measurements were carried out using a 400 MHz Bruker
Avance III Spectrometer equipt with a 7mm MAS HX probe. Data was collected using the DEPTH pulse
sequence to supress spins that experience less than π/4 pulse length and minimise spurious signal 23. The
π/2 pulse was set to 8µs and π puslse to 16 µs. Recyel time was 0.1s and 2k data points were sampled.
Thermo-gravimetric analyses of the samples were carried out using a Netzsch STA 449 Jupiter instrument.
Samples for oxidation analysis were heated to 1200 °C at 5 °C per minute in flowing air.
Magnetic susceptibility measurements were carried out using a Superconducting quantum interference
device (SQUID magnetometer)
Contacts for four point conductivity measurements were applied to samples using RS Silver loaded epoxy
adhesive. Conductivity measurements were carried out between 70K and 250K by mounting the samples
on an Oxford Instruments cryogenic insert column mounted in a liquid nitrogen dewar. The temperature
was controlled using an oxford instruments IT503 temperature controller. The resistance of samples was
measured using a Keithley 2401 sourcemeter.
3. Results and Discussion
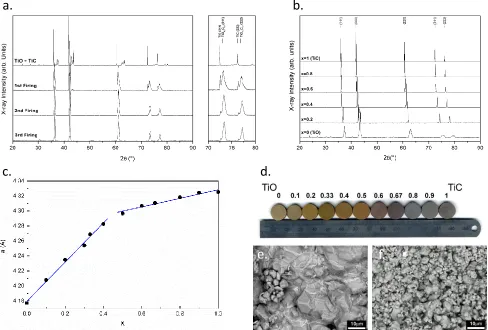
When the solid state synthesis of titanium oxycarbides is carried out at 1400 °C in flowing argon multiple
process are shown in Figure 1a. Initially the sample consists of cubic fluorite TiC and monoclinic TiO.
After the initial firing of the sample, the XRD pattern shows peaks corresponding to unreacted TiC and
broad titanium oxycarbide peaks consistant with the expected cubic rocksalt structure. The position of the
TiC peaks remain largely unchanged, indicating limited diffusion of oxygen into the TiC structure. The
broadness of the titanium oxycarbide peaks indicate that this phase is compositionally inhomogeneous.
After being reground and refired the 2 values of the TiC peaks increase slightly indicating a small
amount of oxygen diffusion while the intensity of the peaks have reduced relative to the oxycarbide peaks.
The oxycarbide peaks have narrowed, indicating increased homogeneity. After the third firing only a small
remnant of the TiC peaks remain, while the titanium carbide peaks have become more defined. This slow
incorporation of the TiC into the oxycarbide is due to its refractory nature compared to the TiO. TiC has
a very high melting point and fully occupied octahedral sites, two characteristics that typically lead to
slow diffusion. Carbon diffusion into TiO is more rapid due to its vacancies on both the titanium sites and
octahedral sites and its much lower melting point.
Figure 1b shows the XRD traces of TiO1-xCx fired at 1500-1600 °C under vacuum. All compositions apart
from the starting material TiO show diffraction patterns consistent with a cubic fluorite structure as
expected for full solid solution between TiO and TiC. Apart from TiO, there are no additional reflections
that would indicate ordering of any vacancies or oxygen and carbon on the titanium interstitial sites.
However, the similarity of the atomic scattering factors of carbon and oxygen, make it impossible to
differentiate between oxygen and carbon sites using XRD. A similar study on titanium carbonitrides was
unable to differentiate between carbon and nitrogen by Rietveld refinement.24
A plot of cubic lattice parameter with x is shown in Figure 1c. Across the entire composition range studied,
the variation of lattice parameter with composition is non-linear. However, the variation of lattice
parameter with composition is linear from x=0 to x=0.4 and from x=0.5 to x=1. When the trend is
considered as a whole the variation in lattice paremter suggests a change in solid solution mechanism
but might be considered consistent with the changing defect contents between the end members Between
x=0 (TiO) and x = 0.5 the increase in lattice parameter with x is significantly greater than between x=0.5
and x=1.0 (TiC). Between x=0 and x=0.5 the lattice parameter varies from 4.177 Å to 4.2993(10) Å, a
2.9% increase, while between x=0.5 and x=1.0 the lattice parameter only increases to 4.3253(19)Å, a
much lower 0.6% increase. These results are in good agreement with available literature values.20
Macrographs of the resulting pellets after firing are shown in Figure 1d. the carbon content of oxycarbide
increases, the colour of the sample gradually changes from initial golden color of TiO (x=0) to bronze
colour for the sample with x =0.5 and finally it changes to dark grey-black for samples with x values of
0.9 and higher
Back-scattered electron (BSE) micrographs of TiO0.8C0.2 (x=0.2) and TiO0.2C0.8 (x=0.8) are shown in
Figure 1e and 1f respectively. The lower carbon x=0.2 sample has lower porosity and a larger grain size
than x=0.8 sample. The presence of higher porosity and smaller grain size in the microstructure of the
oxycarbide sample with x =0.8 is consistent with lower densification associated with the more refractory
nature of higher carbon containing samples.
The selected-area electron diffraction patterns recorded from TiO0.5C0.5 in Figure 2 a, b and c show diffuse
scattering not apparent in the x-ray diffraction patterns. Similar diffuse scattering is observed in
non-stoichiometric vanadium, titanium and niobium carbides which also have rock salt type structures and is
associated with ordering of carbon vacancies on the interstitial sites.25, 26 It is unlikely that ordering of
vacancies in TiO0.5C0.5 caused by electron beam damage would lead to the diffuse scatter observed in
Figure 3 as the opposite effect has been observed in vanadium carbide. When the selected-area diffraction
pattern of vanadium carbide, V6C5, is observed in the TEM the interaction of carbon atoms with the
electrons of the TEM causes them to be displaced to vacant interstitial sites, disordering the carbon lattice.
This process reduces and eventually removes superlattice reflections and diffuse scattering from the
scattering may be the segregation or clustering of oxygen and carbon rich regions in the sample. Neutron
diffraction studies by Zubkov et al.22 on the near-stoichiometric composition TiO
0.57C0.44 and by Tasmetov
et al.21 on the high-vacancy composition TiO
0.08C0.545 have both reported the formation of ordered
structures. Recent studies on the thermodynamics of titanium oxycarbides and stability of titanium
oxycarbide thin films have indicated that although there is a large driving force for the formation of
titanium oxycarbides at elevated temperatures, they are not thermodynamically stable at low
temperatures.12 An X-ray photoelectron spectroscopy study by Calvillo et al. on the carbothermal
transformation of TiO2 into titanium oxycarbide found that decompostion occurred on cooling resulting
in the formation of various titanium oxides and elemental carbon and the possible segregation of TiO and
TiC related phases.28
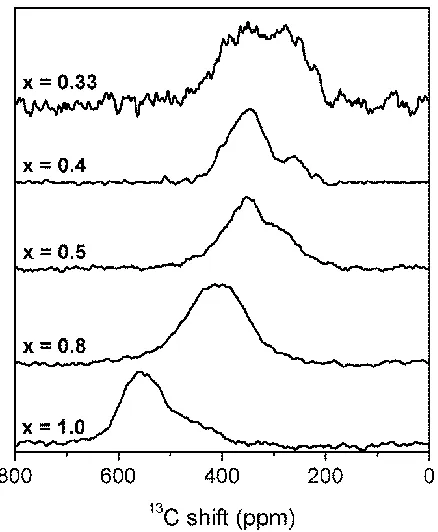
The composition of samples was analysed by Static 13C solid state NMR and TGA. The resulting NMR
spectra, shown in Figure 3, consists of broad signals of around ~20kHz and confirm the presence of carbon
in these samples. Signals could only be obtained for samples where fraction of carbon on the interstitial
sites exceeded 33%. The chemical shift was measured at the center of gravity of the most intense part of
the signal and shows an upfield shift as the carbon content decreases. Furthermore, the introduction of
oxygen to the samples is accompanied by a two-fold increase in the line width of the main signal which
varies from 9 kHz-18kHz. This variation in peak shift and linewidth with x is similar to that observed in
the TiN1-xCx system29 where a linear dependency was reported. For x=0.4 there is an increase in resolution
evident by a signal at 260ppm and for x=0.5, a broad signal upfield of the main signal. This could be
indicative of the decomposition or segregation in these samples. The spectrum of x=0.33 is weak due to
dilution of carbon in the sample.
The mass change that accompanies the oxidation of TiO1-xCx to TiO2 in air was determined by
thermogravimetric analysis to confirm that no loss of oxygen or carbon from the samples occurs during
the formation reactions:
The results of the TGA analysis are listed in Table 1. All but one of the mass changes are within 1% of
the expected values giving measured compositions close to the nominal targets. The sample with x=0.2
had a measured weight gain that was 1.67% less than expected giving a composition of TiO0.76C0.16 instead
of TiO0.8C0.2, according to equation 1.
The density of the samples was determined by helium pycnometry. These results are plotted in Figure 4a.
Both precursors, TiO and TiC, were found to have their expected literature values, 4.95 g cm-3 and 4.93 g
cm-3 respectively. Also, shown in Figure 4a are curves corresponding to the expected densities of the
oxycarbides if the titanium and interstitial sites are fully occupied, as in TiC, and if 15% of the Ti and O
sites are vacant, as in TiO. It can be seen that most of the measured density values for the titanium
oxycarbides synthesised lie intermediate between these two curves, indicating that they have neither the
fully occupied rock salt structure of TiC nor the 15% vacancies on the titanium and interstitial sites of
TiO. The exceptions to this are the x=0.1 and x=0.8 samples, the density of of the sample with x=0.1 falls
on the curve corresponding to the 15% vacancy structure while the sample with x=0.8 corresponds to the
fully occupied rock salt structure.
When these density results are combined with the lattice parameters obtained by XRD to calculate the
occupancies of the unit cell, as shown in Figure 4b, it can be seen that each oxycarbide composition is a
step in the gradual transition from the high vacancy content of TiO to the vacancy free structure of the
TiC. The largest decrease in vacancy level occurs between x=0.1 and x=0.6 where the proportion of
vacancies to occupied sites decreases from 15% to 2.5%. This large decrease corresponds to the large
decrease in lattice parameter from x=0.1 to x=0.6 apparent in Figure 1c. The 7.4% vacancies that was
measured for x=0.4 agrees well with the site occupancy reported by Zubkov et al.22 for the similar
composition TiO0.44C0.57. The 6.1% vacancies level measured here for x=0.5 is higher than the 3.7%
reported by Zainulin et al.20 for the same composition in the TiO
xC0.5 (x=0 - 0.8) system. In that system
the gradual incorporation of oxygen into TiC0.5 does not result in equal number of vacancies on the
atoms are equal to the number of titanium atoms. Zainulin et al. attributed the formation of vacancies in
oxycarbides to the stabilisation of the structure by the screening of titanium-titanium interactions.20
The variation in magnetic susceptibility, m, with temperature of selected samples are shown in Figure 5a.
The samples were zero field cooled and measured in a 50 Oe magnetic field. All samples were found to
be Pauli Paramagnetic and could be fitted by the Curie-Weiss equation:
m = A + BT C/(T+) (2)
where C is the Curie constant , T is the absolute temperature and is the Weiss constant. Fitting parameters
are shown in Table 2. The x=0.8 sample has a significantly larger Curie constant than other compositions,
which signifies the presence of more paramagnetic defects or impurities. As this seems to be the onset
point for significant concentrations of M-O defect pairs, this could tally with the presence of short range
frustration. There is no evidence of super conductivity for temperatures greater than 5K for any of the
samples tested.
The variation in resistivity with temperature of a range of samples is shown in Figure 5b, minimal
variation in conductivity with temperature is observed. Such low variation of conductivity with
temperature is similar to non-stoichiometric transition metal carbides where conduction electrons are
scattered by vacancies.30 A previous study by Ivanov et al. has shown that conductivities are reduced at
low carbon contents due to the increased level of defects and the greater ionic character of the bonding.13
Determination of the variation of conductivity with composition is complicated by the difficulty in
obtaining defect-free high density samples from these materials. For compounds where x=0.2 and greater
there appears to be a decrease in resistivity as carbon content increases, however the effects of density
4. Conclusions
XRD confirms that all compositions apart from TiO in this solid solution series have cubic rocksalt
structures (Fm-3m) with no evidence of ordering of oxygen and carbon on the metal sites. The
non-linear variation of lattice parameter with composition can be attributed to variations in the level of
vacancies on the titanium and non-metal sites and diffuse scattering detected by selected-area electron
diffraction in the TEM indicates some evidence of local ordering of vacancies or segregation of carbon
and oxygen rich regions. Measurements of conductivity and magnetic susceptibility confirm all
compositions are good metallic conductors and due to their robust nature this series offer an importnew
set of alternative materials for current collection in a wide range of electrochemical applications.
ACKNOWLEDGMENT
We acknowledge support from EPSRC for Platform Grant EP/K015540/1 and the Royal Society for Wolfson Merit Award WRMA 2012/R2.
AUTHOR INFORMATION Corresponding Author
John T.S. Irvine, School of Chemistry, University of St Andrews , St Andrews, Fife KY16 9ST, Scot-land, UK.
email [email protected],
Present Addresses
Abul K. Azad, Faculty of Integrated Technologies, University Brunei, Darussalam, Gadong BE1410. Amit Sinha, Powder Metallurgy Division, Bhabha Atomic Research Centre, Vashi Complex, Navi Mumbai, 400703. India.
Jun Zhou, Department of Electrical Power Engineering, Xi’an Jiatong University, Shaanxi, China
Author Contributions
REFERENCES
1. B. Jiang, K. Huang, C. Zhanmin and H. Zhu, Metall. Trans. A, 2012.
2. A. A. Valeeva, A. A. Rempel' and A. I. Gusev, Inorg. Mater, 2001, 37, 603-612.
3. S. Bartowski, M. Neumann, V. Kurmaev, V. V. Fedorenko, S. N. Shamin, M. Cherkashenko, S. N. Nemnonov, A. Winiarski and D. C. Rubie, Phys. Rev. B, 1997, 56, 10656-10667.
4. A. N. Christensen, Acta Chemica Scandinavica, 1990, 44, 851-852. 5. P. G. Wahlbeck and P. W. Gilles, 1966, 49, 180-183.
6. F. J. Morin, Phys. Rev. Lett., 1959, 3, 34-36.
7. J. B. Goodenough, Phys. Rev., 1960, 117, 1442-1451.
8. F. C. Walsh and R. G. A. Wills, Electrochimica Acta, 2010, 55, 6342-6351.
9. M. M. Ottakam Thotiyl, S. A. Freunberger, Z. Peng, Y. Chen, Z. Liu and P. G. Bruce, Nat Mater, 2013, 12, 1050-1056.
10. J. B. Holt and Z. A. Munir, J. Mater. Sci, 1986, 21, 251-259.
11. C. Gao, B. Jiang, Z. Cao, K. Huang and Z. Hongmin, Rare Metals, 2010, 29, 547-551. 12. J. Kim and S. Kang, J. Mater. Chem. A, 2014, 2, 2641-2647.
13. N. A. Ivanov, L. P. Andreeva and P. V. Gel'd, Sov. Powder Metall., 1978, 8, 613-616.
14. R. Hahn, F. Schimdt-Stein, J. Solonen, S. Thiemann, Y. Song, J. Kunze, V.-P. Lehto and P. Schmuki, Angnew. Chem. Int. Ed., 2009, 121.
15. C. Rüdiger, J. Brumbarov, F. Wiesinger, S. Leonardi, O. Paschos, C. Valero-Vidal and J. Kunze-Liebhaüser, ChemCatChem, 2013, 5, 3219-3223.
16. J. M. Chappe, A. C. Fernandes, C. Moura, E. Alves, N. P. Barradas, N. Martin, J. P. Espinos and F. Vaz, Surf. Coat. Tech., 2012, 206, 2525-2534.
17. A. C. Fernandes, P. Carvalho, F. Vaz, N. M. G. Parreira, E. Le Bourhis and J.-P. Riviere, Plasma Process. Polm., 2007, 4, S83-S88.
18. A. Ouensanga, J. Less-Common Met., 1979, 63, 225-235.
19. T. Hashinin, T. Yamamoto, M. Ohyanagi and Z. A. Munir, J. Am. Ceram. Soc., 2003, 86, 2067-2073.
20. Y. G. Zainulin, S. I. Alyamovsky and G. P. Shveikin, J Phys. Chem. Solids, 1978, 39, 29-31. 21. M. Y. Tashmetov, V. T. Em, B. N. Savenko and G. Batdemberel, Crystallography Reports, 2003,
48, 106–111.
22. V. G. Zubkov, I. I. Matveenko, L. B. Dubrovskaya, G. D. Bogomolo and P. V. Geld, Doklady Akademii nauk SSSR, 1970, 191, 323-325.
23. D. G. Cory and W. M. Ritchey, J. Magn. Reson., 1988, 80, 128–132. 24. G. Levi, W. D. Kaplan and M. Bamberger, Mater. Lett., 1998, 35, 344-350.
25. J. Billingham, P. S. Bell and M. H. Lewis, Acta Crystallogr. A, 1972, A28, 602-606. 26. M. Sauvage and E. Parthe, Acta Crystallogr. A, 1972, A28, 607-616.
27. J. D. Venables and R. G. Lye, Philos. Mag., 1972, 19, 565-582.
28. L. Calvillo, D. Fittipaldi, C. Rüdiger, M. Favaro, C. Valero-Vidal, C. Di Valentin, A. Vittadini, N. Bozzolo, S. Jacomet, L. Gregoratti, J. Kunze-Liebhaüser, G. Pacchioni and G. Granozzi, J. Phys. Chem. C, 2014, 118, 22601-22610.
29. K. J. D. MacKenzie, R. H. Meinhold, D. G. McGavin, J. A. Ripmeester and I. Moudrakovski,
Solid State Nucl. Mag, 1995, 4, 193-201.
13 Figure 1. a. The XRD pattern of the x=0.5, TiO0.5C0.5 sample prior to and after subsequent firings at 1400
°C. b. The XRD patterns of TiO1-xCx where x = 0, 0.2, 0.4, 0.6, 0.8 and 1.0, c. the corresponding variation
in cubic lattice parameter with x , the lattice parameter value for cubic TiO was taken from Christensen,4
d. corresponding macrographs of each sample and back-scattered electron micrographs of e. the x=0.2 and f. x=0.8 samples.
Figure 2. Selected area electron Diffraction pattern of TiO0.5C0.5 orientated parallel to the a. [100], b. [110]
and c. [111] zone axes.
e.
f.
a.
b.
c.
d.
[image:13.612.62.302.476.565.2]14 Figure 3. Static 13C Solid state nuclear magnetic resonance results for selected samples.
Figure 4. a. The variation of density as measured by helium pycnometry compared to densities predicted by assuming full occupancy of the unit cell, as in TiC, and 15% vacancies as in TiO. b. The variation in the level of vacancies on titanium and non metal sites with x as calculated from helium pycnometry and XRD results.
[image:14.612.62.528.407.566.2]15 Figure 5. Variation of a. magnetic susceptibility and b. resistivity with temperature for TiO1-xCx.
Table 1. TGA results of titanium oxycarbide samples under flowing air Composition Mass Change [%]
[image:15.612.54.387.471.585.2]X Target Measured Expected Measured Difference 0 TiO TiO1.00 125.05 124.99 -0.05 0.1 TiO0.9C0.1 TiO0.88C0.084 125.84 124.96 -0.7 0.2 TiO0.8C0.2 TiO0.76C0.16 126.63 124.51 -1.67 0.3 TiO0.7C0.3 TiO0.68C0.28 127.44 126.52 -0.72 0.4 TiO0.6C0.4 TiO0.59C0.39 128.25 127.75 -0.39 0.5 TiO0.5C0.5 TiO0.49C0.49 129.08 128.64 -0.34 0.6 TiO0.4C0.6 TiO0.40C0.60 129.92 129.93 0.01 0.7 TiO0.3C0.7 TiO0.31C0.71 130.77 131.63 0.66 0.8 TiO0.2C0.8 TiO0.21C0.81 131.63 132.51 0.67 0.9 TiO0.1C0.9 TiO0.11C0.91 132.50 133.08 0.44 1 TiC TiC1.00 133.38 133.36 -0.01
Table 2. Magnetic susceptibility fitting parameters
X A [m3mol-1] B [m3K-1mol-1] C [m3Kmol-1] [K] 0 0.00003 5.34E-09 -1.60E-04 -37.55 0.2 5.42E-06 -5.91E-09 0.00005 -36.07
0.5 8.47E-06 -7.95E-09 -0.00002 -2.22
0.6 4.00E-05 -4.60E-08 -0.00013 1.19
0.67 0.00004 4.58E-08 -0.00031 -11.11
0.8 6.0E-5 1.01E-07 0.017 -43.67
1 1.0E-4 -1.25E-08 -0.00064 -38.82