ISSN Online: 2169-3323 ISSN Print: 2169-3285
DOI: 10.4236/sn.2019.83009 Jul. 30, 2019 122 Social Networking
Temporal Analysis of the Diffusion of
Knowledge in Networks of Software
Maintenance and Development Project Team
Jorge Luiz dos Santos, Renelson Ribeiro Sampaio
Computational Modelling and Industrial Technology, SENAI CIMATEC University Campus, Salvador, Brazil
Abstract
Different approaches have been established for applications of social and complex networks involving biological systems, passing through collaborative systems in knowledge networks and organizational systems. In this latter ap-plication, we highlight the studies focused on the diffusion of information and knowledge in networks. However, most of the time, the propagation of information in these networks and the resulting process of creation and dif-fusion of knowledge, have been studied from static perspectives. Additionally, the very concept of diffusion inevitably implies the inclusion of the temporal dimension, due to that it is an essentially dynamic process. Although static analysis provides an important perspective in structural terms, the behavioral view that reflects the evolution of the relationships of the members of these networks over time is best described by temporal networks. Thus, it is possi-ble to analyze both the information flow and the structural changes that occur over time, which influences the dynamics of the creation and diffusion of knowledge. This article describes the computational modeling used to eluci-date the creation and diffusion of knowledge in temporal networks formed to execute software maintenance and construction projects, for the period be-tween 2007 and 2013, in the SERVIÇO FEDERAL DE PROCESSAMENTO DE DADOS (FEDERAL DATA PROCESSING SERVICE-SERPRO)—a pub-lic organization that provides information and communication technology services. The methodological approach adopted for the study was based on techniques for analyzing social and complex networks and on the comple-mentary extensions that address temporal modeling of these networks. We present an exploratory longitudinal study that enabled a dynamic and struc-tural analysis of the knowledge networks formed by members of software maintenance and development project teams between 2007 and 2013. The study enabled identification of knowledge categories throughout this period,
How to cite this paper: dos Santos, J.L. and Sampaio, R.R. (2019) Temporal Analy-sis of the Diffusion of Knowledge in Net-works of Software Maintenance and De-velopment Project Team. Social Network-ing, 8, 122-146.
https://doi.org/10.4236/sn.2019.83009
Received: June 2, 2019 Accepted: July 27, 2019 Published: July 30, 2019
Copyright © 2019 by author(s) and Scientific Research Publishing Inc. This work is licensed under the Creative Commons Attribution International License (CC BY 4.0).
http://creativecommons.org/licenses/by/4.0/
DOI: 10.4236/sn.2019.83009 123 Social Networking in addition to the determination that the networks have a structure with small-world and scale-free models. Finally, we concluded that, in general, the topologies of the networks studies had characteristics for facilitating the flow of knowledge within the organization.
Keywords
Knowledge Diffusion, Complex Networks, Social Networks, Temporal Networks
1. Introduction
Several areas of knowledge are based on the theory of analysis of social and complex networks to elucidate issues related to technology, biology, social sciences or even those related to the organizational context when it is necessary to under-stand multiple relationships among network components. Examples of these studies are found in [1]. The work of [2] presented models that statically de-scribe the structure and the relationships that exist in these networks. Networks for collaboration among scientific communities are also addressed by [1]; how-ever, the environment in which they are located suggests that the processes, me-chanisms, and rules that guide their behavior are best described by models that reflect the dynamics, such as temporal networks.
Changes in networks, in conditions of growth and evolution, or in the process of atrophy and disappearance are best described by temporal networks, given that vertices and edges appear and disappear over time under the influence of their environment. The static network model generates a snapshot or cross-section of the dynamic process that can be analyzed more naturally by a longitudinal study that addresses the time dimension. Therefore, visualizing transformations on a timeline is helpful in perceiving behavioral trends and creating better pre-dictions. In the field of social networks, an enriched view about the transforma-tion of the analysis variables is achieved when adding other attributes to the ver-tices of the networks. An example of an attribute is the organizational knowledge of project development teams treated as networks, whose vertices correspond to the people and whose edges describe the collaborative execution of projects. By studying network structures and behaviors, aggregating distinct types of know-ledge, a map that reflects the dynamics of the knowledge generated over time is obtained.
DOI: 10.4236/sn.2019.83009 124 Social Networking This article was guided by the following question: how has the creation and diffusion of knowledge evolved over time in networks formed by software main-tenance and development teams? To answer this question and choose the object of study, we selected the group of employees from the systems development area of a public service provider in the information and communication technology (ICT) area. From the information concerning the allocation of this group to software development and maintenance projects, we built a temporal network model, whose vertices are members of software development project teams and whose edges represent the knowledge exchange relationship in projects and are the units of analysis of the study. The study’s time window was limited to the pe-riod between 2007 and 2013. The purpose of the study was to analyze the tem-poral evolution of the creation and diffusion of knowledge in networks formed for executing software maintenance and development projects in a public pro-vider of ICT services—the Serviço Federal de Processamento de Dados (Federal Data Processing Service—SERPRO)—with the support of the methodology for analysis of social and complex networks. To achieve this objective, the following goals were set: a) to identify candidate areas to participate in the study of the or-ganizational structure, b) to obtain data and structure the temporal network that represents relationships among participating members of software development and maintenance projects, and c) to analyze the dynamics of the knowledge cre-ation and diffusion process based on the data obtained from the temporal net-work.
For organizations, it is vital to understand and enable the sustainable creation and diffusion of knowledge. A thorough understanding of this process, aided by techniques for analyzing social and complex networks, facilitates the cross-refer- encing of statistical data to quantitatively and qualitatively demonstrate the cur-rent state and evolution of the creation and diffusion of knowledge. Conse-quently, different possibilities of analysis arise for managing and planning knowledge-based organizational activities and for making more realistic fore-casts. This approach helps to clarify issues related to the planning of the organi-zational cognitive process and to make visible information that would otherwise be hidden.
This article has six sections: the first is the introduction; the second provides the theoretical support for the work; the third describes the methodology and the analysis model; the fourth describes the research environment and characte-rizes the structure of the networks; the fifth discusses the results; and finally, the sixth section presents the conclusions.
2. Social and Complex Networks
com-DOI: 10.4236/sn.2019.83009 125 Social Networking plex social network as a finite set formed by actors and the existing relationships between these actors. The same authors consider the actors and their relation-ships to be interdependent, which results in an analysis perspective that sees the whole rather than the parts. In [5], there is an understanding that the links be-tween actors are channels for the transfer of resources perceived as both tangible and intangible, such as information and the exchange of knowledge. Network models that focus on individuals visualize the network structure as a source of opportunities or constraints for individual actions. Finally, the aforementioned authors clarify that network models help to understand structures, whether so-cial, political, economic or from other categories. Such classes behave as patterns of relationships between the actors, and they help build a particular perspective of the network, which depends on the objectives of the analysis. By changing the focus and level of analysis, both the approach that influences the methods and the results obtained will change. The aforementioned authors adopt graphs as a means of describing social networks, which are abstractions used to represent a system containing discrete and interconnected elements. Each vertex of a graph represents an individual component of the network, whereas each line that in-terconnects vertices describes the relationship between them. These lines, so-called edges, are classified as directed or undirected. Undirected edges indi-cate a symmetrical relationship between the vertices, whereas directed edges in-dicate asymmetry in the relationship.
Despite the existence of multiple factors motivating the relationship between two vertices in a network, opting for a single approach facilitates the analysis. This allows observation of networks based on friendships or affinities between members of a social group. The same set of network-forming elements is ob-served from the perspective of the professional relationships existing among its members, which may change the topology or structure of the network. In sum-mary, a network is a collection of elements called vertices, interconnected with each other by lines or edges. The type of network and the motivation underlying the links between the elements or vertices vary according to the category of the network and the objectives or causes that led to its formation. Additionally, the definition of a network itself is very close to our understanding of the concept of a system. The work of [6] provides a definition of a network including the time dimension:
( )
{
( ) ( ) ( ) ( )
, , :}
,G t = N t L t f t J t
in which
t = time (which can be either simulated or real); N = number of vertices or actors;
L = links between the vertices or edges;
f: N × N = mapping function that connects pairs of vertices, resulting in a cer-tain topology;
DOI: 10.4236/sn.2019.83009 126 Social Networking Both [6] and [7] agree that these networks are categories of systems, consi-dering the vertices to be the components and the relationships between the components to be the edges, given that the very definition of the system implies that this set of interconnected components will have one or more objectives. When studying networks, it is important to take into account the objectives which contribute to link the network vertices to each other, such that an analysis perspective is defined in accordance with this purpose. Upon indicating that networks can be classified based on their nature and their members, [8] argues that describing the structure of networks is not an impossible task; however, it requires a great deal of information to make the description more complete. In this study, we analyzed networks, considering one of their objectives to be the creation and diffusion of knowledge necessary to do the work of building and maintaining software—the components of the networks are project team mem-bers. This characterizes these structures as social networks. The motivation for the relationships among team members is the exchange of knowledge related to the tasks that compose the work developed in projects.
2.1. Network Attributes and Metrics
re-DOI: 10.4236/sn.2019.83009 127 Social Networking main stable and efficiently fulfill its objectives, even when part of it suffers some type of loss, in terms of either its vertices or the relationships between them. In this present study, for the purpose of analysis, measures that enable evaluation of structure, dynamism, topology, power, and stability are considered. Table 1 shows and details these characteristics, and presents the analysis model that links the collected data to the theory for the subsequent presentation of the results.
For [9], there is a great deal of information embedded in the structure of net-works, which is determinant for understanding the behavior of a network and forms a set of metadata translated into metrics and statistical indicators. On the other hand, the structures of networks are important factors that influence the dissemination of information among the network components and consequently influence the creation and diffusion of knowledge. In the latter case, it is the in-formation that flows through the network, not inin-formation in the network itself. For [6], the structure of the networks refers to the configuration or arrangement between the vertices and the edges. This configuration influences the behavior of networks, and the arrangements address to quantitative and qualitative aspects. This makes possible to evaluate the quantity and quality of the information flow in accordance with this structure. The classification of networks according to the structure comprises four categories: a) regular, b) random, c) small-world, and d) scale-free. In this topological classification, when the mapping of a function f that relates edges and vertices occurs uniformly, we have a well-structured or regular graph. At the opposite extreme (the distribution being random), we have a random graph. For [6], between the two extremes are the scale-free and small-world topologies.
The structure of graphs yields to their classification. On one side are random graphs, and at the opposite extreme are regular graphs. Random graphs have a
Table 1. Summary of the analysis model.
Object/Structure Concept Attribute Authors
Complex networks
Structure
Number of vertices [6] [17] Entropy [6] [13] [14] Number of components [6] [11]
Modularity [11] [12] No. of communities [11] [12] [15]
Distance— Propagation and
diffusion of knowledge
Average clustering coefficient (Cws) [10] Average shortest path (L) [6] [10]
Average degree
<k> [16] [17]
Social networks
Cohesion Density [6]
Diameter [6] [11] [17]
Centrality (Power)
DOI: 10.4236/sn.2019.83009 128 Social Networking homonymous structure, whereas regular graphs have a purely deterministic struc-ture. Between these two extremes are two important classes: small-world (pre-dominantly structured but partly random) and scale-free (pre(pre-dominantly ran-dom but partially structured). Each class has its characteristics: the Poisson dis-tribution for random graphs and the power law disdis-tribution for scale-free graphs. Small-world networks are characterized by the average clustering coeffi-cient and the average shortest path, whereas regular graphs have a zero entropy value, in accordance with [6] [10].
On the other hand, such networks are not static structures and are in full transformation. This dynamic occurs in both their structure and behavior. In both cases, mutual influence of the two types of change can occur, such that structural changes alter the behavior of the network and conversely this altera-tion in behavior causes changes in the structure. The study of these variaaltera-tions or changes considered in the time dimension gives rise to temporal networks. A new network configuration may emerge from this process of change. Changes in the network contribute to the generation of new knowledge. The emergence concept of complex networks is responsible for new structures that emerge from preexisting configurations. Power structures, identified during the study of the relationships between network members, can arise from these new configura-tions. An example of these structures is the formation of concentrators of con-nections or edges in the network, known as hubs. Referring to the organizational cognitive process, these hubs are foci of knowledge retention, and they represent risks to the organization if they are suddenly withdrawn from the network, re-sulting in loss of knowledge. Therefore, it is important to identify them and find methods to distribute and socialize the concentrated knowledge, to ensure the network’s operationality in terms of the execution of effective work based on this knowledge. The stability and robustness of the network relate to the power structures and to the formation of hubs. These concepts refer to the ability to keep networks operational in the event of occurrences that may cause significant changes in their structures and may eventually destroy them through the neutra-lizing withdrawal of these hubs. Thus, studying and understanding networks’ propensity for this type of event, in addition to evaluating their recovery capaci-ty, are important actions derived from the research reported in this article.
2.2. Organizational Cognition and Formation of Networks
DOI: 10.4236/sn.2019.83009 129 Social Networking network structures created to execute projects and to identify and solve prob-lems.
Among the organizational actions observed, we highlight the adoption of process management models focused on the information technology area; ex-amples include the Capability Maturity Model Integrated (CMMI®) and a project management model based on the best practices proposed by the Project Man-agement Institute (PMI®), consolidated in the Project ManMan-agement Body of Knowledge (PMBOK®). These models enabled the collection of data for the study, taking into account that one of the premises that are the basis of both models is the documentation of the organizational processes in all phases, gene-rating explicit knowledge about the process. Finally, we emphasize that organi-zational knowledge, as we address here, consists of the use of data and informa-tion directed toward the resoluinforma-tion of problems, in the same sense that can be found in [18] as the authors explain that knowledge is the result of active use of information. This concept applies at the individual level, at the work-team level, at the level of formal and informal networks, and at the organizational level. Knowledge-generating sources in large part use the organizational structure and environment, which enable the flow of information communicated through or-ganizational documents; through information systems, as described by [20] through social interaction; and through the formation of knowledge networks.
3. Research Environment
The data collection was performed at SERPRO—a public provider of ICT ser-vices of the Brazilian federal government. The collection was restricted to the software development area of the city of Salvador, considering the networks formed by project teams. The information system used to record the time spent on work related to the software development and maintenance projects in the company between January 1, 2007 and December 31, 2013 was the main source of data. The allocation record that informs the type of work performed by a par-ticular project team member contemplated the project in which the employees worked during the reported period, the time in hours related to the work per-formed, and the type of activity performed. This activity is related to one of the five knowledge areas considered in this present study: software development, project management, development process management, business area, and training. We obtained the allocation record data of 264 people and 5067 projects. We obtained the networks by partitioning the complete adjacency matrix that portrayed the network in the period from 2007 to 2013 based on a time interval of one year, which resulted in data for seven years. The data represented seven years of work relative to software production and maintenance. The partitioned adjacency matrices were structurally equivalent and such condition allows com-parisons between them.
DOI: 10.4236/sn.2019.83009 130 Social Networking and the other to the people allocated to them. After partitioning the complete network by year, we generated projections that describe the interactions between people over the period of one year, in the work related to the execution of the projects. From this, we generated undirected networks, since we consider that the exchange of knowledge occurs in both directions. The calculations of the in-dices were performed using the Gephi1 software package, described by [21], and
MS-Excel as support tools. From the software package, Pajek we generated ran-dom networks for each year and subsequently exported those networks to Gephi to maintain the consistency of the calculations based on the same methods and algorithms used for the networks generated from empirical data. During the pe-riod considered for data extraction, the organization used management and go-vernance models applied to the managing of the software development process based on the CMMI®, This method that [22] describe related to the project management process based on the approach consolidated by the Project Man-agement Institute (PMI®) and detailed by [23] in the Project Management Body of Knowledge (PMBOK®). The use of these models enabled the storage and re-trieval of data regarding the allocation of people to the projects, because the do-cumentation of each step of the procedures was the recommended practice in the norms derived from those models, at the time of execution of the projects.
4. Materials and Methods
The analysis model presented in Table 1 was used to study and discuss the re-sults based on the data collected. The model was structured based on the catego-rization of two groups: complex networks and social networks, and there could be attributes common to both groups. The table presents the concepts and attributes specific to each of the network types, in addition to those common to both types. Additionally, the table indicates the sources used to study concepts, discuss and perform analyses. The concepts refer to the structure of the net-works and to the reflections of this structure on the creation and diffusion of organizational knowledge. Thus, we evaluated the number, the degree of specia-lization and generaspecia-lization of the components of the networks, the capacity for propagation and diffusion of knowledge based on the measure of the distance between members, and the levels of cohesion and centrality that influence the creation and diffusion of organizational knowledge.
The method described in this paper seeks to present a set of attributes that make up the network structure, with the objective of studying how those attributes contribute to the knowledge creation and diffusion. Each one of these attributes can be further analyzed to understand the dynamic process of know-ledge exchange within networks composed of members of the software devel-opment team over the years considered in the study. Our method differs from similar studies mainly because it considers a longitudinal perspective applied to the network analysis instead of having a “snapshot” of the scenario under study. In comparison with other studies, we can highlight that our method seeks to
DOI: 10.4236/sn.2019.83009 131 Social Networking velop a consistent and systematic approach applied to organizational learning and organizational knowledge creation. In this sense, our method shows a new perspective of analysis based on the arrangement and structure of these attributes, as they are combined in a model that serves as a filter to study and understand how teams develop, create and exchange knowledge.
[24] developed an exploratory study to understand the role of social capital in terms of knowledge networks and network behavior in large-scale software de-velopment projects. Their study was conducted as a multicase involving two or-ganizations. Their results showed that social capital and networking are essential factors for teams when solving complex and unfamiliar interdependent tasks. The referred authors concluded that companies should cultivate a network cul-ture to strengthen social capital and consequently improve performance. Com-pared to our study, [24] identified a set of factors of influence over team external knowledge networks and networking behavior but did not deepen their study in terms of the network structure. They gathered and studied indirect and external factors based on observation and also on data collection based on surveys built to understand the network behavior of individual teams.
They also identified three categories of knowledge, namely: a) product-related knowledge; b) process related knowledge; and c) project related knowledge. These findings converge to our research as we also identified the same categories which in our study are part of a larger set including business-related knowledge and training related knowledge.
[25] developed a study based on multiple knowledge networks, applied to synthetic biotechnology. Although in that study, the referred author treats about that specific kind of knowledge, they do not emphasize and demonstrate this evolution in a time scale framework. Also, [26] highlights the importance of teamwork quality process on project success in software development. But they do not tackle the formation of networks in the process of software development and do not treat this formation considering a longitudinal study. Thus, our ap-proach presents a more systematic and structured method, based on data col-lected over seven years, resulting in a more comprehensive set of network attributes used to understand the dynamics of knowledge sharing and creation.
The number of vertices is a basic metric that, despite providing little informa-tion when considered alone, helps in the construcinforma-tion of other metrics. From the point of view of the creation and diffusion of organizational knowledge, this value describes the productive potential. In other words, this metric is the supply of the human resources that make up the network and are potentially prepared to generate and disseminate knowledge, accounting for part of the organization’s intellectual capital. In principle, the higher the number of vertices, the greater this potential is. However, an excessive number of vertices may result in in-creased communication noise, an inin-creased need for managerial control, and consequently a decrease in productivity and knowledge generated and shared.
DOI: 10.4236/sn.2019.83009 132 Social Networking The degree ki of a vertex i is defined as the number of edges in the graph
inci-dent on vertex i. When analyzing a network focusing on the dissemination of knowledge, this indicator serves to evaluate the importance of vertices that have a degree above the average and to characterize the network according to the dis-tribution presented. For [16], the degree concept is the most fundamental cha-racteristic and measure of a vertex in a network, which can be defined in differ-ent manners. The degree of a vertex i in an undirected network is defined as the number ki of the existing edges. Thus, an isolated vertex has a degree of zero.
The average degree of a graph, denoted by <k>, is the average value of all the degrees of vertices ki considering all the vertices of the graph.
For [6], the components are isolated subgraphs within the network. In an or-ganizational cognitive process, this isolation is equivalent to the formation of an island of knowledge. A high number of components may indicate that the process for knowledge creation and diffusion is fragmented and that knowledge does not flow properly. [11] clarifies that a connected network is one in which there is at least one path from any vertex that enables any other vertex to be reached. In this case, the network has only one component. Additionally, ac-cording to [6], the density is the ratio between the total number of edges present in the graph and the largest possible number of edges for the graph. The density is a value between zero and one and measures the completeness of a graph—a complete graph is considered to be one in which all the possible edges are con-nected to the vertices, in which case the density is equal to one. In a totally dis-connected graph, in which no vertex has any connection, the density is equal to zero. From the point of view of the creation and diffusion of knowledge, a graph with a high density has a greater probability of diffusion and exchange of know-ledge due to the high number of connections between its vertices forming alter-native paths for the exchange of knowledge.
Regarding the network’s diameter, [6] explains that the longest path between two vertices of a graph G represents its diameter. According to [17], the diame-ter of a graph is the length of the longest geodesic path between any pair of ver-tices in the network for which a path actually exists. A small diameter value is one of the indications of the small-world effect observed in many complex net-works [11]. According to [10], the average clustering coefficient (Cws), together with the average value of the shortest path, may indicate a small-world effect. This latter metric reflects the manner of vertices insertion in their neighborhood. The average value of the clustering coefficient gives a general indication of the clustering of vertices in the network. Still regarding the issue of knowledge dis-seminated in the network, the small-world effect can result in a rapid diffusion of information in the network and reflect a high capacity for adaptation of the network to the environmental changes and to the demands imposed on it, simi-lar to that which occurs in the biological networks described by [11].
DOI: 10.4236/sn.2019.83009 133 Social Networking community compared to the edges that interconnect the existing communities in the network, in accordance with [11] and [12]. Modularity, in the context of the creation and diffusion of knowledge, indicates the specialization in an area of knowledge, locally. This specialization can help in addressing network complex-ity, improving efficiency, and facilitating control. Unlike the components, which are isolated subgraphs, the modules communicate with each other and can even work in a coordinated manner to achieve a common goal. Regarding the forma-tion of communities, [11] also emphasizes that they are natural divisions within the networks, which form groups of vertices known as clusters. For the referred author, the communities identified can help to understand the nature of the so-cial interactions within these formations.
For [13], the measure of the complexity of a mathematical object such as a graph is related to its structure. In this case, the complexity described by the au-thors does not directly address computational costs but rather gives an idea of the internal structural organization of the object studied. The approach adopted by the referred authors seeks to find structure indexes based on the same entro-py metric adopted by [14]. Alongside the degree distribution sequence, the en-tropy helps to understand the network structure, as indicated by [6]. In a simpli-fied and intuitive manner, the latter author characterizes the structure of a graph based on its degree distribution sequence, associated with the measure of entro-py. For [6], the effects of the small-world structure, for example, the clustering and the short average path length, are consequences of the networks’ ability to respond quickly to a disturbance in the environment. The rapid and efficient reactions observed in protein networks with short redundant paths in biological networks, in addition to highly clustered local clusters, are both properties of networks of the small-world model. It is as if biological networks organize themselves to be as receptive as possible, thus ensuring a short average path length. The same author emphasizes that clusters may be a consequence of this modularity.
DOI: 10.4236/sn.2019.83009 134 Social Networking which leads to new network configurations. In [11] it is explained that unlike other measures of the centrality the intermediation centrality does not reflect the number of connections of a vertex. In contrast, it measures how well a vertex is placed between the other vertices to facilitate communication between them. Thus, a vertex can have a low degree, connect to others that also have a low de-gree, and have a long average minimum path but still have a high intermediation centrality. This type of vertex is important because of its intermediate position in the path between other vertex groups, helping to improve connections and the overall network cohesion. Such a strategic position can benefit the transmission of information and dissemination of knowledge.
5. Results and Discussion
Below, we analyze the indicators listed in Table 1 for the period between 2007 and 2013. The values reported were calculated with the aid of the Gephi software package, year-by-year, thus enabling temporal analysis of the data, excluding the entropy calculations, which were performed using MS-Excel.
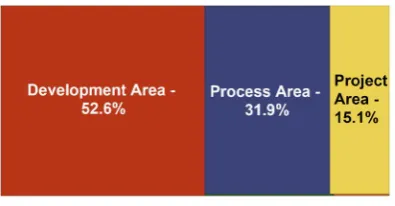
Based on the network structures formed during the seven years considered, we were able to identify the five main categories of knowledge generated, disse-minated, and shared during the development and maintenance process of the systems of the organization under study. By analyzing the evolution of know-ledge in the period considered, we observed that the percentage of knowknow-ledge produced in each of the five areas considered (development, process, projects, business, and training) accompanied the evolution of the number of vertices in the network, which seems to indicate consistent productivity over the period. The basis supporting this argument was constructed via calculation of the ratio between time allocation per area of knowledge and the number of vertices in the network for the year analyzed. The development knowledge area represented, on average, approximately 54% of the total knowledge produced and disseminated during the seven years considered. Process management accounted for a share of approximately 30%, whereas the areas of project management and business cor-responded to approximately 16 and 0.02%, respectively. Training, which covers various other categories of knowledge, represented approximately 32% in the period. Figure 1 shows the distribution map of knowledge in 2007.
The graph in Figure 2 shows the accumulated values per year for the period considered in this present study. By observing the graph, we find that the devel-opment knowledge area stands out from the others, and this pattern persists throughout the period. The proportionality between the areas remained almost constant over the seven years. The graph shows that the processes knowledge area presented little variation in the cumulative volume between 2009 and 2012 but decreased in 2013.
DOI: 10.4236/sn.2019.83009 135 Social Networking
Figure 1. Distribution map of the areas of knowledge
for 2007.
Figure 2. Cumulative work time by knowledge area from 2007 to
2013.
had two components. This exception did not indicate a considerable deviation, taking into account that many small-sized and low-complexity projects were ex-ecuted over the time. One possible justification for this configuration may be the fact that even in projects in which only one team member is responsible for the planning and execution of the activities, the fact that the company used devel-opment process management and project management models meant that there was the interaction of this single team member with members of teams from other areas (e.g., the testing and software quality areas, or even from the peer re-view area), which forces the exchange of knowledge through the interaction of people from different knowledge areas.
[image:14.595.257.494.214.369.2]know-DOI: 10.4236/sn.2019.83009 136 Social Networking ledge, such that the more cohesive a network is, the greater the chances of more equanimous diffusion of the knowledge. From the point of view of the diffusion of knowledge, denser clusters of the network, which form modules, represent a more intense degree of communication and exchange of knowledge among the connected members and, in contrast, a low connection with the rest of the net-work. Thus, we expect that there is an inverse relationship between the overall density of the network and the degree of modularity. This hypothesis was proven for the networks in question via the result of the correlation calculation, whose value of −0.736555797 indicated a strong inverse correlation between the density and modularity.
When calculating the correlation between modularity and each of the know-ledge areas considered, we verified that except for the “business” and “training” knowledge areas, which had values of −0.778626079 and −0.666689658, respec-tively, the other knowledge areas (development, processes, and projects) did not have significant negative correlation values. When analyzing the data, we in-ferred that although the time allocation values were cumulative by knowledge area, the formations of modules were not necessarily densification groups per knowledge area. Although modularity may contribute to the development of certain types of knowledge, given that it relates to the specialization of activities, we cannot prove this assertion based on the data and values obtained by this present study. Since the execution of the projects involves multiple knowledge areas that integrate in a coordinated manner to perform the work, the forma-tions of modularity may have a mixed character in terms of the type of know-ledge involved. Additionally, the cumulative amounts of knowknow-ledge per area seem to depend more on the number of project demands and on the characteris-tics of each project than on these module formations. The algorithm for calcu-lating modularity that was used in the Gephi software is described in [15]. Re-garding the calculation of the modularity values, [12] clarify that in random network formation structures, the calculated value for the modularity, Q, ap-proaches zero. Values close to 1, which is the maximum value, indicate that there is a strong formation of communities in the network. Typical values found in real networks range from 0.3 to 0.7.
DOI: 10.4236/sn.2019.83009 137 Social Networking values for time spent per knowledge area for each of the years considered.
[image:16.595.70.536.298.706.2]The cumulative knowledge by area and measured indirectly via the level of al-location of people to the projects indicated a consistent evolution with the net-work structures identified in the period. The greatest amount of knowledge was related to the development of systems, linked to the core area of the processes of the organization studied. The second-largest knowledge area concerns the man-agement processes for software development and maintenance, followed by the project management area. The two areas with the lowest amounts were training and business, in that order. In the latter area, which represents an important type of knowledge for the organization, the reduced number of allocations is jus-tified, considering that the organization’s business area had been centralized and was formally detached from the development area, being represented indepen-dently in the organizational structure.
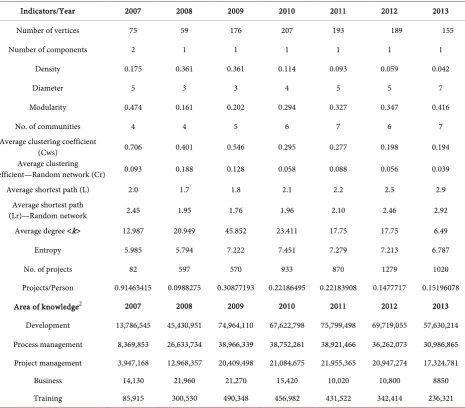
Table 2. Main indicators calculated for the networks in the period from 2007 to 2013.
Indicators/Year 2007 2008 2009 2010 2011 2012 2013
Number of vertices 75 59 176 207 193 189 155
Number of components 2 1 1 1 1 1 1
Density 0.175 0.361 0.361 0.114 0.093 0.059 0.042
Diameter 5 3 3 4 5 5 7
Modularity 0.474 0.161 0.202 0.294 0.327 0.347 0.416
No. of communities 4 4 5 6 7 6 7
Average clustering coefficient
(Cws) 0.706 0.401 0.546 0.295 0.277 0.198 0.194 Average clustering
coefficient—Random network (Cr) 0.093 0.188 0.128 0.058 0.088 0.056 0.039 Average shortest path (L) 2.0 1.7 1.8 2.1 2.2 2.5 2.9
Average shortest path
(Lr)—Random network 2.45 1.95 1.76 1.96 2.10 2.46 2.92 Average degree <k> 12.987 20.949 45.852 23.411 17.75 17.75 6.49
Entropy 5.985 5.794 7.222 7.451 7.279 7.213 6.787
No. of projects 82 597 570 933 870 1279 1020
Projects/Person 0.91463415 0.0988275 0.30877193 0.22186495 0.22183908 0.1477717 0.15196078
Area of knowledge2 2007 2008 2009 2010 2011 2012 2013 Development 13,786,545 45,430,951 74,964,110 67,622,798 75,799,498 69,719,055 57,630,214 Process management 8,369,853 26,633,734 38,966,339 38,752,261 38,921,466 36,262,073 30,986,865 Project management 3,947,168 12,968,357 20,409,498 21,084,675 21,955,365 20,947,274 17,324,781
Business 14,130 21,960 21,270 15,420 10,020 10,800 8850 Training 85,915 300,530 490,348 456,982 431,522 342,414 236,321
DOI: 10.4236/sn.2019.83009 138 Social Networking We observed that the networks constructed in the period of the study belongs to the category of scale-free networks, given that the prerequisites that help cha-racterize them were satisfied in all of the observed years. We verified the exis-tence of a small number of vertices that form hubs, which is a sign of the con-centration, production, and diffusion of knowledge more intensely in a relatively small number of points of the network compared to the total vertices of each year. When the degree distribution of a network follows a power law, the net-work is referred to as scale-free. In this case, during the dynamic and evolutio-nary transformation process, there is a high probability that new vertices will connect to those vertices that have a high degree value. In other words, the high degree vertices tend to maintain this status, attracting new vertices. Thus, the network will have a small number of vertices with a high degree and a large number of vertices with a low degree. In the seven years considered, the net-works studied had a scale-free configuration. From the knowledge diffusion perspective, we can interpret that a high concentration of knowledge will occur around a reduced number of vertices that act as hubs. Regarding robustness, this network category represents the stability when vertices are randomly removed. However, in the case of selective removal directed at the hubs, the network may become disrupted.
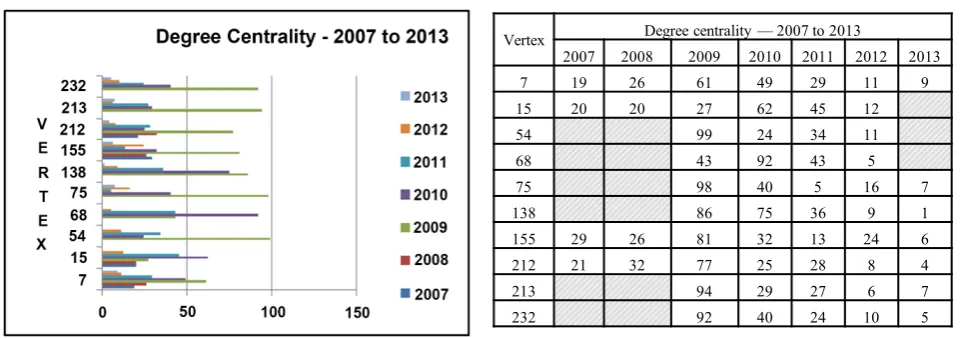
We considered the study of the degree, proximity, and intermediation central-ities that are directly related to the analysis of the formation of hubs in the net-work. All are considered to be factors that influence knowledge diffusion. In the first case, as already stated, there is a high probability that few people will come to acquire a high level of knowledge that will tend to spread around the hub ver-tices. On the other hand, it was verified that the networks studied had a high lev-el of connectivity, represented by the component indicator value, which was one for 2008 to 2013 and two for 2007. Due to this characteristic, there is the possi-bility of knowledge diffusion via alternative paths or routes that extrapolate the hubs’ limits of influence. Thus, the indicators of intermediation and proximity centrality have a relevant role in the diffusion of knowledge. The indicators of degree, proximity, and intermediation centrality were calculated and later or-dered considering the sum per indicator for each vertex in each year until ob-taining the totals for the seven-year period. Figures 3-5 show the results, in des-cending order, for the ten highest values for each of the three indicators. Figure 3 shows the results of the calculations of degree centrality.
DOI: 10.4236/sn.2019.83009 139 Social Networking
Figure 3. Degree centrality from 2007 to 2013.
vertices with higher degree centrality, by comparing the type of knowledge asso-ciated with each one of them, one can make inferences about the creation and diffusion of the knowledge. Analyzing the distribution of allocations by know-ledge area for vertex 7, we verified that 99.82% of the allocation time was dedi-cated to process management, 0.17% of the allocation time was dedidedi-cated to project management, and 0.01% of the total allocation time was used for train-ing. Vertex 15 had the following distributions of allocation time per knowledge area: 97.99% for development, 0.28% for process management, 1.72% for project management, and 0.01% for training. Vertex 54 had 99.87% of the time dedicat-ed to process management, 0.12% to project management, and 0.02% to train-ing. Vertex 68 had 95.56% of the time dedicated to the development, 0.76% to process management, and 3.68% to project management. For the purpose of classifying and analyzing the type of knowledge and the time dedicated to each knowledge area by each team member, we considered that the professionals who have an allocation time in the development area that was significantly higher than the time dedicated to other areas are professionals who are dedicated to the development area. On the other hand, those that were not allocated to the de-velopment area were considered to be from the process management or project management area. Those whose dedication was shared equally between the areas of development and processes or projects were considered to be hybrids in terms of the area of activity. It could be observed that for this group of vertices, those working in the development area dedicate part of the time to the processes and projects areas and, eventually, to the areas of training and business. However, people whose main area of work is process management did not have a signifi-cant level of time spent in the development area. This configuration has a high potential for insertion in other knowledge areas for those team members whose main activity is related to the development area. These people are important vectors for dissemination of information and diffusion of knowledge. On the other hand, the activities performed by those professionals more dedicated to the areas of process management and project management means that they partici-pate in a range of extensive and diversified projects. Thus, although their
know-Vertex Degree centrality — 2007 to 2013
2007 2008 2009 2010 2011 2012 2013
7 19 26 61 49 29 11 9
15 20 20 27 62 45 12
54 99 24 34 11
68 43 92 43 5
75 98 40 5 16 7
138 86 75 36 9 1
155 29 26 81 32 13 24 6
212 21 32 77 25 28 8 4
213 94 29 27 6 7
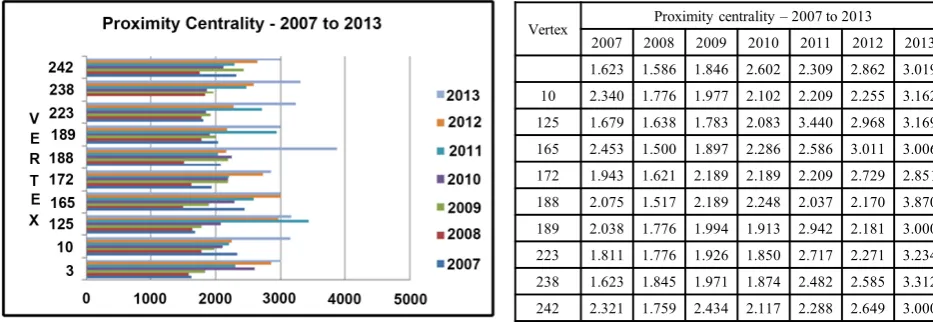
DOI: 10.4236/sn.2019.83009 140 Social Networking ledge focus on management areas, they have the possibility of exchanging knowledge intensely, given that there is a distribution of the work via the projects in execution. This scenario is favored by the use of the process man-agement models and projects because the activities advocated by these models involve significant interaction between the areas of development and manage-ment and processes and project managemanage-ment. Figure 4 shows the evolution of the proximity centrality.
Given that this metric is related to the importance of each vertex as an inter-mediary in the passing of information, it helps identify team members who are knowledge transmitters. The figure shows the ten main vertices in descending order, in accordance with the proximity centrality.
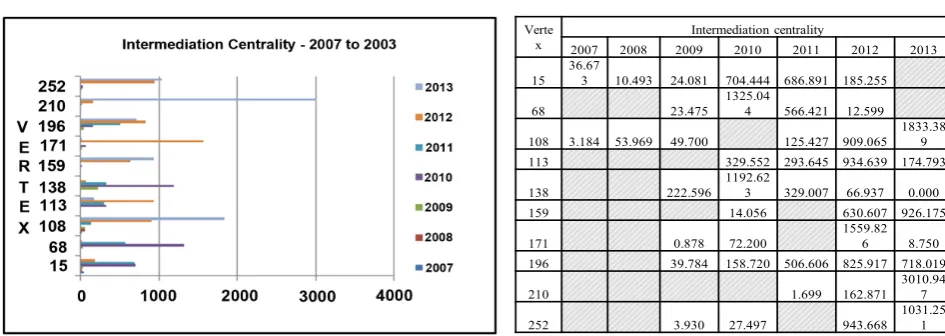
Finally, the graph and table of Figure 5 describe the vertices with the highest values for the intermediation centrality indicator in the period of the study. The intermediation centrality concerns the ability of certain vertices to place them-selves in strategic positions and to make the connection indirectly between other vertices that would not otherwise have any kind of relationship with each other. From the perspective of the creation and diffusion of knowledge, the vertices with a high intermediation centrality value play an important role as mediators of knowledge exchange.
[image:19.595.61.528.543.704.2]Of the ten vertices with the highest degree of intermediation centrality, we ve-rified that only vertices 15, 68, and 138 formed an intersection with the group of vertices with the highest degree centrality. Additionally, the three highlighted vertices developed activities in the areas of development, process management, and project management and possess a high degree of knowledge diversification. The other vertices shown in Figure 4 are not included in the list of those with a higher level of degree centrality, which reinforces what [11] describes by disso-ciating intermediation centrality from degree centrality. The intermediation centrality of vertices 15, 68, and 138 reflects diversification characteristics of the team members, and it is understood that these vertices, besides possessing knowledge that encompasses various areas, are relevant due to knowledge in-termediation, acting as bridges between different groups.
Figure 4. Proximity centrality from 2007 to 2013.
Vertex Proximity centrality – 2007 to 2013
2007 2008 2009 2010 2011 2012 2013
1.623 1.586 1.846 2.602 2.309 2.862 3.019
10 2.340 1.776 1.977 2.102 2.209 2.255 3.162
125 1.679 1.638 1.783 2.083 3.440 2.968 3.169
165 2.453 1.500 1.897 2.286 2.586 3.011 3.006
172 1.943 1.621 2.189 2.189 2.209 2.729 2.851
188 2.075 1.517 2.189 2.248 2.037 2.170 3.870
189 2.038 1.776 1.994 1.913 2.942 2.181 3.000
223 1.811 1.776 1.926 1.850 2.717 2.271 3.234
238 1.623 1.845 1.971 1.874 2.482 2.585 3.312
DOI: 10.4236/sn.2019.83009 141 Social Networking
Figure 5. Intermediation centrality from 2007 to 2013.
We consider that team members whose greatest dedication is to the develop-ment area are experts regarding the type of specific activity related to the project, which corresponds to the analysis and development of systems in a given lan-guage. Normally, such professionals focus on a set of tools that supports the de-velopment process, involving programming languages and databases, and they participate in a lower number of projects compared to professionals in the areas of process management and project management. On the other hand, profes-sionals from the development area transit easily in other knowledge areas. De-spite participating in a large number of projects, the professionals dedicated to the areas of project and process management do not have a great capacity for diversification among the knowledge areas, in most cases, they keep performing tasks related to management processes. The graph in Figure 1, which shows the cumulative allocation values per knowledge area, does not allow for a compara-tive analysis between areas. The dispersion graph of Figure 6 compares the allo-cation values of team members in activities related to the development area and the process area. The diagonal line passing through the origin of the graph, and the lines dividing the plot area into four quadrants were added to aid and refer-ence the analyses. The vertical axis of the graph reflects the values of the devel-opment area, whereas the horizontal axis corresponds to the values of the process area.
The points below the diagonal are the vertices of the network that had a number of allocations in the process knowledge area proportionally greater than the amount of time allocated to the development area, whereas the points above the diagonal are vertices that totaled a proportionally greater number of hours in activities related to the development knowledge area, as opposed to the process area.
The points on or near the diagonal line represent a balance between the two areas mentioned. The points in quadrant A are those whose allocation level is low for both the development area and the process area. The points in quadrant B indicate allocations that are predominantly high for processes but lower for development. In quadrant D are those vertices whose allocations predominate
Verte
x 2007 2008 2009Intermediation centrality2010 2011 2012 2013
15 36.673 10.493 24.081 704.444 686.891 185.255
68 23.475 1325.044 566.421 12.599
108 3.184 53.969 49.700 125.427 909.065 1833.389
113 329.552 293.645 934.639 174.793
138 222.596 1192.623 329.007 66.937 0.000
159 14.056 630.607 926.175
171 0.878 72.200 1559.826 8.750
196 39.784 158.720 506.606 825.917 718.019
210 1.699 162.871 3010.947
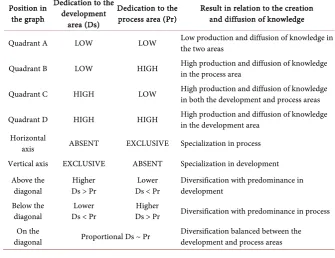
DOI: 10.4236/sn.2019.83009 142 Social Networking for the development area, whereas in quadrant C, there are high allocations for both development and processes. In this last quadrant, there are the vertices that are members of teams with greater versatility, evidenced by the diversification of activities, performing tasks in both the development area and the process area. The points that lie on the vertical axis (development) or on the horizontal axis (processes) correspond to those people specializing in only one of these two areas, and therefore they have a low level of diversification. In Figure 6, we can see that there is a predominance of vertices in quadrants A and B, which means a greater allocation in the processes area. We observed a significant number of points near the horizontal axis for processes, which indicates a high specializa-tion in this area. Table 3 summarizes the analysis structure and reports the
Figure 6. Dispersion graph of the development and process management
areas of knowledge in 2013.
Table 3. Analysis of the dispersion graph for the knowledge areas.
Position in the graph
Dedication to the development
area (Ds)
Dedication to the
process area (Pr) Result in relation to the creation and diffusion of knowledge
Quadrant A LOW LOW Low production and diffusion of knowledge in the two areas
Quadrant B LOW HIGH High production and diffusion of knowledge in the process area
Quadrant C HIGH LOW High production and diffusion of knowledge in both the development and process areas
Quadrant D HIGH HIGH High production and diffusion of knowledge in the development area Horizontal
axis ABSENT EXCLUSIVE Specialization in process Vertical axis EXCLUSIVE ABSENT Specialization in development
Above the
diagonal Ds > Pr Higher Ds < Pr Lower Diversification with predominance in development Below the
diagonal Ds < Pr Lower Ds > Pr Higher Diversification with predominance in process On the
[image:21.595.203.539.472.730.2]DOI: 10.4236/sn.2019.83009 143 Social Networking results evaluation, comparing the main areas of knowledge, that is, the develop-ment area with the process area.
6. Conclusions and Final Considerations
This article analyzed the temporal evolution of the process for the creation and diffusion of knowledge in networks formed for the execution of software main-tenance and development projects in a public organization that provides services in the ICT area. The area responsible for software development and maintenance was selected to extract the necessary data for the construction of the networks. The data obtained enabled dynamic analysis, in the time dimension, of the main attributes and metrics, as we described in the analysis model. It was possible to analyze the cognitive process of the organization, mainly considering the identi-fication, retention, development, and sharing of knowledge.
Regarding the creation and diffusion of knowledge, it can be inferred that such networks have structural and behavioral aspects that facilitate the diffusion of organizational knowledge. The structure of the networks seems to favor communication and the exchange of knowledge, given that there is a high level of connectivity among their members. This level can be measured by the degree, proximity, and intermediation centralities. Except for the year of 2007, there was no evidence of fragmentation or formation of islands of knowledge, which con-tributed positively to the flow of knowledge. The analyses based on the empirical data describing interactions among project team members indicated that the networks have a structure compatible with the small-world model. One of the observed characteristics related to this type of network was the diameter. We no-ticed that the diameter of the networks was compatible with the small-world model, which can facilitate the faster exchange of knowledge. The evolution of the knowledge produced and exchanged indicates compatibility with the number of vertices representing project team members and reveals a correct sizing of teams and an appropriate distribution of projects and tasks.
DOI: 10.4236/sn.2019.83009 144 Social Networking robustness is reinforced by the existence of redundancy and of various hubs holding the same type of knowledge; therefore, network attacks do not cause very large losses. These aspects of the study enabled determining that the net-works have a good capacity for retaining organizational knowledge. The tem-poral analysis of the networks enabled verification of the evolution and the transformation process of the networks in terms of the creation and diffusion of knowledge.
As recommendations for future studies, we suggest furthering of the present study by increasing the granularity of the data relative to the time dimension, thereby reducing the analysis time interval of the networks from one year to one semester or one month. Considering the increase in the granularity of the analy-sis period, one could concentrate on detailed visualization of the hours used for each type of knowledge, based on the structuring of specific networks by know-ledge type. Based on these structures, the network statistics can be reviewed via the same criteria used here and the results compared for the purpose of verifying the consistency of the model. Additional studies could advance analyses of the main indicators, such as degree, proximity, and intermediation centrality, in ad-dition to modularity. The results obtained in this present study could be com-pared with networks extracted identically for other sectors of the same organiza-tion or for other organizaorganiza-tions with similar structures. For the analyses of know-ledge types, an approach that considers the differences between the knowknow-ledge categories individually may reveal important issues, given that these categories have, in their essence, distinct forms of knowledge exchange, some of these cat-egories have a more generalist character and apply to practically all project types; examples include development process management and project management. On the other hand, the business and development areas address specific know-ledge and are thus more restrictive and specialized.
Conflicts of Interest
The authors declare no conflicts of interest regarding the publication of this pa-per.
References
[1] Andrade, M.T.T., Braga, P., Carneiro, T.K.G., Ribeiro, N.M., Moret, M.A. and Pereira, H.B.B. (2014) Contextualized Analysis of Social Networks: Collaboration in Scientific Communities. SocialNetworking, 2014, 71-79.
https://doi.org/10.4236/sn.2014.32009
[2] Sampaio, R.R., Rosa, C.P. and Pereira, H.B.D.B. (2012) Mapeamento dos fluxos de informação e conhecimento: A governança de TI sob a ótica das redes sociais.
Gestão & Produção, 19, 377-387.
https://doi.org/10.1590/S0104-530X2012000200011
[3] Masuda, N. and Lambiotte, R. (2016) A Guide to Temporal Networks. World Scien-tific Publishing Co., London.https://doi.org/10.1142/q0033
DOI: 10.4236/sn.2019.83009 145 Social Networking https://doi.org/10.1016/j.physrep.2012.03.001
[5] Wasserman, S. and Faust, K. (1994) Social Network Analysis: Methods and Applica-tions. Cambridge University Press, New York, Cambridge.
https://doi.org/10.1017/CBO9780511815478
[6] Lewis, T.G. (2009) Network Science: Theory and Applications. John Wiley & Sons, Inc., Hoboken, NJ. https://doi.org/10.1002/9780470400791
[7] Mobus, G.E. and Kalton, M.C. (2015) Principles of Systems Science. Springer-Verlag, New York.
[8] Estrada, E. (2011) The Structure of Complex Networks: Theory and Applications. Oxford University Press, New York.
[9] Kempe, D. (2011) Structure and Dynamics of Information in Networks. University of Southern California, Los Angeles, CA.
[10] Watts, D.J. and Strogatz, S.H. (1998) Collective Dynamics of “Small-World” Net-works.Nature, 393, 440-442.https://doi.org/10.1038/30918
[11] Newman, M.E.J. (2010) Networks: An Introduction. Oxford University Press, New York.
[12] Newman, M.E.J. and Girvan, M. (2003) Finding and Evaluating Community Struc-ture in Networks. Physical Review E, 69, Article ID: 026113.
[13] Mowshowitz, A. and Mitsou, V. (2009) Entropy, Orbits, and Spectra of Graphs. In: Dehmer, M. andEmmert-Streib, F., Eds., Analysis of Complex Networks: From Bi-ology to Linguistics, Wiley-VCH Verlag GmbH & Co. KGaA, Weinheim, 1-22.
https://doi.org/10.1002/9783527627981.ch1
[14] Shannon, C.E. and Weaver, W. (1949) The Mathematical Theory of Communica-tion. University of Illinois Press, Urbana, IL.
[15] Blondel, V.D., Guillaume, J.-L., Lambiotte, R. and Lefebvre, E. (2008) Fast Unfold-ing of Communities in Large Networks. Journal of Statistical Mechanics: Theory and Experiment, 2008, P10008. https://doi.org/10.1088/1742-5468/2008/10/P10008
[16] Chen, G., Wang, X. and Li, X. (2015) Fundamentals of Complex Networks: Models, Structures and Dynamics. Wiley, Cambridge.
https://doi.org/10.1002/9781118718124
[17] Pastor-Satorras, R. and Vespignani, A. (2007) Evolution and Structure of the Inter-net: A Statistical Physics Approach. Cambridge University Press, Cambridge. [18] Probst, G., Raub, S. and Romhardt, K. (2002) Gestão do Conhecimento: Os
ele-mentos construtivos do sucesso. Editora Bookman, Porto Alegre.
[19] Nonaka, I. and Takeuchi, H. (1997) Criação de conhecimento na empresa: Como as empresas japonesas geram a dinâmica da inovação. Campus, Rio de Janeiro. [20] Laudon, K. and Laudon, J. (2010) Sistemas de Informação Gerenciais Management
Information Systems. 9th Edition, Pearson Prentice Hall, São Paulo.
[21] Bastian, M., Heymann, S. and Jacomy, M. (2016) Gephi: An Open Source Software for Exploring and Manipulating Networks. The Gephi Consortium.
[22] Chrissis, M.B., Konrad, M. and Shrum, S. (2006) CMMI for Development: Guide-lines for Process integration and Product Improvement. 3rd Edition, Addi-son-Wesley Publishing Company Inc., Boston, MA.
[23] PMI (2013) Um Guia do Conhecimento em Gerenciamento de Projetos. 5th Edi-tion, Project Management Institute, Newtown Square, PA.
Soft-DOI: 10.4236/sn.2019.83009 146 Social Networking ware Technology, 86, 71-86.https://doi.org/10.1016/j.infsof.2017.01.003
[25] Liu, R.F. (2019) Evolution Analysis of Synthetic Biotechnology from the Perspective of Multiple Knowledge Network. American Journal of Industrial and Business Management, 9, 366-384.https://doi.org/10.4236/ajibm.2019.92025
[26] Lindsjørn, Y., Sjøberg, D.I.K., Dingsøyr, T., Bergersen, G.R. and Dybå, T. (2016) Teamwork Quality and Project Success in Software Development: A Survey of Agile Development Teams. Journal of Systems and Software, 122, 274-286.
https://doi.org/10.1016/j.jss.2016.09.028