TRACING ANGULAR MOMENTUM DURING STAR AND
PLANETARY SYSTEM FORMATION
Claire Louise Davies
A Thesis Submitted for the Degree of PhD
at the
University of St Andrews
2015
Full metadata for this item is available in
Research@StAndrews:FullText
at:
http://research-repository.st-andrews.ac.uk/
Please use this identifier to cite or link to this item:
http://hdl.handle.net/10023/7557
This item is protected by original copyright
Revolution Evolution
Tracing Angular Momentum During Star And Planetary System
Formation
by
Claire Louise Davies
This thesis is submitted in partial fulfilment for the degree of Doctor of Philosophy in Astrophysics
at the
University of St Andrews
Declaration
I, Claire Louise Davies, hereby certify that this thesis, which is approximately 60,000
words in length, has been written by me, that it is the record of work carried out by me
and that it has not been submitted in any previous application for a higher degree.
Date Signature of candidate
I was admitted as a research student in September 2011 and as a candidate for the
degree of PhD in September 2011; the higher study for which this is a record was carried
out in the University of St Andrews between 2011 and 2015.
Date Signature of candidate
I hereby certify that the candidate has fulfilled the conditions of the Resolution and
Regulations appropriate for the degree of PhD in the University of St Andrews and that
the candidate is qualified to submit this thesis in application for that degree.
Copyright Agreement
In submitting this thesis to the University of St Andrews we understand that we are giving
permission for it to be made available for use in accordance with the regulations of the
University Library for the time being in force, subject to any copyright vested in the work
not being affected thereby. We also understand that the title and the abstract will be
published, and that a copy of the work may be made and supplied to any bona fide library
or research worker, that my thesis will be electronically accessible for personal or research
use unless exempt by award of an embargo as requested below, and that the library has
the right to migrate my thesis into new electronic forms as required to ensure continued
access to the thesis. We have obtained any third-party copyright permissions that may be
required in order to allow such access and migration, or have requested the appropriate
embargo below.
The following is an agreed request by candidate and supervisor regarding the
elec-tronic publication of this thesis: Access to Printed copy and elecelec-tronic publication of
thesis through the University of St Andrews.
Date Signature of candidate
Collaboration Statement
This thesis is the result of my own work carried out at the University of St Andrews
between September 2011 and April 2015. Part of the work presented in this thesis has
been published in refereed scientific journals. In all cases, the text in the chapters has
been written entirely by me. All figures, unless explicitly stated in the text, have been
produced by me.
Chapters 2 and 3 feature work presented in: “Accretion discs as regulators of stellar
angular momentum evolution in the ONC and Taurus-Auriga”: Davies C. L., Gregory S. G., Greaves J. S., 2014, Monthly Notices of the Royal Astronomical Society, 444, 1157.
Figs. 2.2, 3.1, 3.2, 3.4, 3.8 3.11, and 3.12 have been reproduced from this paper. All work
in this paper was carried out and written by me, with scientific advice from the co-authors.
Chapter 4 is based on “The outer regions of protoplanetary discs: evidence for viscous
evolution?”: Davies C. L., Gregory S. G., Greaves J. S., Ilee J. D., 2015, Astronomy
& Astrophysics, submitted. Figs. 4.1 to 4.7 appear here in the same format as in the
submitted manuscript. All work in this paper was carried out and written by me, with
scientific advice from the co-authors.
The work presented in Chapter 5 is being prepared for submission to the Monthly
Notices of the Royal Astronomical Society and has benefited from collaboration with the
Submillimetre Common-User Bolometer Array-2 Observations of Nearby Stars (SONS)
consortium. The targets were observed by me and other members of the consortium
be-tween February 2012 and September 2014. The data reduction was performed by Wayne
S. Holland. The spectral energy distribution modelling (including retrieval of the
addi-tional data required for this) was performed by Grant M. Kennedy. Grant provided me
with the results of this fitting procedure which I used to calculate the disc masses. Bruce
Sibthorpe provided me with his disc-fitting code which I used to determine the radii of the
targets showing evidence of extended emission. Jane S. Greaves provided scientific advice.
Claire Louise Davies
Abstract
Stars form via the gravitational collapse of molecular clouds during which time the
proto-stellar object contracts by over seven orders of magnitude. If all the angular momentum
present in the natal cloud was conserved during collapse, stars would approach rotational
velocities rapid enough to tear themselves apart within just a few Myr. In contrast to
this, observations of pre-main sequence rotation rates are relatively slow (∼1−15 days)
indicating that significant quantities of angular momentum must be removed from the
star. I use observations of fully convective pre-main sequence stars in two well-studied,
nearby regions of star formation (namely the Orion Nebula Cluster and Taurus-Auriga)
to determine the removal rate of stellar angular momentum. I find the accretion
disc-hosting stars to be rotating at a slower rate and contain less specific angular momentum
than the disc-less stars. I interpret this as indicating a period of accretion disc-regulated
angular momentum evolution followed by near-constant rotational evolution following disc
dispersal. Furthermore, assuming that the age spread inferred from the
Hertzsprung-Russell diagram constructed for the star forming region is real, I find that the removal rate
of angular momentum during the accretion-disc hosting phase to be more rapid than that
expected from simple disc-locking theory whereby contraction occurs at a fixed rotation
period. This indicates a more efficient process of angular momentum removal must operate,
most likely in the form of an accretion-driven stellar wind or outflow emanating from the
star-disc interaction.
The initial circumstellar envelope that surrounds a protostellar object during the
ear-liest stages of star formation is rotationally flattened into a disc as the star contracts.
An effective viscosity, present within the disc, enables the disc to evolve: mass accretes
inwards through the disc and onto the star while momentum migrates outwards, forcing
the outer regions of the disc to expand. I used spatially resolved submillimetre detections
of the dust and gas components of protoplanetary discs, gathered from the literature, to
measure the radial extent of discs around low-mass pre-main sequence stars of∼1−10 Myr
and probe their viscous evolution. I find no clear observational evidence for the radial
protoplanetary discs are likely governed by different astrophysical processes.
Observations of jets and outflows emanating from protostars and pre-main sequence
stars highlight that it may also be possible to remove angular momentum from the
cir-cumstellar material. Using the sample of spatially resolved protoplanetary discs, I find no
evidence for angular momentum removal during disc evolution. I also use the spatially
resolved debris discs from the Submillimetre Common-User Bolometer Array-2
Obser-vations of Nearby Stars survey to constrain the amount of angular momentum retained
within planetary systems. This sample is compared to the protoplanetary disc angular
momenta and to the angular momentum contained within pre-stellar cores. I find that
significant quantities of angular momentum must be removed during disc formation and
disc dispersal. This likely occurs via magnetic braking during the formation of the disc,
via the launching of a disc or photo-evaporative wind, and/or via ejection of planetary
Acknowledgements
I would first and foremost like to thank my family for their unfaltering support and
encouragement. In particular, Mum, Dad, Emily, Grandad, and Sarah: I could not have
gotten this far without you. Knowing I have the support of such a loving bunch of people
back home has provided me with all the motivation I could possibly need. I’m also grateful
that my trip to the IAUS 299 in Victoria, BC enabled me to rekindle old ties with my
Canadian family. Immense thanks go to Bev and Darrell (and Molly-Moo, of course) who
essentially adopted me while I was out there - I cannot believe how welcome you made me
feel. That trip has definitely been the highlight of the past three and a half years.
From an academic point of view, a number of key people deserve particular recognition.
My thanks go to my initial supervisor, Jane Greaves and her ability to “accidentally” hire
Ford Mustangs on observing trips; to Stuart Littlefair for highlighting the importance of
the stellar side of this thesis early on during my PhD; to the support staff and telescope
operators at the JCMT; and to members of the star formation and disc communities for
their helpful comments and discussions along the way. I’m also indebted to the STFC
who provided the funding for my PhD and the ∼74,000 miles I’ve had the opportunity
to travel within that time. Most of all, I would like to extend a sincere thank you to my
eventual supervisor, Scott Gregory. It is difficult to sufficiently put into words the level of
gratitude I feel for the support, guidance, and encouragement you have given me as well
as the self-belief that you have instilled in me. The past two years working with you have
been an absolute joy.
My thanks are also given to the North East branch of the Institute of Physics, the
University of St Andrews Planetarium team, and the astronomical societies of York,
Har-rogate, Dundee, and Leeds who have enabled me to throw myself in at the deep end in an
effort to get over my fear of public speaking.
I would also like to say a big thank you to my friends and colleagues in St Andrews’
Astronomy group. In particular to Jack and Joe for making St Andrews such a welcoming
place to begin with; to Rim for providing advice when needed and her appreciation of the
to Jeremy for the racquetball games; and to Markus for the football chats.
Additional thank yous go to David Bajek, Kyle, Coops, and Badger who have been
here for me when I needed them the most and to Jen, Paul, Eve, Dougal, Mark, Rodders,
and all the oldbenchies back in and around Tadcaster: I don’t get to see you guys nearly
as often as I would like but you never fail to put a smile on my face when I do.
A final word of thanks goes to Scott Sneddon and his “wee to-es”. You have listened
to me rant, whinge, and complain when I needed to and have made me laugh so hard that
my belly hurts on so many occasions. That trip to Inverness for new year 2015 will live
ingredient of success is not knowing
that what you’re attempting can’t
be done. A person ignorant of
failure can be a half-brick in the
path of the bicycle of history.”
Contents
Declaration i
Copyright Agreement iii
Collaboration Statement v
Abstract vii
Acknowledgements xi
1 Introduction 1
1.1 Initial collapse . . . 2
1.1.1 Large-scale magnetic fields as obstacles to collapse . . . 4
1.1.2 Formation of a protostar . . . 7
1.1.3 Rotation during contraction: formation of a disc . . . 8
1.2 Pre-main sequence evolution . . . 10
1.2.1 Changes inside the star . . . 12
1.2.2 Evolution of the circumstellar environment . . . 15
1.2.3 Disc dispersal . . . 20
1.3 Observing the stages of star formation . . . 24
1.3.1 Evolution of the circumstellar environment . . . 24
1.3.2 Signatures of infall . . . 28
1.3.3 Accretion signatures . . . 30
1.3.4 Jets and outflows . . . 31
1.4 Avoiding break-up: the angular momentum problem . . . 32
1.4.1 Angular momentum evolution: an observational perspective . . . 32
1.4.2 The theory of disc-locking . . . 35
2 Angular momenta calculation 43
2.1 Stellar angular momentum model . . . 43
2.2 Disc angular momentum models . . . 46
2.2.1 Geometrically thin, Keplerian accretion discs . . . 46
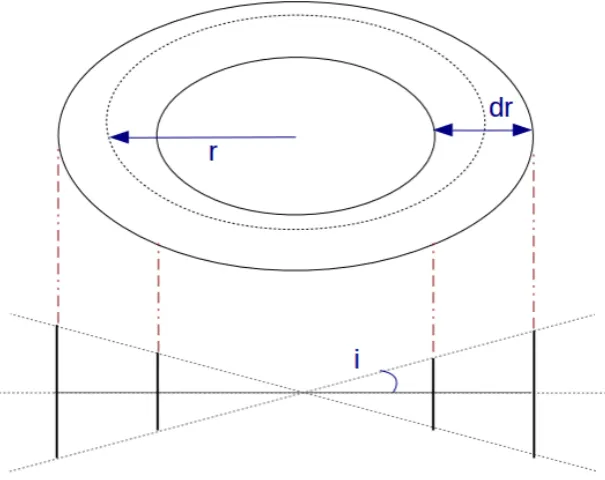
2.2.2 Debris discs as thin rings . . . 47
2.3 Stellar rotation rates . . . 49
2.3.1 Projected rotational velocities . . . 49
2.3.2 Rotation periods . . . 49
2.4 Pre-main sequence stellar masses, ages, and radii . . . 52
2.4.1 Effective temperatures from spectral types . . . 52
2.4.2 Bolometric luminosities from photometry . . . 55
2.4.3 Stellar masses and ages from effective temperatures and bolometric luminosities . . . 58
2.4.4 Age spreads in star forming regions . . . 58
2.5 Disc sizes . . . 61
2.5.1 The gas component of protoplanetary discs . . . 62
2.5.2 The dust component of protoplanetary discs . . . 64
2.5.3 Debris discs . . . 65
2.6 Main sequence stellar masses from spectral energy distribution modelling . 69 2.7 Debris disc masses . . . 70
2.7.1 Collisional cascade and total debris disc mass . . . 73
2.8 Summary . . . 75
3 Accretion discs as regulators of stellar angular momentum evolution 77 3.1 Stellar data . . . 78
3.1.1 Effective temperatures . . . 79
3.1.2 Bolometric luminosities . . . 82
3.1.3 Stellar radii, masses and ages . . . 84
3.1.4 Rotation periods . . . 85
3.1.5 Rotational flattening . . . 87
3.1.7 Multiplicity . . . 90
3.2 Results and discussion . . . 91
3.2.1 Evolution of specific angular momentum during pre-main sequence contraction: theory . . . 92
3.2.2 Evolution of specific angular momentum during pre-main sequence contraction: observations . . . 96
3.2.3 Focusing on Class III stars . . . 99
3.2.4 Focusing on Class II stars . . . 105
3.2.5 Rotation period distributions and the relation between stellar mass and rotation . . . 106
3.3 Summary . . . 108
4 Outer regions of protoplanetary discs: evidence for viscous evolution? 111 4.1 Observational data . . . 116
4.1.1 Characterising the thermal dust emission . . . 116
4.1.2 Ages of the star-disc systems . . . 121
4.1.3 Accounting for observational bias . . . 122
4.2 Results . . . 124
4.2.1 Evolution of the disc radius: expectation from theory . . . 124
4.2.2 Evolution of the disc radius: observations . . . 125
4.3 Discussion . . . 127
4.3.1 Is an evolutionary sequence observed? . . . 127
4.3.2 Influence of neighbouring stars . . . 127
4.3.3 Impact of stellar mass . . . 129
4.3.4 Spatial resolution and grain size . . . 129
4.3.5 Gas-to-dust ratio in the outer disc . . . 130
4.3.6 Is angular momentum conserved within the dust disc? . . . 131
4.4 Summary . . . 134
5 Quantifying the angular momentum retained within planetary systems 137 5.1 The Submillimetre Common-User Bolometer Array-2 Observations of Nearby Stars James Clark Maxwell Telescope Legacy Survey . . . 138
5.2 Results . . . 142
5.2.3 Dust mass . . . 144
5.2.4 Angular momentum components of the planetary systems . . . 146
5.3 Discussion . . . 150
5.3.1 Angular momentum evolution during disc dispersal . . . 150
5.4 Summary . . . 152
6 Summary and future work 155 6.1 Main results . . . 156
6.2 Outlook and future work . . . 160
6.2.1 Independent radius and age estimates . . . 160
6.2.2 Protoplanetary discs with uniform spatial resolution . . . 162
6.2.3 The interplay between stars, discs, and planets . . . 163
A Contraction rate of a fully convective, polytropic pre-main sequence star165
B Online resources 169
C Acronyms 171
List of Figures
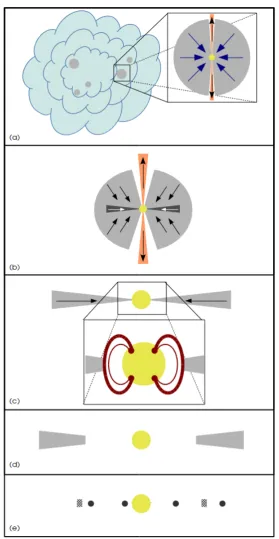
1.1 Schematic representation of star and planetary system formation, adapted
from Shu et al. (1987). . . 3
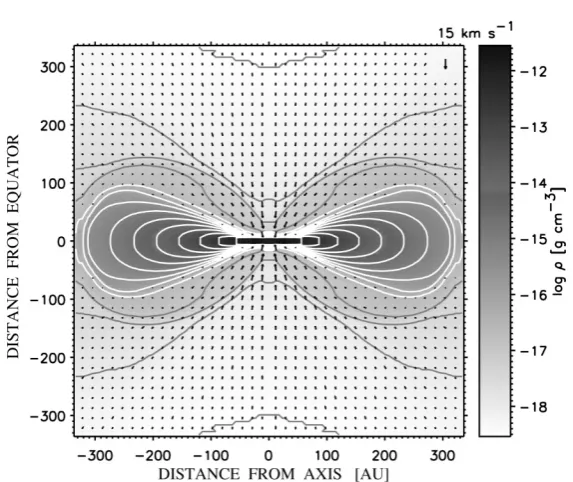
1.2 Snapshot of the evolution of density and velocity as the circumstellar
enve-lope rotationally flattens into a disc from Suttner & Yorke (2001). cAAS.
Reproduced with permission. . . 9
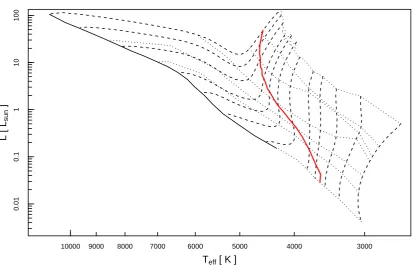
1.3 The pre-main sequence of the Hertzsprung-Russell diagram generated from
Siess et al. (2000) models. . . 11
1.4 Spiral density perturbations, imaged in the disc around SAO 206462, using
the High Contrast Instrument for the Subaru Next Generation Adaptive
Optics (HiCIAO). . . 19
1.5 The Orion proplyds. . . 21
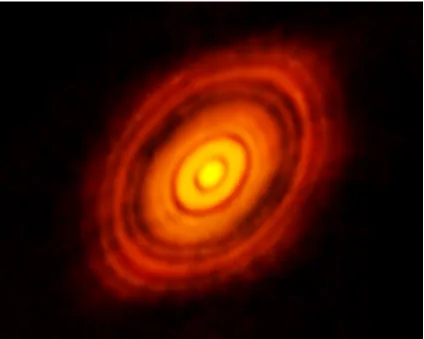
1.6 Atacama Large Millimeter/submillimeter Array image of the disc around
HL Tau. . . 22
1.7 Temporal evolution of the disc fraction, taken from Sicilia-Aguilar et al.
(2006). cAAS. Reproduced with permission. . . 23
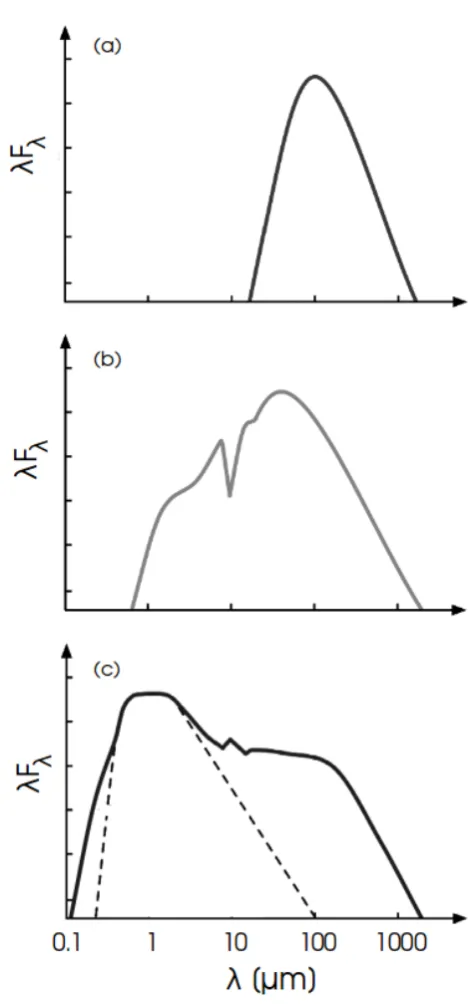
1.8 Evolution of the spectral energy distribution during collapse. . . 25
1.9 Example of model spectral energy distribution fits to multi-wavelength
ob-servations of a Class II and transitional disc, taken from Robitaille et al.
(2007). cAAS. Reproduced with permission. . . 26
1.10 Asymmetric line profile as a signature of infall. . . 29
1.11 Hubble Space Telescope image of the HH 47 protostellar jet. . . 31
1.12 Representation of the magnetic interaction between a pre-main sequence star and the inner regions of its accretion disc under the disc-locking
frame-work. . . 35
2.1 Schematic representation of the debris disc geometry defined as a torus of
radius, r, width, dr, and opening angle, 2i. . . 47
2.2 Example of the analysis undertaken in Davies et al. (2014a) to check for
the effects of beats and harmonics in the Orion Nebula Cluster. . . 51
2.3 Comparison of spectral type-to-effective temperature scales derived by
metallicity, Z = 0.02, initial helium abundance, Y = 0.27, mixing length,
α = 1.68, and initial deuterium abundance,XD= 2×10⁵. . . 59
2.5 The debris disc around Fomalhaut. . . 65
2.6 Example of the process used to determine how well-resolved a debris disc is. 66
2.7 Distribution of major and minor full width half maxima resulting from the
simulated point source fitting in Fig. 2.6, overlaid with the results for the
original disc image. . . 68
2.8 Examples of thermal dust emission from debris discs which lack the centrally
concentrated emission expected for a Gaussian intensity profile. . . 69
2.9 Results of smoothing the images of ε Eri and Fomalhaut in Fig. 2.8 with
an additional 27 arcsec beam. . . 70
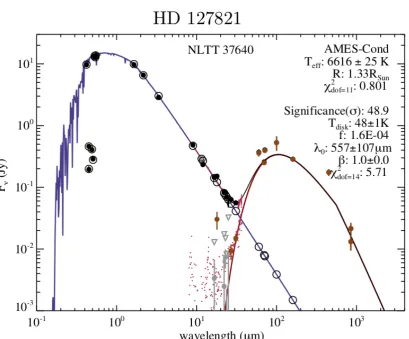
2.10 Spectral energy distribution of the debris disc system HD 127821. . . 71
3.1 Comparison between the bolometric luminosities from Davies et al. (2014a)
and Hillenbrand (1997) for members of the Orion Nebula Cluster. . . 83
3.2 Hertzsprung-Russell diagram constructed from Siess et al. (2000) pre-main
sequence evolutionary models for the Orion Nebula Cluster and
Taurus-Auriga. . . 86
3.3 Relation between stellar rotation period,P, and the radius of gyration, k2,
(normalised to that of a perfect sphere, k0 = (2/3)1/2) for fully convective
members of the Orion Nebula Cluster and Taurus-Auriga with P <15 days. 88
3.4 Contraction rate of high mass and low mass Class II and Class III stars in
the Orion Nebula Cluster and Taurus-Auriga. . . 94
3.5 HRD for the sample of fully convective ONC sample for which disc
classi-fications were available, overlaid with lines of constant radius. . . 95
3.6 Evolution of specific stellar angular momentum, j?, for the high mass and
low mass Class II and Class III samples in the Orion Nebula Cluster and
Taurus-Auriga. . . 97
3.7 As Fig. 3.6 but for the Orion Nebula Cluster sources identified as accreting
and non-accreting using the equivalent width of Ca ii. . . 100
3.8 Relationship between rotation period, P, and stellar age, tage, for the high
mass and low mass Class II and Class III stars in the Orion Nebula Cluster and Taurus-Auriga. . . 101
3.9 Distribution of specific stellar angular momentum, j?, for the high mass
and low mass Orion Nebula Cluster samples. . . 104
3.10 As Fig. 3.9 but for the high mass Taurus-Auriga sample. . . 104
3.11 Distribution of rotation periods,P, for the high mass and low mass Orion
3.12 As Fig. 3.11 but for the high mass Taurus-Auriga sample. . . 107
4.1 Atacama Large Millimeter/submillimeter Array Cycle 0 continuum image
for CIDA 1. . . 119
4.2 As Fig. 4.1 but for 2MASS J16142029-1906481. . . 120
4.3 Hertzsprung-Russell Diagram constructed from the Siess et al. (2000)
pre-main sequence evolutionary models for the stellar hosts. . . 122
4.4 Evolution of the radial extent of the dust component of the discs. . . 125
4.5 Disc radial extent for the thirteen star-disc systems with measurements of
the radial extent of the gas component,Rgas, and the dust component,Rdust.126
4.6 Evolution of the specific angular momentum contained within the dust disc. 133
4.7 Median specific angular momenta for pre-stellar cores (data from Curtis &
Richer 2011), dust discs (data from Table 4.1), the Solar System (data from Cox 2000) and Jupiter. . . 133
5.1 The 15 m James Clark Maxwell Telescope following a successful night of
Submillimetre Common-User Bolometer Array-2 Observations of Nearby Stars observations on 11 May 2014. . . 139
5.2 Maps of 850µm emission from the thirteen debris discs which exhibit
ex-tended emission at this wavelength. . . 140
5.3 Maps of 450µm emission from the two debris discs which exhibit extended
emission at this wavelength. . . 141
5.4 Comparison of the specific angular momentum contained within the
List of Tables
3.1 Stellar data for all members of the Orion Nebula Cluster not identified as
binary or multiple for which a spectral type was available in the literature. 80
3.2 Stellar data for all members of Taurus-Auriga not identified as binary or
multiple for which a spectral type was available in the literature. . . 81
3.3 Magnitudes of the gradients of the numerical recipe fitexy fitting using
equation (3.16) for (i) the Orion Nebula Cluster sample alone, and (ii) the
combined Orion Nebula Cluster and Taurus-Auriga samples. . . 93
3.4 Results of Spearman rank correlation tests and fitexy fits to equation
(3.19) for (i) the Orion Nebula Cluster sample alone, and (ii) the combined
Orion Nebula Cluster and Taurus-Auriga samples. . . 98
3.5 Results of Spearman rank correlation tests performed on the data from
Fig. 3.8 for (i) the Orion Nebula Cluster sample alone, and (ii) the combined Orion Nebula Cluster and Taurus-Auriga samples. . . 102
4.1 Data for star-disc systems not identified as members of binary or multiple
systems for which spatially resolved thermal continuum emission, spectral types, and Two Micron All Sky Survey photometry were available. . . 113
4.2 Stellar masses and ages determined using Tognelli et al. (2011) pre-main
sequence evolutionary models for the 25 stars in the sample which lay inside the bounds imposed by the model isochrones. . . 128
4.3 Comparison of the results of the Spearman rank correlation tests performed
using the data in Figs. 4.4 and 4.5 using Siess et al. (2000) and Tognelli et al. (2011) models. . . 128
5.1 Observations summary for the Submillimetre Common-User Bolometer
Array-2 Observations of Nearby Stars targets which appear extended at 850µm
or 450µm. . . 142
5.2 Results obtained from the spectral energy distribution fitting. . . 144
5.3 Angular momenta contained within the spatially resolved debris discs. . . . 145
5.4 Angular momentum of the stellar hosts. . . 148
5.5 Orbital angular momenta of the known exoplanets included in the sample
1
Introduction
S
tars, celestial bodies undergoing thermonuclear fusion of hydrogen to helium intheir cores, form via the gravitational collapse of molecular clouds. During the
initial stages, an isothermal core is quickly distinguished from a surrounding
en-velope of gas and dust and continues to contract under gravity at free-fall velocities. The
density increase within the core leads to an increase in the internal temperature and the
core enters a phase of adiabatic collapse. Meanwhile, the circumstellar material continues
to accrete onto the core and rotationally flattens into a disc. The central core becomes
optically visible and enters the pre-main sequence (PMS) phase. During this time, the
turbulent properties of the disc allow material to migrate inwards and accrete along stellar
magnetic field lines onto the central star while angular momentum is transferred outwards,
forcing the outer regions of the disc to radially expand. Through the combined effects of
ir-radiation, accretion, tidal interactions, and planet formation, the disc eventually disperses,
leaving a disc-less PMS star and a possible planetary system. This PMS star continues
evolutionary sequence is illustrated in Fig. 1.1.
The role of angular momentum in star and planetary system formation is already
quite apparent from this description. In the absence of rotation, a disc would not form
and spherical collapse would continue unabated. Also, torques present in the disc enable
it to evolve, allowing accretion to continue and planets to form. It is also important to
consider the role of angular momentum in the formation of the central core. The
proto-stellar object contracts by over seven orders of magnitude during formation. During this
time, the rotation present in the natal molecular cloud core is amplified dramatically. If all
the angular momentum present in the initial molecular cloud was conserved, stars would
quickly reach velocities great enough to tear themselves apart. This presents astronomers
with an angular momentum problem: the sheer fact that stars can form requires angular
momentum to be removed from the system.
This chapter provides the background and context to the work presented in this
the-sis. Sections 1.1 and 1.2 focus on the theoretical description of star and planetary system
formation, outlining the changes to the central stellar object and its circumstellar
envi-ronment during the proto-stellar and PMS phases, respectively. Section 1.3 then presents
an overview of star formation from an observational perspective, focusing on signatures
of the different stages and the classification methods used. Finally, Section 1.4 provides
an overview of the angular momentum problem and a discussion of the theoretical
mecha-nisms that have so far been proposed to explain how angular momentum may be removed
from the star-disc system.
1.1
Initial collapse
Star formation in the Milky Way occurs in molecular clouds, predominantly located in the
spiral arms of the galaxy (e.g. Cohen et al. 1980; Dame et al. 1987). These interstellar
clouds, composed mainly of molecular hydrogen (H2) gas, are subject to perturbations
caused by e.g. (i) turbulence within the cloud, (ii) interactions with neighbouring clouds,
or (iii) propagating shock waves from supernovae (Cameron & Truran 1977; Boss 1995;
Klessen et al. 1998; Sato et al. 2000; Tan 2000; Preibisch et al. 2002; Bonnell et al. 2003).
1.1. Initial collapse
greater gravitational pressure and, if the gravitational potential energy (GPE),
U =−αGM
2
R , (1.1)
exceeds the thermal energy,
Etherm=
3 2
RT M
µ , (1.2)
the region becomes gravitationally unstable, initiating collapse. Here, the gas has been
assumed to be isothermal and spherically distributed,αis a scaling constant that depends
on the mass distribution (see e.g. Appendix A), Gis the gravitational constant, µ is the
mean molecular weight, andRis the ideal gas constant. The radius below which an
over-dense region of mass, M, and temperature, T, will undergo gravitational collapse (the
Jeans radius) is then found by inserting equations (1.1) and (1.2) into the Virial Theorem
such that
RJ=
α
3
µGM
RT (1.3)
(Jeans 1902). Alternatively, it is possible to use the density,
ρ= 3M
4πR3, (1.4)
to define the mass above which a cloud of a given density and temperature will become
unstable to gravitational collapse (the Jeans mass),
MJ=
3
4πρ
1/2
3RT
αµG
3/2
. (1.5)
Typical temperatures and H2 number densities within molecular clouds are ∼100 K and
∼ 10 cm−3 such that MJ ∼ 104M. Thus, for a 1 M region to collapse, it must be at
higher densities and lower temperatures than the bulk of the molecular cloud.
1.1.1 Large-scale magnetic fields as obstacles to collapse
If the molecular cloud is sufficiently ionised, the internal magnetic field and the motion
of the gas become entwined. In such a scenario, the magnetic field exerts a torque on the
gas which acts to inhibit gravitational collapse (c.f. Kirby 2009). For this to occur, the
1.1. Initial collapse
σ, in the region must be substantial enough for Ohmic dissipation to be neglected. Such
a case exists if the quantity,
σL2
c2 , (1.6)
is much greater than any timescales of interest. Here L is the characteristic length over
which the magnetic field,B, in the cloud varies and cis the speed of light.
An estimate for the value of σ in molecular cloud cores can be garnered from
consid-erations of the motions of electrons and ions1 in the molecular cloud which generate B.
The electrons and ions have velocities ue and ui, respectively, which each comprise of a
helical component around Bas well as a drift component. It is this drift component that
provides the stability against collapse.
The drift velocity is accelerated by the ambient electric field but also retarded by
collisions with neutral material in the cloud (mainly H2) and steady-state drift velocities
are quickly established. In the reference frame of the neutral material (denoted by primes),
the equation of motion for the electrons is accordingly given by
0 =−ene
E0+u
0
e
c ×B
0
+nefen0 . (1.7)
Similarly for the ions,
0 = +ene
E0+u
0
i
c ×B
0
+nefin0 , (1.8)
assumingni=ne. Here, eis the charge on an electron,neandniare the number densities
of electrons and ions, respectively, andE0 is the electric field. The drag forces exerted by
the neutral material on the electrons and ions,fen0 and fin0 , are related to the momentum
gained by the electrons and the ions following the collisions, pe0 and pi0, and the collision
rate.
The electrons and ions gain momentum,
pe0=−meue0 (1.9)
and
pi0=−mnui0, (1.10)
1
wheremeandmnare the masses of electrons and neutrals, respectively. The collision rate
is governed by the number density of neutral atoms and molecules,nn, and the collisional
cross section, σen (for electron-neutral collisions) or σin (for ion-neutral collisions) such
that
fen0 =−nnmehσenue0iue0, (1.11)
and
fin0 =−nnmnhσinui0iu
0
i, (1.12)
where the angular braces denote values averaged over magnitude and direction.
Focusing on the components ofue and ui in the common direction of E0 and f0, the
cross products involvingB0in equations (1.7) and (1.8) vanish. Substituting forfen0 andfin0
using equations (1.11) and (1.12), one obtains the following expression for the conductivity:
σ = nee
2
nn
1
hσenue0ime
+ 1
hσinui0imn
. (1.13)
Assuming the molecular cloud has solar composition, the quantities contained within
the angular braces are estimated to be hσenue0i ≈ 1.0×10⁻⁷cm3s−1 and hσinui0i ≈ 1.5×
10−9cm3s−1. A typical core in such a cloud hasL∼1 pc, nn ∼103cm−3 andne/nn ∼4×
10−7 (Stahler & Palla 2005) such that σL2/c2 ∼1011Myr. This timescale is huge and, as
a result, Ohmic dissipation can be neglected in molecular cloud cores. The magnetic fields
are tethered to the gas (i.e. frozen-in), providing additional stability against gravitational
collapse. Consequently, the critical mass required for the cloud to collapse is larger than
the Jeans mass, MJ, in equation (1.5):
Mcrit≈MJ+MB. (1.14)
The additional component, MB ∝Φcl/G1/2, accounts for the magnetic support provided
by the total magnetic flux threading the cloud, Φcl.
A cloud of mass,MJ≤M ≤Mcritmay still be able to collapse if the level of ionisation
in the cloud is low. In this case, the relative velocities of the charged species and the
neutral atoms and molecules are larger and neutral material drifts across magnetic field
1.1. Initial collapse
forces. The consequent loss of magnetic flux, known as ambipolar diffusion, results in a
reduction inMcrit. If this process continues, andMcritfalls belowM, the core will become
unstable to gravitational collapse.
1.1.2 Formation of a protostar
The core in this initial stage of collapse is referred to aspre-stellar. It is cold (∼10 K) and
the emergent radiation exhibits a Planck spectrum peaking at submillimetre/millimetre
(hereafter collectively referred to as submm) wavelengths. Until the pre-stellar core reaches
a density of∼10−10kg m−3, it remains optically thin to its own radiation, enabling efficient
cooling and keeping the core in an isothermal state. As contraction continues, the central
regions begin to exceed this density and become opaque. The heat generated in the core
as a result of gravitational collapse can no longer be removed efficiently. The collapse
enters an adiabatic stage, increasing the core temperature (Masunaga & Inutsuka 2000;
Stamatellos et al. 2007b). This results in a corresponding increase in pressure, slowing the
rate of collapse.
As contraction continues, the core density and temperature continue to rise. When
the central temperature reaches ∼ 1600 K, the energy released by gravitational collapse
goes into dissociating and then ionising the molecular hydrogen, rather than increasing the
thermal pressure. This initiates a second stage of collapse which terminates when all the
core hydrogen has been ionised. Thermal support is re-established and the core regains
approximate hydrostatic equilibrium (HE). In the words of Lyman Spitzer Jr. (Spitzer
1948):
During this stage of gravitational contraction an aggregation of dust and atoms
will be stable against most disruptive influences, it should no longer be regarded
as a cloud, and will here be called a ‘protostar’.
While in this proto-stellar phase, the core continues to contract and collapse of the
circumstellar envelope continues. The speed at which the enveloping material collapses
exceeds the local sound speed close to the core, producing a shock at its outer edge. The
into the envelope and dominates the observed proto-stellar luminosity such that
Lproto?≈Lacc=
GMcoreM˙
Rcore
, (1.15)
where M˙ denotes the mass accretion rate, Mcore is the core mass and Rcore is the core
radius.
The lifetime of the proto-stellar phase of star formation is determined by the rate of
collapse of the circumstellar envelope. As the gas and dust within the envelope remain
approximately isothermal, the timescale of its collapse is governed by the free-fall time,
tff =
3π
32Gρ
1/2
. (1.16)
For low- and intermediate-mass stars, tff ∼0.1 Myr.
1.1.3 Rotation during contraction: formation of a disc
In the absence of rotation, accretion of the circumstellar envelope would continue through
an accretion shock at the surface of the stellar core. However, pre-stellar and
proto-stellar envelopes are observed to rotate. Therefore, one must consider the effect that this
rotation has on the circumstellar material during infall.
Consider a spherical shell centered around a pre-stellar core which undergoes solid
body rotation around a fixed axis that threads through the poles of the core. Each parcel
of material in the shell is located at the same distance, r, from the centre of the core and
thus experiences the same magnitude of gravitational acceleration. At the same time, the
projected distance from the rotation axis, r0, is dependent on the latitude, θ: material
at lower latitudes experiences greater centripetal acceleration than material at higher
latitudes. Combining these two effects, it is possible to see that the direction of the net
acceleration also depends on the magnitude of θ (see Fig. 1.2). Due to the axisymmetric
nature of the collapse, material collapsing from positive latitudes collides with material
collapsing from negative latitudes, forming a disc (Terebey et al. 1984; Adams et al. 1987,
see Fig. 1.1b).
The collapse of the circumstellar envelope proceeds from the inside out as the pressure
circumstel-1.1. Initial collapse
Figure 1.2: Snapshot, at t=1.03×10⁴yrs from figure 5 of Suttner & Yorke (2001),
showing the evolution of density (white contours) and velocity (black arrows) as the circumstellar envelope rotationally flattens into a disc. cAAS. Reproduced with per-mission.
lar disc is determined by the total specific angular momentum, j, contained within the
envelope from which it forms and the mass of the central pre- or proto-stellar core,Mcore
such that2
ri=
j2
GMcore
. (1.17)
The material within the disc is in near-HE and one can see clearly from Fig. 1.2 that
the resulting structure is flared. However, it is important to make clear that the contours
in Fig. 1.2 represent logarithmic changes in the density [each contour is separated by
∆(logρ) = 0.5]. As a result, the vertical scale height appears exaggerated in this figure.
Typically, the scale height is .10% of the radial extent of the disc.
Influence of magnetic fields
If the envelope is sufficiently ionised and the magnetic field is frozen-in (see Section 1.1.1),
magnetic torques can remove angular momentum from the in-falling material (e.g.
Krasnopol-sky & K¨onigl 2002). Consequently, the radiusri in equation (1.17) should be treated as a
2
The subscriptiin equation (1.17) refers to the fact thatri is theinitial disc radius. As is discussed in
maximum initial disc radius. At its limiting case, where the magnetic torques are strong
and essentially all the angular momentum is removed before the in-falling material reaches
the equatorial regions (in terms of the latitude,θ≈0), a disc does not form. This situation
occurs in ideal magneto-hydrodynamic (MHD) simulations with even weak field strengths
(Hennebelle & Fromang 2008; Mellon & Li 2009).
A number of non-ideal MHD effects have been investigated in an attempt to explain
how discs can form in the presence of magnetic fields and solve the so-called “magnetic
braking catastrophe”. These include ambipolar diffusion (Duffin & Pudritz 2009; Li et al.
2011), Ohmic dissipation (Machida et al. 2011; Tomida et al. 2013) and the Hall effect
(Krasnopolsky et al. 2010; Braiding & Wardle 2012). Several studies have also recently
suggested alternative solutions including turbulence (Santos-Lima et al. 2012; Myers et al.
2013) and misalignment between the magnetic field and the rotation axis (Hennebelle &
Ciardi 2009; Joos et al. 2012; Li et al. 2013). However, none of these effects has been able
to sufficiently explain how discs form in the presence of strong magnetic fields and the
problem remains unsolved at present.
1.2
Pre-main sequence evolution
While stars with masses & 8 M generate sufficiently high pressures and temperatures
within their cores to begin thermonuclear fusion of hydrogen into helium before their
proto-stellar envelopes have fully dispersed, low- and intermediate-mass stars experience
a transitional period of contraction known as the PMS. Transition from the proto-stellar
stage to the PMS occurs when the accretion luminosity, Lacc, [see equation (1.15)] no
longer exceeds the luminosity generated via gravitational contraction,Lint. This coincides
with the dispersal of the circumstellar envelope.
PMS evolution encompasses the optically visible stage of star formation and, as a result,
can be illustrated using a Hertzsprung-Russell diagram (HRD; see Fig. 1.3). The region
occupied by newly emerged PMS stars is known as the stellar birthline (Stahler 1983).
From this point in the HRD, the PMS star undergoes slow, quasi-hydrostatic contraction.
As it does so, it traverses a path in the HRD appropriate for its mass. Examples of these
tracks are illustrated by the dashed lines in Fig. 1.3 which have been generated from Siess
1.2. Pre-main sequence evolution
Teff [ K ]
L
[
Ls
u
n
]
10000 9000 8000 7000 6000 5000 4000 3000
0.01
0.1
1
10
[image:38.595.104.519.94.359.2]100
Figure 1.3: The PMS of the HRD generated from Siess et al. (2000) models. The dashed lines illustrate the tracks that particular masses of stars take during their PMS contraction and are shown, from right to left, for masses of 0.1, 0.2, 0.3, 0.4, 0.5, 0.75, 1.0, 1.25, 1.5, 2, 2.5, and 3 M. The near-vertical component of these tracks
are theHayashi tracks (Hayashi 1961) while the components with steadily increasing luminosity and increasing effective temperatures are theHenyey tracks (Henyey et al. 1955). The dotted lines illustrate the positions of PMS stars with different ages and are shown, from upper right to bottom left, for 0.01, 0.2, 0.5, 2, 5, 10, and 60 Myr. The solid black line indicates the location of the ZAMS for stars &0.7 M. The red
line marks the boundary between fully convective PMS stars (located to the right of the line) and those that have formed a radiative core (Gregory et al. 2012).
fusion reactions within the stellar core generate sufficient pressure to balance the star
against its own self-gravity. The region of the HRD occupied by these newly-formed MS
stars is known as the zero-age main sequence (ZAMS).
The length of the PMS phase is determined by the time taken for the GPE generated
by contraction to be radiated away. As such, it is estimated using the Kelvin-Helmholtz
timescale,
tKH =
|U|
L?
≈ GM
2 ?
R?L?
. (1.18)
For a solar-type star (R?=R,M? =M, andL? =L),tKH ∼30 Myr. By comparison,
its MS lifetime is∼104Myr, indicating that the PMS phase constitutes only a tiny fraction
1.2.1 Changes inside the star
PMS stars can be subdivided into two groups: low-mass, T Tauri stars (TTSs; Joy 1945)
and intermediate mass, Herbig Ae/Be stars (Herbig 1960). TTSs exhibit strong surface
magnetic fields (e.g. Johns-Krull 2007) while those of Herbig Ae/Be stars are weak or
absent (Alecian et al. 2013a,b). The reason for this likely lies in the differences between
their internal structures. The interiors of TTSs are either fully convective or consist of a
radiative core and a convective envelope, depending on their mass and age. The convective
motions of ionised material within the stellar interior generates a strong surface magnetic
field via e.g. anαΩ orα2 dynamo (Parker 1975; Durney et al. 1993). In comparison, the
interiors of Herbig Ae/Be stars are either fully radiative or consist of a convective core and
radiative envelope. Consequently, they are unable to produce such strong surface fields.
For each fully convective star of a given mass, radius and composition, a minimum
effective temperature exists. Assuming that the star is in HE, it lies on a Hayashi track
(Hayashi 1961). Stars with partially or fully radiative interiors lie to the left of these
tracks and stars not in HE (e.g. pre-stellar cores) can exist to the right of these tracks.
It is clear from Fig. 1.3 that the track followed by a TTS in the HRD depends on its
internal structure. The red line in Fig. 1.3 marks the boundary between fully convective
TTSs (located to the right of this line) and those which have formed radiative cores. Three
features are immediately clear from Fig. 1.3:
• TTSs are initially fully convective and, during this time, evolve at near-constant
effective temperature while the luminosity decreases (following their Hayashi tracks);
• not all TTSs form radiative cores (those.0.35 Mremain fully convective
through-out their formation and during their MS evolution);
• following the formation of a radiative core, the surface temperature increases and
the TTS evolves at a gently increasing luminosity (following a Henyey track; Henyey
et al. 1955).
The formation of a radiative core requires the stellar interior to be stable against
convection. To see how changes in the interior during collapse create the conditions for
1.2. Pre-main sequence evolution
pressure, temperature, and density of this parcel are each dependent on r. At r = r1,
the parcel of gas is at pressure, P1, temperature, T1, and density, ρ1. If the density and
temperature of the parcel increase slightly toρ2=ρ1+δρ andT2=T1+δT, respectively,
the parcel will become buoyant and rise to r2 =r1+δr. Whether the parcel continues to
rise, or sinks back tor1 depends on the magnitude of the temperature gradient outside of
the parcel, |dT /dr|, between r1 andr2. If
dT
dr
rad
>
dT
dr
ad
, (1.19)
where the subscripts “rad” and “ad” denote the radiative and adiabatic temperature
gradients, the parcel exists in a region of convective instability and will continue to rise3.
One can use the diffusion equation in the form
T3 ∂T
∂Mr
=− 3κLint
256π2σ
Br4
, (1.20)
to determine the luminosity at which the stellar interior becomes stable against
convec-tion. Here, Mr is the mass of a spherical shell at radius, r, κ is the opacity, Lint is the
internally generated luminosity, and σB is the Stefan-Boltzmann constant. Combining
equation (1.20) with the equation of HE:
∂P
∂Mr
=−GMr
4πr4, (1.21)
it is possible to show that
T3∂T
∂P =
3κLint
64πσBGMr
. (1.22)
If the entropy, s, increases with radius, the region is stable against convection. At the
stability limit,
∂s
∂Mr
= 0, (1.23)
allowing the critical luminosity to be defined as:
Lcrit =
64πσBT3GMr
3κ
∂T ∂P
s=const.
. (1.24)
Then, if Lint < Lcrit, the stellar interior is stable against convection and a radiative core
forms.
As the star contracts, the internal temperature increases, resulting in an increasing
portion of the interior becoming ionised. The opacity becomes dominated by free-free and
bound-free transitions such that
κ∝ρT−7/2, (1.25)
and, as the temperature increases, the opacity decreases. It is clear from equation (1.24)
that a decrease in opacity leads to an increase inLcrit. At the same time, the contraction
leads to a reduction in the surface area at each layer within the star which, in turn, leads
to a reduction in Lint. The reduction ofLcrit occurs at a more rapid rate than that ofLint
and, whenLint drops belowLcrit, the interior becomes stable against convection, forming
a radiative core.
The difference between Herbig Ae/Be stars and TTSs is the timescale over which this
process occurs. Herbig Ae/Be stars are sufficiently massive that their interiors become
stable against convection before their envelopes have dispersed and they become optically
visible. As a result, they arrive at the stellar birthline with fully radiative interiors. In
comparison, TTSs emerge onto the stellar birthline whilst fully convective. The interiors of
“low mass” TTSs (.0.35 M) remain unstable to convection throughout their formation
and MS evolution and, as such, do not form a radiative core. The age at which TTSs
& 0.35 M develop radiative cores is mass-dependent and can be estimated from PMS
evolutionary models (e.g. D’Antona & Mazzitelli 1994; Baraffe et al. 1998; Siess et al.
2000; Tognelli et al. 2011). For example, using Siess et al. (2000) models, Gregory et al.
(2012) derived the age, in Myr, at which a star of mass, M?, (& 0.35 M) develops a
radiative core:
tcore≈
1.494M
M?
2.364
. (1.26)
Once formed, the radiative zone grows radially outwards until the TTS reaches the
ZAMS. Until the radiative region constitutes ∼75% of the total mass of the star, the rate
of energy flowing through the surface layers of the TTS is controlled by the convective
envelope. As a result, the TTS continues to evolve through the HRD with near-constant
effective temperature for a period of time following the formation of its radiative core
1.2. Pre-main sequence evolution
convective envelope falls below∼0.25M?. As the star is still contracting, andL? ∝R2?Teff4 ,
the surface temperature must also increase and the star then follows a Henyey track in
the HRD.
1.2.2 Evolution of the circumstellar environment
The circumstellar discs that form during the proto-stellar phase (Section 1.1.3) are found
to be ubiquitous around young TTS. The evolution of these discs relies on the presence
of an effective viscosity which enables material to migrate inwards and accrete onto the
central star. To understand this in more detail, consider a geometrically thin disc with
total mass, Mdisc M?, such that a parcel of mass, dm, at a distance, r, from the star
undergoes Keplerian rotation,
ΩK=
GM?
r3
1/2
. (1.27)
Adopting cylindrical coordinates (r,z,φ), the surface density, Σ, depends on the vertical
distance of the mass parcel from the disc midplane, denoted by z, and the density of the
disc,ρ(z), such that
dΣ =ρ(z)dz, (1.28)
and
dm= 2πrΣdr. (1.29)
The non-uniform rotation in the disc produces a velocity shear and, provided the disc
is viscous, a frictional force is exerted by neighbouring disc annuli (the nature of this
viscosity is considered in the following subsection). The magnitude of the frictional force
per unit length,f, along the circumference of an annulus located at a distance r from the
rotation axis is given by
f(r) =νrΣ∂Ω
∂r, (1.30)
whereν is the viscosity coefficient. The net torque of an annulus located atr+δr on an
annulus atr is then given by
G(r) = 2πr2νΣ
r∂Ω
∂r
. (1.31)
mo-mentum to the annulus at r+δr and migrates inward.
The rate of change of angular momentum is equal to the net torque such that
˙
J = D
Dt(jdm) =−dr
∂G
∂r = dm
Dj
Dt, (1.32)
wherej is the specific angular momentum of the annulus at radius r and D/Dtdenotes a
Lagrangian derivative. The right hand side of equation (1.32) is also given by
dmDj
Dt = dm
∂j
∂t +v· ∇j
= dm
vd
∂j ∂r
, (1.33)
where vd is the radial drift velocity. Then, by combining equation (1.29) with
equa-tions (1.32) and (1.33), it is possible to see that
2πrΣ
vd
∂j ∂r
=−∂G
∂r. (1.34)
As the rotation is Keplerian,j = (GM?r)1/2 and
∂j
∂r =
1
2ΩKr. (1.35)
Combining this with equation (1.27), one can rearrange equation (1.34) in terms of the
drift velocity:
vd=−
3
Σr1/2
∂
∂r(νΣr
1/2). (1.36)
Substituting this into the mass continuity equation for the surface density,
∂Σ
∂t +
1
r ∂
∂r(Σrvd) = 0, (1.37)
one obtains the equation that determines the evolution of the surface density,
∂Σ
∂t =
3
r ∂ ∂r
r1/2 ∂
∂r
νΣr1/2
(1.38)
1.2. Pre-main sequence evolution
Assuming that the viscosity is a power law in r and is time-independent,
ν ∝rγ, (1.39)
equation (1.38) has a similarity solution (Lynden-Bell & Pringle 1974) of the form
Σ(r) = C
3πν1Rγ
τ−(5/2−γ)/(2−γ)exp
"
−R
(2−γ)
τ
#
(1.40)
(Hartmann et al. 1998). Here,C is a scaling constant, a radial scale factor, r1, has been
introduced such that
R≡ r
r1
, (1.41)
and
ν1 ≡ν(r1), (1.42)
and τ is a non-dimensional time whereby
τ = t
ts
+ 1, (1.43)
where the viscous scaling time,
ts=
1
3(2−γ)2
r2
1
ν1
. (1.44)
The mass flux in such a disc is then given by
˙
M(r, t) =Cτ−(5/2−γ)/(2−γ)
"
1−2(2−γ)R
(2−γ)
τ
#
exp
"
−R
(2−γ)
τ
#
, (1.45)
and material in the inner regions of the disc migrates inwards and accretes onto the star.
At the same time, to conserve angular momentum, the outer regions of the disc must
expand. The radius at which the mass flux changes sign is known as the transition radius,
Rtrans, and, from inspection of equation (1.45), is given by
Rtrans=r1
τ
2(2−γ)
1/(2−γ)
(1.46)
(Hartmann et al. 1998). Thus, the rate at which mass is accreted onto the star and at
Possible forms of the viscosity
What produces the viscous forces within the disc is one of the hot topics of disc physics.
The molecular viscosity of the gas is unable to provide the observed mass accretion rates
(Pringle 1981) and alternative methods of driving turbulence in the disc have been
sug-gested, such as magneto-rotational instabilities (MRIs; Balbus & Hawley 1991; Tout &
Pringle 1992) and gravitational instabilities (GIs; e.g. Laughlin & Bodenheimer 1994).
The stability of the disc against the production of GIs is represented by the Toomre
Q parameter,
Q= κcs
πGΣ, (1.47)
(Toomre 1964) where, if Q & 1.3, non-axisymmetric GIs generate spiral density waves
(Laughlin & Bodenheimer 1994; see Fig. 1.4) which efficiently transport angular
momen-tum through the disc. Here, cs is the local sound speed and κis the epicyclic frequency4,
κ=
2Ω
r
d
dr(r
2Ω) 1/2
. (1.48)
It is possible to parameterise the stability of the disc against GIs using the mass ratio,
q =Mdisc/M?, which enters throughκ(= [GM?/R3]1/2if Ω = ΩK) and Σ (≈Mdisc/[πR2]),
and the disc temperature, T, which enters through cs (= RT /µ). For a disc to achieve
Q&1.3 and generate non-axisymmetric GIs, it must satisfy
q & cs
ΩR. (1.49)
For typical discs, a value of q >0.1 is required to become unstable to GIs. Observations
of disc around TTSs have revealed typical values of q ≈0.01 (e.g. Andrews et al. 2013).
As a result, these low mass discs are probably stable against GI production. However,
these discs would have been more massive at earlier times suggesting that GIs may provide
efficient angular momentum transport during the proto-stellar phase.
In the case of MRI, the viscosity is provided by the stellar magnetic field threading
into the inner regions of the disc or, in the outer disc, by the fossil magnetic field of the
disc itself. Consider a uniform vertical field, that penetrates through a Keplerian disc at
1.2. Pre-main sequence evolution
Figure 1.4: Spiral density perturbations, generated by GIs, imaged in the disc around SAO 206462, using the High Contrast Instrument for the Subaru Next Generation Adaptive Optics (HiCIAO). Credit: NAOJ/Subaru.
a distance,r, from the stellar surface. Then, consider two mass elements in the disc, m1
and m2, located atr and separated in the vertical direction byδz. The vertical field line
initially threads through m1 and m2. Now, consider a small radial displacement of m1
and m2 such that m1 now lies at r −δr and m2 at r +δr. This displacement creates
tension in the field line threading throughm1 andm2 which acts to slowm1 and speed up
m2, reducing the angular momentum of the former and increasing that of the latter. As
a result,m1 migrates closer to the star andm2 migrates outwards. This further increases
the tension and the process continues.
Now, consider the changes to the direction of the vertical field line induced by this
process. The radial drift of both m1 and m2 introduces a radial component to the
mag-netic field. In addition, asm1and m2 undergo Keplerian rotation,m1 has greater angular
velocity thanm2. The resulting twisting of the magnetic field line introduces an azimuthal
component. This weakens the vertical component of the field and generates MHD
turbu-lence (Balbus et al. 1996).
For MRIs to occur, (i) the disc must be in at least approximate Keplerian rotation;
(iii) the initial magnetic field must have a poloidal component; and (iv) the magnetic
energy density must be less than the thermal energy density (Gammie 1996; Turner et al.
2014). Ionisation can occur in the inner disc as a result of thermal ionisation and regions
further out in the disc can become ionised following irradiation by external cosmic rays
(Umebayashi & Nakano 1981). In the mid-regions of the disc (the so-called dead,undead
orzombie zones; Mohanty et al. 2013), which are not sufficiently ionised, the form of the
viscosity remains uncertain.
1.2.3 Disc dispersal
As the disc expands, the disc surface density decreases at large radii and the disc transitions
from optically thick to optically thin. Radiation from the stellar host and neighbouring
stars impacting on the optically thin regions of the disc launches a photo-evaporative wind
at the surface as the gas particles have sufficient energy to escape. The removal of the
shelter provided by the optically thick gas results in sublimation of the dust, which is
consequently also removed in the photo-evaporative wind.
Tidal interactions with neighbouring stars can also strip away material from the outer
regions of the disc or act as an external stirring mechanism, altering the dynamics of disc
material. This can increase or disrupt the accretion process or, alternatively, increase the
relative velocities of planetesimals within the disc. In turn, this latter process increases
the likelihood of collisions between planetesimals resulting in fragmentation rather than
sticking, inhibiting planet formation and possibly resulting in a debris disc (Backman &
Paresce 1993).
Stars forming in regions containing O- and B-type stars (e.g. the Orion Nebula Cluster;
ONC) are subject to the strong stellar winds emanating from these objects. These can
strip away the enveloping and disc material (see Fig. 1.5). For example, Mann et al.
(2014) found that discs in the ONC located around stars within a projected distance of
0.03 pc from the massive O star,θ1Ori C were less massive than those located at a greater
distance.
Once initiated, the process of disc clearing is rapid (∼ 0.1 Myr; Alexander et al.
2006a,b). This is highlighted by the comparatively fewtransitional discs (Fig. 1.1d) which
near-1.2. Pre-main sequence evolution
Figure 1.5: The Orion proplyds. Hubble Space Telescope images of protoplanetary discs in the Trapezium region of the ONC. The discs are observed in silhouette against the bright nebulous background. Some proplyds also display cometary-like tails caused by irradiation by the hot, neighbouring O-type star, θ1 Ori C. Credit:
Figure 1.6: ALMA image of the disc around HL Tau. The dark rings visible in the im-age may indicate gaps in the disc, cleared out by planets as they accrete gas and dust. Credit: ALMA (NRAO/ESO/NAOJ); C. Brogan, B. Saxton (NRAO/AUI/NSF).
infrared (NIR) excess, indicating the presence of an inner hole in the disc (e.g. Gutermuth
et al. 2008; Megeath et al. 2012).
Forming planets within the disc
If the disc is sufficiently massive compared to its stellar host (Mdisc & 0.1M?), it may
be possible for planets to form via gravitational collapse due to the presence of GIs (see
Section 1.2.2). If the Toomre parameter, 1< Q.1.3, axisymmetric gravitational
pertur-bations can survive within the disc. The disc is likely to fragment, leading to the formation
of low-mass binary companions (Stamatellos et al. 2007a) or giant planets (Rafikov 2005).
Alternatively, planets may form via core-accretion. In this case, dust grains, sheltered
from the stellar radiation by the optically thick gas, grow in size through coagulation
(Lissauer 1993; Lissauer & Stewart 1993). As the grains grow, they de-couple from the
1.2. Pre-main sequence evolution
Figure 1.7: Temporal evolution of the disc fraction, measured using NIR and MIR excesses, taken from Sicilia-Aguilar et al. (2006). cAAS. Reproduced with permission.
increase in the local dust density which, in turn, increases the rate of collisions between
particles. Assuming that the increased density of dust does not alter the distribution
of collision velocities, this leads to further grain growth. The grains grow into pebbles
which themselves collide and form planetesimals. As a planetesimal continues to gain
mass through collisions, its escape velocity increases, allowing the planetesimal to acquire
a gaseous envelope.
The role of planet formation in dispersing the disc can be seen in Fig. 1.6. Here,
dark lanes are observed to be present within the disc of HL Tau, indicating the possible
presence of planets which have cleared a gap in the disc via accretion of disc material
(ALMA Partnership et al. 2015).
Surveys of disc fractions in various nearby star forming regions have been used to
constrain the typical disc lifetime (see Fig. 1.7). In turn, the lifetimes of circumstellar
discs set the timescales for planet formation. The accuracy with which one may estimate
the disc lifetime ultimately depends on the accuracy with which one is able to assign
stellar ages (c.f. Naylor 2009; see Section 2.4) and identify disc-hosting young stellar
objects (YSOs). For instance, Haisch et al. (2001) found that half of PMS stars had lost
their accretion discs by an age of only 3 Myr, based on NIR disc classifications. However,
of ∼5 Myr (Padgett et al. 2006; Hillenbrand et al. 2008). The methods used to reliably distinguish between accretion-disc hosting and disc-less stars are discussed in more detail
in the following section.
1.3
Observing the stages of star formation
1.3.1 Evolution of the circumstellar environment
The theoretical descriptions of proto-stellar and PMS evolution presented in Sections 1.1
and 1.2 enable astronomers to observationally identify YSOs at various epochs of star
formation. YSOs have traditionally been grouped into four evolutionary classes based
on the form of their spectral energy distributions (SEDs; Lada & Wilking 1984; Adams
et al. 1987; Lada 1987; Andre et al. 1993). The proto-stellar phase is subdivided into two
observational stages, denoted Class 0 and Class I whereby a Class 0 YSO is pre-stellar and
a Class I YSO is proto-stellar. The PMS phase is also split into two with Class II YSOs
harbouring accretion discs and Class III YSOs being disc-less.
Due to the isothermal nature of pre-stellar cores, their SEDs resemble modified
black-bodies at a temperature of∼30 K. The emission peaks at 30-100µm (Fig. 1.8a), requiring
submm observations for detection. As the YSO enters the proto-stellar phase, the
cir-cumstellar envelope remains optically thin to infra-red (IR) radiation so the SED still
features long wavelength emission. However, the photosphere of the newly-formed
quasi-hydrostatic core and its circumstellar disc also contribute significantly to the SED at MIR
wavelengths (Fig. 1.8b).
The SED of a Class II YSO resembles a blackbody with additional IR and ultra-violet
(UV) excess emission (Fig. 1.8c). The UV excess is associated with accretion (see
Sec-tion 1.3.3) and the IR excess is produced by circumstellar material re-emitting absorbed
stellar radiation at longer wavelengths (Mendoza V. 1968; Cohen 1973). As the stellar
photosphere is visible at optical wavelengths, this circumstellar material cannot be
spheri-cally distributed: the extinction that would result from the observed IR excess emission is
∼100−1000 magnitudes while observed extinction levels are.3 magnitudes. As such, the
observer must have an almost clear view of the stellar photosphere and the circumstellar
1.3. Observing the stages of star formation
Figure 1.9: Example of model SED fits to multi-wavelength observations of (a) a Class II and (b) a transitional disc, taken from figure 1 of Robitaille et al. (2007). The black circles represent actual data, the black line marks the best-fit model, and the grey lines mark the remaining good-fits to the data. The dashed line shows the SED of the stellar photosphere. cAAS. Reproduced with permission.
As the disc dissipates, it enters a period of transition between a Class II and Class
III YSO. During this time, the NIR (and possibly MIR) excess emission seen for Class
II YSOs disappears while the FIR excess remains (see Fig. 1.9). This indicates that the
warmer dust grains present in the inner regions of the disc, closer to the stellar host, are
no longer present but the cooler grains in the outer disc are still present. As the IR part of
the SED is only sensitive to the dust component of the disc, there may still be gas present
within the inner regions of the disc. If the star is still accreting this gas from the disc, the
SED may still display a UV excess but this would be weak in comparison to that observed
in Class II YSO SEDs.
By the time a PMS star reaches the Class III stage, accretion has ceased, the disc has
dispersed, and the SED resembles that of a blackbody (Lada & Wilking 1984; Lada 1987)
with peak emission at the effective temperature of the photosphere.
IR diagnostics
If a YSO is observed over a sufficient wavelength range, its SED can be constructed.
Comparison of this observed SED to a range of model SEDs can then be used to classify
the object (e.g. Robitaille et al. 2007). An example of this process is illustrated in
Fig. 1.9. Often, the wavelength coverage is insufficient for this and classification methods
focus solely on the IR part of the SED (λ≈2.0−25µm; Lada 1987; Greene et al. 1994).