ISSN Online: 2159-4481 ISSN Print: 2159-4465
DOI: 10.4236/jsip.2019.102004 May 6, 2019 37 Journal of Signal and Information Processing
RSSI Based Localization of Bluetooth Devices
for Visually Impaired
Muhammad Irfan Aziz1, Thomas Owens2, Uzair Khaleeq-uz-Zaman3, Muhammad Bashir Akbar1
1National University of Sciences and Technology, Islamabad, Pakistan
2Department of Electronic and Computer Engineering Brunel University, West London, UK
3Laboratoire de Conception Fabrication Commande, Ecole Nationale Supérieure d’Arts et Métiers, Metz, France
Abstract
Localization for visually impaired people in dynamically changing environ-ments with unexpected hazards and obstacles is a current need. Many tech-niques have been discussed in the literature with respect to location-based services and techniques used for the positioning of devices. Time difference of arrival (TDOA), time of arrival (TOA) and received signal strength (RSS) have been widely used for the positioning but narrow band signals such as Bluetooth cannot efficiently utilize TDOA or TOA. Received signal strength indicator (RSSI) to measure RSS, has been found to be more reliable. RSSI measurement estimations depend heavily on the environmental interference. RSSI measurement estimations of Bluetooth systems can be improved either by improving the existing methodologies used to implement them or by using fusion techniques that employ Kalman filters to combine more than one RSSI method to improve the results significantly. This paper focuses on improving the existing methodology of measuring RSSI by proposing a new method us-ing trilateration for localization of Bluetooth devices for visually impaired people. To validate the new method, class 2 Bluetooth devices (Blue Giga WT-12) were used with an evaluation board. The software required was de-veloped in National Instruments LabView. The PCB was designed and man-ufactured as well. Experiments were then conducted, and surface plots of Bluetooth modules were obtained to show the signal interference and other environmental effects. Lastly, the results were discussed, and relevant conclu-sions were drawn.
Keywords
Bluetooth, Localization, Navigation Assistance, Received Signal Strength Indicator, Visually Impaired
How to cite this paper: Aziz, M.I., Owens, T., Khaleeq-uz-Zaman, U. and Akbar, M.B. (2019) RSSI Based Localization of Bluetooth Devices for Visually Impaired. Journal of Signal and Information Processing, 10, 37-57.
https://doi.org/10.4236/jsip.2019.102004
Received: March 20, 2019 Accepted: May 3, 2019 Published: May 6, 2019
Copyright © 2019 by author(s) and Scientific Research Publishing Inc. This work is licensed under the Creative Commons Attribution International License (CC BY 4.0).
http://creativecommons.org/licenses/by/4.0/
DOI: 10.4236/jsip.2019.102004 38 Journal of Signal and Information Processing
1. Introduction
The navigation from one place to another addressing the security and mobility of visually impaired persons travelling through city streets and buildings in un-familiar environments is a major political and technical challenge for modern society [1][2]. According to the World Health Organization (WHO), estimated 253 million people live with vision impairment of which 36 million are blind and 217 million have moderate to severe vision impairment [3]. The knowledge typ-ically required for navigation by the blind is a mixture of declarative and route knowledge [4]. Most of the time visually impaired persons must rely on regular and repetitive routes with the least obstructions. They often participate in orien-tation and mobility (O & M) sessions where instructors provide training to get familiar with a new space. However, due to dynamically changing environments with unexpected hazards and obstacles, localization and location-based services (LBS) which are adaptable, time saving, cost- and user-friendly, are needed [5] [6]. The Global positioning system (GPS) has been used over the years with un-paralleled success for outdoor environments [7][8] but for localization indoors, or near high rise structures, GPS deteriorates considerably due to technical con-straints such as shadowing and multi-path disturbances. Moreover, GPS must rely on relative positioning incorporating sensors like digital tags, active badges, thermistors, accelerometers, photodiodes and beacons [9]. Therefore, alterna-tives such as ultrasound [10], radio frequency identification transponders [11], using a robotic dog-guide [12], or an instrumented white cane [13], have been used for mobility and indoor orientation tasks for visually impaired people. For indoor human position sensing, real-time location systems (RTLS) based on dis-tributed wireless sensor networks have also been in use. For instance, ul-tra-wide-band (UWB), wireless LAN (WLAN), and radio frequency identifica-tion (RFID) have been combined with a building informaidentifica-tion model (BIM) to propose an emergency navigation system for use in complex buildings [14]. Furthermore, radio map approaches using Bluetooth and Wi-Fi have also as-sisted in providing an indoor positioning system (IPS) [15].
DOI:10.4236/jsip.2019.102004 39 Journal of Signal and Information Processing Signals from Access Points (APs) can be read and calculated by RSSI methods and the system is implemented in devices capable of Bluetooth technology using trilateration methods.
Bluetooth wireless is a short-range communications technology originally in-tended to replace the cables connecting portable and/or fixed devices while maintaining high levels of security. Bluetooth-based localization is a not a novel idea but due to the limitations of the original Bluetooth specification this ap-proach has not been widely used [19]. Bluetooth transmitters, when invoked by the users, transmit pre-recorded voice messages if installed at regular intervals. Hence, they provide information about users’ current position and nearby points of interests [20]. Devices capable of the Bluetooth function can connect several other devices to Personal Area Networks (PANs) and positioning error can be reduced by constructing an accurate and proper position algorithm, and by im-proving the RSSI reading accuracy [21]. Further, compared to Ethernet based WiFi networks, the available services of Bluetooth and their discovery are rela-tively simple, allowing the communication to go more smoothly.
The Bluetooth, in general, has been primarily used for data transfer. This pa-per proposes a new methodology using trilateration for localization of Bluetooth devices using RSSI for visually impaired people. To validate the proposed me-thod class 2 Bluetooth devices (Blue Giga WT-12) were used along with an eval-uation board. The required software was developed in National Instruments LabView. The Printed Circuit Board (PCB) used for validation was designed and manufactured. Experiments were then conducted, and surface plots of Bluetooth modules were obtained to show the signal interferences and other environmen-tal effects. The rest of the paper is divided as follows: Section 2 presents a litera-ture review of localization methods with a special focus on RSSI based localiza-tion of Bluetooth devices for visually impaired people; Seclocaliza-tion 3 presents the proposed methodology; Section 4 describes the conducted practical experiments; and finally, Section 5 discusses the results of the experiments and the conclu-sions drawn.
2. Literature Review
For visually impaired people, being able to connect with social activities is a dif-ficult task, especially when it requires navigation in an outdoor environment. By focusing on residual senses, visually impaired people can sense and learn the surrounding environment through multi-sensory channels and O & M sessions. These guidelines help them identify specific landmarks (navigation cues) which are then used in the construction of a mental map [22] But due to dynamically changing environments, the commute of the visually impaired can no longer just rely on these so-called “mental maps”.
DOI: 10.4236/jsip.2019.102004 40 Journal of Signal and Information Processing the past that use both GPS and geographic information system (GIS) in smart-phones such as VoiceOver, a screen reader built into the system that enables the visually impaired to access information via spoken descriptions, TapTapSee which enables the camera to identify objects and speak out loud to the user, and BlindSquare which provides information about the surrounding environment in terms of points of interest with an audible feedback. As GPS has limited indoor applications because of its limitations, researchers have studied a lot of Indoor Positioning Systems (IPSs).
The RFIDs have been extensively used for indoor navigation purposes. Park and Hashimoto [23] used an electric wheel chair as a robot and passive RFIDs installed in a grid. A passive RFID information grid was also proposed by Willis and Helal [24] to aid the blind on a college campus. RFID tags were further em-ployed by Maneesilp et al. [25]to implement a 3D localization system. To main-tain orientation of blind persons during walking, Amemiya et al. [26] used active RFID tags to simulate virtual leading blocks analogous to conventional leading blocks, which are pavement blocks with a serrated surface. A combination of RFID tags, RFID cane reader and personal digital assistant (PDA) was also used by D’Atri et al. [27] to define orientation of visually impaired people with re-spect to both origin and destination.
pede-DOI:10.4236/jsip.2019.102004 41 Journal of Signal and Information Processing strian dead reckoning (PDR) with a weighted path loss (WPL) algorithm that was based on the log-distance path loss model between a router and a client, under an extended Kalman filter. Danis and Cemgil [37] constructed a model tailored specifically for RSSI fingerprints. RSSI schemes are further being used widely almost everywhere in WLAN to give location aware services [38]. In ad-dition, finding the maximum value for RSSI is important in localization and was found by Sahu et al. [39] by calculating a polynomial for all the RSSI and then selecting the highest value. It was found that fluctuations in RSSI values in-creased as the terrain changed from plain to uneven and therefore, calculating the point of intersection of the perpendiculars that pass through the maximum RSSI point, determined the sensor position. Frequency Modulation (FM) and WiFi vectors for RSSI were combined to check the effect on localization accuracy by Chen et al. [40].
Bluetooth refers to an open specification for a technology which enables short-range wireless voice and data communications. The most common forms of telecommunications across the world operate over licensed bandwidths pro-ducing revenues for governments. A core idea behind Bluetooth was to make it free of the restrictions associated with licensed bandwidths. So, it was designed to operate over the Industrial, Scientific and Medical (ISM) band of 2.4 GHz which is free to use in most of the world [41]. At only room level, a low-cost Bluetooth-based positioning system was developed by Cheung et al. [42]. The system required a beacon which had to be initialized and wrapped thereby re-quiring lot of on-site time and was not being able to recover in cases of power outages. Such systems can only be applicable in scenarios where a few beacons or tolerance of longer positioning determination times are required. Further, Blu-epass was developed by Diaz et al. [43] to be suitable for different indoor envi-ronments. Hossain and Soh [44] evaluated different characteristics of Bluetooth like RSSI, link quality (LQ), transmit power level, etc., and concluded that a combination of LQ and RSSI is a viable option for localization purposes. To conclude that only positive values of RSSI can be used for a functional approxi-mation of the distance between a receiver and a transmitter, Feldmann et al. [45]
DOI: 10.4236/jsip.2019.102004 42 Journal of Signal and Information Processing greatly improved the overall reliability and accuracy of the system.
Based on the literature reviewed and the over-arching aim of this research, it has been found that the methods proposed in the literature with respect to de-termining the RSSI of Bluetooth systems can be further improved either by im-proving the existing methodologies to implement them or using fusion tech-niques by employing Kalman filters to combine more than one method in order to improve the results significantly. This paper focuses on the techniques for improving the existing methodology for measuring RSSI and then finding the source to help localization of the subject from the Bluetooth devices.
3. Proposed Methodology
3.1. Trilateration Using RSSI
Trilateration works by measuring the distances between two points and then solving for the desired results using geometry of circles, spheres and/or triangles
[49]. Since, RSSI is very difficult to measure accurately due to many reasons such as multipath fading, reflections, environmental noises, and conditions. There is no standard formula for using RSSI to measure distance in all the scenarios. In most cases, a calibration is done with known parameters, and then based on the data, a formula is used to calculate unknown location.
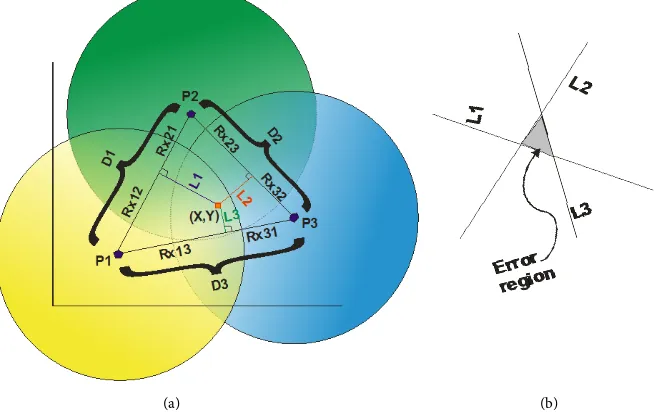
In this paper, a different approach was adopted from that available in litera-ture for trilateration. Instead of finding the circles of power, the normal to line connecting the circles was determined as explained below. If we assume that the object of interest is transmitting an RF signal which can be heard by at least three different receivers, then depending upon the power received by each of them, trilateration can be done (see Figure 1).
Figure 1(a) shows three unique receivers: P1, P2 and P3, marked by their area
of listening as yellow, green and blue, respectively. The object of interest (A) for which triangulation is intended and is at point (x, y). Since the coordinates of P1,
P2 and P3 are fixed and known, the distances between them (such as D1, D2 and
D3) are also known. P1, P2 and P3 make a triangle and three perpendiculars are
drawn from each side of the triangle to the location of (x, y). These perpendicu-lars are L1, L2 and L3 respectively, and each divide lines D1, D2 and D3 in such a way that D1 is broken into two segments Rx12 and Rx21 with
1 x12 x21
D =R +R , D2 is broken into Rx23 and Rx32 with D2 =Rx23+Rx32; and
D3 into Rx13 and Rx31 with D3 =Rx13+Rx31, respectively. If equations of lines 1
L , L2 and L3 are found, the error-region or probable location of point (x, y) can be found as illustrated in Figure 1(b).
Since RSSI given by P is a direct gauge of the distance R, i.e., 2
1
P R
∝ , the
re-lationship between receivers P1 and P2 can be depicted by Equation (1):
2 @1 21 @ 2 12
RSSI x
RSSI x
P R
P R
=
DOI:10.4236/jsip.2019.102004 43 Journal of Signal and Information Processing (a) (b)
Figure 1. (a) Overlapping areas of three receivers depending upon Theoretical RSSI. (b) Error region depicting position of actual target.
where PRSSI@1 and PRSSI@ 2 are the received powers at P1 and P2, respectively
while Rx21 and Rx12 are the distances aggregated to show the distance
be-tween receivers P1 and P2. (1) can be re-written as shown in Equation (2),
1 12 @1 @ 2 1 x RSSI RSSI D R P P = + (2)
Similarly, Rx23 and Rx31 can be obtained as shown in Equations (3) and
(4): 2 23 @ 2 @ 3 1 x RSSI RSSI D R P P = + (3) 3 31 @ 3 @1 1 x RSSI RSSI D R P P = + (4)
Once Rx12 is known, Rx21 can be found in a similar way as can Rx32 and
13 x
R . The crossing points of L1 (xD1,yD1) on D1, L2 (xD2,yD2) on D2 and L3 (xD3,yD3) on D3 are given by Equations (5), (6), and (7), respective-ly:
(
)
(
)
12 1 1 2 1
1
12 1 1 2 1
1 x D x D R
x x x x
D
R
y y y y
DOI: 10.4236/jsip.2019.102004 44 Journal of Signal and Information Processing
(
)
(
)
23 2 2 3 2
2
23 2 2 3 2
2 x D x D R
x x x x
D
R
y y y y
D = + − = + − (6)
(
)
(
)
31 3 3 1 33
31 3 3 1 3
3 x D x D R
x x x x
D
R
y y y y
D = + − = + − (7)
Using basics from trigonometry, the final equations of L1, L2 and L3 can be known as shown in Equations (8), (9), and (10) respectively:
(
) (
1 2)
212 1 2
1 1 2 1
2 1 1 2 1
x
L L
x x R
x x
y x y y
y y D y y
− − = + − + − −
, (8)
(
) (
2 3)
22 3 23
2 2 3 2
3 2 2 3 2
x
L L
x x
x x R
y x y y
y y D y y
− − = + − + − −
, (9)
(
) (
1 2)
212 1 2
1 1 2 1
2 1 1 2 1
x
L L
x x R
x x
y x y y
y y D y y
− − = − + − + −
, (10)
The solution of these lines (their intersection with each other) will result in the error triangle. The area inside the triangle is the probable location of the transmitter.
3.2. Bluetooth Module
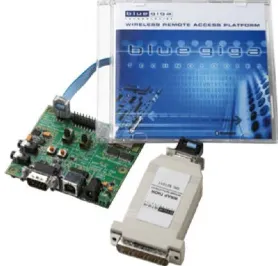
The Bluetooth Module used was one of the Blue Giga WT-12 modules as shown in Figure 2. The module is a class 2 Bluetooth device with a range of 10 meters. This module had its own built-in chip antenna.
The WT-12 Bluetooth module also comes with an evaluation board, having all the basic communication interfaces already installed and working. The evalua-tion board as shown in Figure 3 was used as an inquiry generator for all the five Bluetooth receivers.
3.3. Graphical User Interface (GUI) for Calculating RSSI
DOI:10.4236/jsip.2019.102004 45 Journal of Signal and Information Processing Figure 2. The Blue Giga WT-12
[image:9.595.305.444.203.336.2]Blu-etooth module.
Figure 3. WT-12 evaluation board.
Figure 4. The GUI for calculating RSSI through inquiries.
[image:9.595.208.541.370.550.2]DOI: 10.4236/jsip.2019.102004 46 Journal of Signal and Information Processing 3.4. Design and Manufacture of PCB for Bluetooth Module
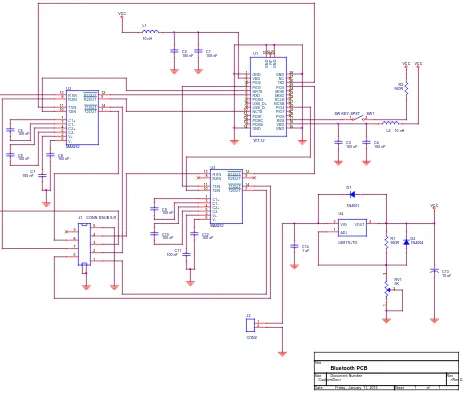
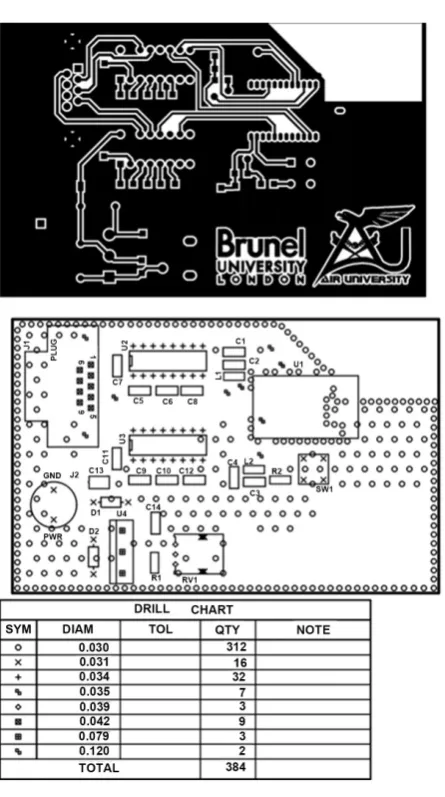
[image:10.595.64.527.315.713.2]The PCB was indigenously designed and manufactured. The schematic diagrams of the PCB are shown in Figure 5. OrCad software was used to design and de-velop the two layered PCB and importance was given to the antenna portion of the Bluetooth module, as it was supposed to be copper free on both sides along with grounding holes on both top and bottom layers with copper pour. All the footprints of the components were also made from scratch. The footprint for Bluetooth module was quite challenging due to probability of RF interference being generated if the footprint was not proper. Interconnection among the RS-232 ports, Power supply and WT-12 module was kept at minimum to reduce the effect of radiation on long wires. The design of the PCB was quite a chal-lenging task since it required that the PCB should not only be error free, but also noise free, as mixed signal noise could hamper the performance of the Bluetooth module severely. Moreover, the PCB was a double-sided board and its layers are shown in Figure 6.
Figure 5. Schematic diagram of indigenously designed WT-12 Bluetooth module.
C2 100 nF
SW1 SW KEY -SPST
1 2 R2 560R D1 1N4001 C9 100 nF VCC
L2 10 nH L1 10 nH C13 10 uF U4 LM317L/TO 3 1 2 VIN ADJ VOUT C1 100 nF C11 100 nF C5 100 nF C14 1 uF U1 WT-12 1 2 3 4 5 6 7 8 9 10 11 12 13 14 15 16 17 18 19 20 21 22 23 24 25 26 27 28 2 9 3 0 3 1 GND VDD PIO2 PIO3 NRTS RXD PCMO USB_D+ USB_D-NCTS PCMI PCMC PCMS GND GND VDD RES PIO6 PIO7 PIO4 NCSB SCLK MISO MOSI PIO5 TXD NC GND GN D RF GN D VCC C8 100 nF R1 560R U2 MAX232 1 3 4 5 2 6 12 9 11 10 13 8 14 7 C1+ C1-C2+ C2-V+ V-R1OUT R2OUT T1IN T2IN R1IN R2IN T1OUT T2OUT C7 100 nF C4 100 nF C3 100 nF C6 100 nF C12 100 nF VCC
<Doc> <Rev Code>
Bluetooth PCB
Custom
1 1
Friday , January 11, 2013 Title
Size Document Number Rev
Date: Sheet of
C10
100 nF D2
1N4004 J1 CONN DSUB 9-R
DOI:10.4236/jsip.2019.102004 47 Journal of Signal and Information Processing Figure 6. Various PCB layers and its layout.
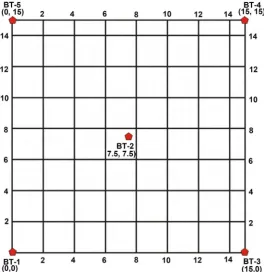
4. Experiments
In this experiment five Bluetooth modules were placed on a grid of 15 × 15 ft as shown in Figure 7, at coordinates of (0,0), (15,0), (7.5,7.5), (0,15) and (15,15). These modules were pre-calibrated, so that their response curve was already known. The inquiry module (WT-12 Evaluation Board connected to the Laptop) was placed at each grid point, starting from (2,0) ft, (4,0) ft and so on till (14,0) ft and then it was moved to (0,2) ft, (2,2) ft and so on up to (15,2) and this process continued until all the 77-grid points were covered except (0,0) ft, (15,0) ft, (0,15) ft and (15,15) ft since they were occupied by the four receiver modules with the fifth one at (7.5,7.5) ft. At each point 25 inquiry recordings were made for each receiver. At each grid-point, 25 inquiries were initiated to each receiver and sig-nal strength (RSSI) was recorded for the replied sigsig-nal.
DOI: 10.4236/jsip.2019.102004 48 Journal of Signal and Information Processing Figure 7. A 15 × 15 feet Grid for RSSI Experiment.
and so on, with 1000 readings at each point. The average values of these 1000 readings at each point are shown in Table 1. The first column is for a distance of 2 feet with last column for 22 feet with each row showing the RSSI measured at that distance.
5. Results and Discussion
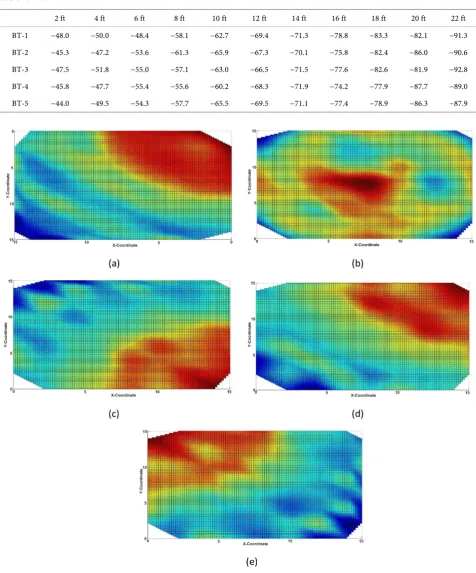
The results of the measured signals at all five receiver are given in Table 2. For better visual depiction, the surface plots of measured signals at all the five Blu-etooth modules are shown in Figure 8. In each surface plot, strong and weak points of the Bluetooth signal strength are shown where the red area depicts the strongest signal strength, the blue area shows the weakest signal strength and the yellow area shows strength between strongest and weakest signals. In ideal cases, the transition from red to yellow to blue should be smooth, with the transmitter closer to the receiver there should be a lot of red and once the transmitter is moved further away, the surface plot should show more blue. But in practice it is not the case due to many reasons such as atmospheric conditions, environmental noise, multipath fading, and ground reflections. These factors affect the actual signal being received at the receiver end, which could make calculations much more complicated.
DOI:10.4236/jsip.2019.102004 49 Journal of Signal and Information Processing Table 1. Mean of calibration data of all five modules of Bluetooth.
2 ft 4 ft 6 ft 8 ft 10 ft 12 ft 14 ft 16 ft 18 ft 20 ft 22 ft
BT-1 −48.0 −50.0 −48.4 −58.1 −62.7 −69.4 −71.3 −78.8 −83.3 −82.1 −91.3
BT-2 −45.3 −47.2 −53.6 −61.3 −65.9 −67.3 −70.1 −75.8 −82.4 −86.0 −90.6
BT-3 −47.5 −51.8 −55.0 −57.1 −63.0 −66.5 −71.5 −77.6 −82.6 −81.9 −92.8
BT-4 −45.8 −47.7 −55.4 −55.6 −60.2 −68.3 −71.9 −74.2 −77.9 −87.7 −89.0
BT-5 −44.0 −49.5 −54.3 −57.7 −65.5 −69.5 −71.1 −77.4 −78.9 −86.3 −87.9
Figure 8. Surface plot of Bluetooth modules as seen from top at (a) BT-1 (b) BT-2 (c) BT-3 (d) BT-4 (e) BT-5.
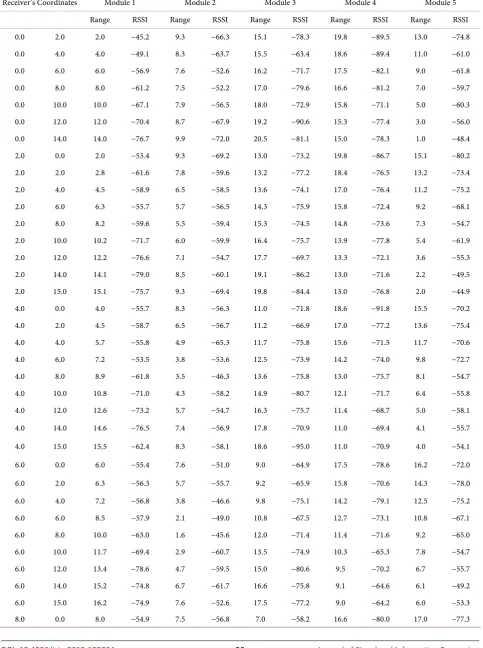
DOI: 10.4236/jsip.2019.102004 50 Journal of Signal and Information Processing Table 2. Mean of measured data over 15 times 15 ft grid. A set of 25 measurements were made at each grid point.
Receiver’s Coordinates Module 1 Module 2 Module 3 Module 4 Module 5
Range RSSI Range RSSI Range RSSI Range RSSI Range RSSI
0.0 2.0 2.0 −45.2 9.3 −66.3 15.1 −78.3 19.8 −89.5 13.0 −74.8
0.0 4.0 4.0 −49.1 8.3 −63.7 15.5 −63.4 18.6 −89.4 11.0 −61.0
0.0 6.0 6.0 −56.9 7.6 −52.6 16.2 −71.7 17.5 −82.1 9.0 −61.8
0.0 8.0 8.0 −61.2 7.5 −52.2 17.0 −79.6 16.6 −81.2 7.0 −59.7
0.0 10.0 10.0 −67.1 7.9 −56.5 18.0 −72.9 15.8 −71.1 5.0 −60.3
0.0 12.0 12.0 −70.4 8.7 −67.9 19.2 −90.6 15.3 −77.4 3.0 −56.0
0.0 14.0 14.0 −76.7 9.9 −72.0 20.5 −81.1 15.0 −78.3 1.0 −48.4
2.0 0.0 2.0 −53.4 9.3 −69.2 13.0 −73.2 19.8 −86.7 15.1 −80.2
2.0 2.0 2.8 −61.6 7.8 −59.6 13.2 −77.2 18.4 −76.5 13.2 −73.4
2.0 4.0 4.5 −58.9 6.5 −58.5 13.6 −74.1 17.0 −76.4 11.2 −75.2
2.0 6.0 6.3 −55.7 5.7 −56.5 14.3 −75.9 15.8 −72.4 9.2 −68.1
2.0 8.0 8.2 −59.6 5.5 −59.4 15.3 −74.5 14.8 −73.6 7.3 −54.7
2.0 10.0 10.2 −71.7 6.0 −59.9 16.4 −75.7 13.9 −77.8 5.4 −61.9
2.0 12.0 12.2 −76.6 7.1 −54.7 17.7 −69.7 13.3 −72.1 3.6 −55.3
2.0 14.0 14.1 −79.0 8.5 −60.1 19.1 −86.2 13.0 −71.6 2.2 −49.5
2.0 15.0 15.1 −75.7 9.3 −69.4 19.8 −84.4 13.0 −76.8 2.0 −44.9
4.0 0.0 4.0 −55.7 8.3 −56.3 11.0 −71.8 18.6 −91.8 15.5 −70.2
4.0 2.0 4.5 −58.7 6.5 −56.7 11.2 −66.9 17.0 −77.2 13.6 −75.4
4.0 4.0 5.7 −55.8 4.9 −65.3 11.7 −75.8 15.6 −71.5 11.7 −70.6
4.0 6.0 7.2 −53.5 3.8 −53.6 12.5 −73.9 14.2 −74.0 9.8 −72.7
4.0 8.0 8.9 −61.8 3.5 −46.3 13.6 −75.8 13.0 −75.7 8.1 −54.7
4.0 10.0 10.8 −71.0 4.3 −58.2 14.9 −80.7 12.1 −71.7 6.4 −55.8
4.0 12.0 12.6 −73.2 5.7 −54.7 16.3 −75.7 11.4 −68.7 5.0 −58.1
4.0 14.0 14.6 −76.5 7.4 −56.9 17.8 −70.9 11.0 −69.4 4.1 −55.7
4.0 15.0 15.5 −62.4 8.3 −58.1 18.6 −95.0 11.0 −70.9 4.0 −54.1
6.0 0.0 6.0 −55.4 7.6 −51.0 9.0 −64.9 17.5 −78.6 16.2 −72.0
6.0 2.0 6.3 −56.3 5.7 −55.7 9.2 −65.9 15.8 −70.6 14.3 −78.0
6.0 4.0 7.2 −56.8 3.8 −46.6 9.8 −75.1 14.2 −79.1 12.5 −75.2
6.0 6.0 8.5 −57.9 2.1 −49.0 10.8 −67.5 12.7 −73.1 10.8 −67.1
6.0 8.0 10.0 −63.0 1.6 −45.6 12.0 −71.4 11.4 −71.6 9.2 −65.0
6.0 10.0 11.7 −69.4 2.9 −60.7 13.5 −74.9 10.3 −65.3 7.8 −54.7
6.0 12.0 13.4 −78.6 4.7 −59.5 15.0 −80.6 9.5 −70.2 6.7 −55.7
6.0 14.0 15.2 −74.8 6.7 −61.7 16.6 −75.8 9.1 −64.6 6.1 −49.2
6.0 15.0 16.2 −74.9 7.6 −52.6 17.5 −77.2 9.0 −64.2 6.0 −53.3
DOI:10.4236/jsip.2019.102004 51 Journal of Signal and Information Processing
Continued
8.0 2.0 8.2 −56.3 5.5 −52.7 7.3 −55.5 14.8 −78.4 15.3 −75.3
8.0 4.0 8.9 −63.8 3.5 −48.5 8.1 −53.2 13.0 −75.6 13.6 −73.9
8.0 6.0 10.0 −73.6 1.6 −48.6 9.2 −63.3 11.4 −70.2 12.0 −72.9
8.0 8.0 11.3 −63.4 0.7 40.5 10.6 −67.4 9.9 −70.3 10.6 −67.7
8.0 10.0 12.8 −75.6 2.5 −58.0 12.2 −77.0 8.6 −59.6 9.4 −68.4
8.0 12.0 14.4 −71.7 4.5 −59.3 13.9 −76.8 7.6 −52.5 8.5 −56.4
8.0 14.0 16.1 −74.9 6.5 −57.9 15.7 −69.1 7.1 −58.7 8.1 −54.7
8.0 15.0 17.0 −79.4 7.5 −49.5 16.6 −80.8 7.0 −54.3 8.0 −53.6
10.0 0.0 10.0 −69.2 7.9 −58.3 5.0 −60.9 15.8 −69.0 18.0 −73.5
10.0 2.0 10.2 −72.7 6.0 −56.4 5.4 −58.7 13.9 −75.7 16.4 −70.0
10.0 4.0 10.8 −64.2 4.3 −54.0 6.4 −54.6 12.1 −74.7 14.9 −81.9
10.0 6.0 11.7 −71.0 2.9 −57.7 7.8 −55.3 10.3 −65.3 13.5 −78.9
10.0 8.0 12.8 −73.4 2.5 −56.3 9.4 −69.1 8.6 −62.4 12.2 −66.6
10.0 10.0 14.1 −76.5 3.5 −54.7 11.2 −71.5 7.1 −57.1 11.2 −68.6
10.0 12.0 15.6 −72.8 5.1 −63.3 13.0 −75.7 5.8 −56.0 10.4 −72.2
10.0 14.0 17.2 −77.0 7.0 −57.1 14.9 −78.0 5.1 −64.6 10.1 −73.0
10.0 15.0 18.0 −75.2 7.9 −55.3 15.8 −70.3 5.0 −59.0 10.0 −71.1
12.0 2.0 12.2 −72.9 7.1 −57.0 3.6 −51.3 13.3 −74.6 17.7 −64.8
12.0 4.0 12.6 −69.9 5.7 −56.2 5.0 −62.0 11.4 −70.6 16.3 −80.4
12.0 6.0 13.4 −76.7 4.7 −63.6 6.7 −59.1 9.5 −67.2 15.0 −73.3
12.0 8.0 14.4 −75.7 4.5 −58.5 8.5 −61.3 7.6 −53.0 13.9 −76.3
12.0 10.0 15.6 −71.2 5.1 −58.3 10.4 −69.2 5.8 −57.6 13.0 −71.1
12.0 12.0 17.0 −84.2 6.4 −55.9 12.4 −76.9 4.2 −57.9 12.4 −74.2
12.0 14.0 18.4 −81.8 7.9 −52.1 14.3 −75.2 3.2 −55.3 12.0 −70.8
12.0 15.0 19.2 −84.2 8.7 −64.7 15.3 −76.8 3.0 −54.5 12.0 −72.1
14.0 2.0 14.1 −74.3 8.5 −61.2 2.2 −51.3 13.0 −74.9 19.1 −86.7
14.0 4.0 14.6 −76.2 7.4 −57.0 4.1 −55.0 11.0 −71.0 17.8 −70.3
14.0 6.0 15.2 −78.4 6.7 −60.1 6.1 −60.2 9.1 −60.0 16.6 −78.9
14.0 8.0 16.1 −74.3 6.5 −61.9 8.1 −55.8 7.1 −54.1 15.7 −73.8
14.0 10.0 17.2 −79.0 7.0 −57.2 10.1 −69.3 5.1 −61.7 14.9 −78.1
14.0 12.0 18.4 −81.0 7.9 −54.8 12.0 −73.6 3.2 −56.4 14.3 −77.9
14.0 14.0 19.8 −87.8 9.2 −65.8 14.0 −75.4 1.4 −47.9 14.0 −73.4
14.0 15.0 20.5 −86.7 9.9 −66.5 15.0 −77.2 1.0 −44.2 14.0 −75.2
15.0 2.0 15.1 −76.6 9.3 −69.6 2.0 −46.3 13.0 −74.2 19.8 −86.0
15.0 4.0 15.5 −67.9 8.3 −59.1 4.0 −49.0 11.0 −61.4 18.6 −83.8
15.0 6.0 16.2 −71.3 7.6 −54.3 6.0 −55.2 9.0 −64.9 17.5 −75.6
15.0 8.0 17.0 −75.2 7.5 −54.2 8.0 −56.7 7.0 −57.9 16.6 −78.4
15.0 10.0 18.0 −74.9 7.9 −55.2 10.0 −67.0 5.0 −56.9 15.8 −70.8
15.0 12.0 19.2 −88.1 8.7 −64.4 12.0 −74.7 3.0 −53.4 15.3 −69.5
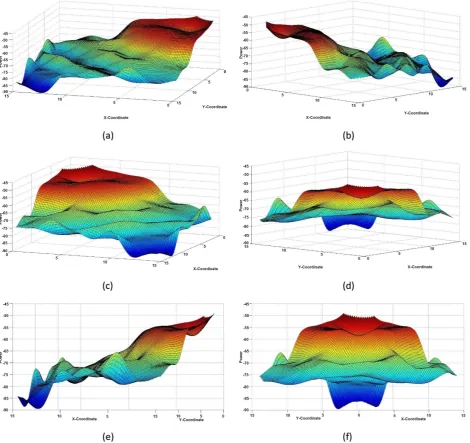
DOI: 10.4236/jsip.2019.102004 52 Journal of Signal and Information Processing Figure 9. Surface plot of Bluetooth Module-1 as seen from (a) (0,15) ft corner, (b) (0,0) ft corner, (c) (15,0) ft corner, (d) (15,15) ft corner, (e) Right side view, (f) Front side view.
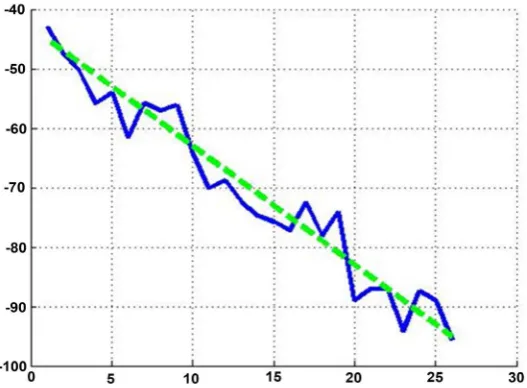
environmental conditions cannot be generated in real life. Thus, to rely com-pletely on the signal strength only, is not possible. The plots generated for Blu-etooth module 1 are shown in Figure 9 for reference. The calibration data of Bluetooth Module-1 is shown in Figure 10, in which the dotted line shows the ideal behavior of the power versus distance, whereas the solid line shows actual data captured while calibrating the module.
6. Conclusions
DOI:10.4236/jsip.2019.102004 53 Journal of Signal and Information Processing Figure 10. RSSI calibration of Bluetooth module-1.
environments, have been discussed in the literature. For the positioning of de-vices, TDOA, TOA and RSS have been widely used for the positioning but nar-row band signals such as Bluetooth cannot efficiently utilize TDOA or TOA and therefore, RSSI to measure RSS, has been found to be more reliable in which measurement estimations depend heavily on the environmental interference.
The RSSI of Bluetooth systems can further be improved by either improving the existing methodologies to implement them or using fusion techniques em-ploying Kalman filters to combine more than one method to improve the results significantly. This paper proposed a new method of measuring RSSI using trila-teration for localization of Bluetooth devices for visually impaired people. To va-lidate the method, class 2 Bluetooth devices were used along with an evaluation board. A software was also developed in National Instruments LabView. The PCB was indigenously designed and manufactured as well.
For the experimental part, five Bluetooth modules were placed on a grid of 15 × 15 feet which acted as receivers whose calibration was already carried out. Surface plots of all the five Bluetooth modules were then generated. In each sur-face plot, strong and weak points of the Bluetooth were shown. It was also hig-hlighted how many environmental conditions like, atmospheric conditions, en-vironmental noise, multipath fading, reflections, etc., can change the required outputs by affecting the actual signal being received at the receiver end. Last but not least, the results were discussed where in it was shown with the help of sur-face and 3D plots, how received signal strength varies with external conditions such as atmospheric conditions, environmental noise, multipath fading, reflec-tions, etc.
Conflicts of Interest
DOI: 10.4236/jsip.2019.102004 54 Journal of Signal and Information Processing
References
[1] Treuillet, S. and Royer, E. (2010) Outdoor/Indoor Vision-Based Localization for
Blind Pedestrian Navigation Assistance. International Journal of Image and
Graph-ics, 10, 481-496.https://doi.org/10.1142/S0219467810003937
[2] Hollinger, K. (2016) O&M for Independent Living: Strategies for Teaching
Orienta-tion and Mobility to Older Adults. Journal of Visual Impairment & Blindness, 110,
33-39.https://doi.org/10.1177/0145482X1611000208
[3] WHO (2007) Visual Impairment and Blindness: Fact Sheet.
http://www.who.int/mediacentre/factsheets/fs282/en
[4] Golledge, R.G., Loomis, J.M., Klatzky, R., Flury, A. and Yang, X.-L. (1991)
Design-ing a Personal Guidance System to Aid Navigation without Sight: Progress on the
GIS Component. International Journal of Geographical Information Systems, 5,
373-395.https://doi.org/10.1080/02693799108927864
[5] Halder, S. and Ghosal, A. (2014) Mobility-Assisted Localization Techniques in
Wireless Sensor Networks: Issues, Challenges and Approaches. In: Koubaa, A. and
Khelil, A., Eds., Cooperative Robots and Sensor Networks 2014, Vol. 554, Springer,
Berlin, 43-64. https://doi.org/10.1007/978-3-642-55029-4_3
[6] Paum, F., Erhardt, S., Weigel, R. and Koelpin, A. (2017) RSSI-Based Localization
with Minimal Infrastructure Using Multivariate Statistic Techniques. IEEE Topical
Conference on Wireless Sensors and Sensor Networks, Phoenix, 15-18 January 2017, 69-72.
[7] Kowalik, R. and Kwasniewski, S. (2004) Navigator—A Talking GPS Receiver for the
Blind. International Conference on Computers for Handicapped Persons, Paris, 7-9
July 2004, 446-449.https://doi.org/10.1007/978-3-540-27817-7_65
[8] Loomis, J.M., Golledge, R.D. and Klatzky, R.L. (2001) GPS-Based Navigation
Sys-tems for the Visually Impaired. Lawrence Erlbaum Associates, Mahwah.
[9] Helal, A., Moore, S.E. and Ramachandran, B. (2001) Drishti: An Integrated
Naviga-tion System for Visually Impaired and Disabled. Proceedings 5th International
Symposium on Wearable Computers, Zurich, 8-9 October 2001, 149-156.
https://doi.org/10.1109/ISWC.2001.962119
[10] Ran, L., Helal, S. and Moore, S. (2004) Drishti: An Integrated Indoor/Outdoor Blind
Navigation System and Service. 2nd IEEE Annual Conference on Pervasive
Compu-ting and Communications, Orlando, 14-17 March 2004, 23-30.
https://doi.org/10.1109/PERCOM.2004.1276842
[11] Na, J. (2006) The Blind Interactive Guide System Using RFID-Based Indoor
Posi-tioning System. In: Miesenberger, K., Klaus, J., Zagler, W.L. and Karshmer, A.I.,
Eds., Computers Helping People with Special Needs, Springer, Berlin, Heidelberg,
1298-1305.https://doi.org/10.1007/11788713_187
[12] Kulyukin, V., Gharpure, C., Nicholson, J. and Pavithran, S. (2004) RFID in
Ro-bot-Assisted Indoor Navigation for the Visually Impaired. IEEE/RSJ International
Conference on Intelligent Robots and Systems, Sendai, 28 September-2 October 2004, Vol. 2, 1979-1984.
[13] Hesch, J.A. and Roumeliotis, S.I. (2007) An Indoor Localization Aid for the Visually
Impaired. Proceedings 2007 IEEE International Conference on Robotics and
Auto-mation, Roma, 10-14 April 2007, 3545-3551.
https://doi.org/10.1109/ROBOT.2007.364021
[14] Rueppel, U. and Stuebbe, K.M. (2008) BIM-Based Indoor-Emergency
DOI:10.4236/jsip.2019.102004 55 Journal of Signal and Information Processing
https://doi.org/10.1016/S1007-0214(08)70175-5
[15] Jeamwatthanachai, W., Wald, M. and Wills, G. (2017) Map Data Representation for
Indoor Navigation by Blind People. International Journal of Chaotic Computing, 4,
70-78.
[16] Wang, Q., Balasingham, I., Zhang, M. and Huang, X. (2011) Improving RSS-Based
Ranging in LOS-NLOS Scenario Using GMMS. IEEE Communications Letters, 15,
1065-1067.https://doi.org/10.1109/LCOMM.2011.080811.111087
[17] Farid, Z., Nordin, R. and Ismail, M. (2013) Recent Advances in Wireless Indoor
Localization Techniques and System. Journal of Computer Networks and
Commu-nications, 2013, Article ID: 185138.https://doi.org/10.1155/2013/185138
[18] Ahn, H. and Yu, W. (2009) Environmental-Adaptive RSSI-Based Indoor
Localiza-tion. IEEE Transactions on Automation Science and Engineering, 6, 626-633.
https://doi.org/10.1109/TASE.2008.2009126
[19] Kriz, P., Maly, F. and Kozel, T. (2016) Improving Indoor Localization Using
Blue-Tooth Low Energy Beacons. Mobile Information Systems, 2016, Article ID:
2083094.https://doi.org/10.1155/2016/2083094
[20] Dabrowski, A., Kardys, P. and Marciniak, T. (2005) Bluetooth Technology
Applica-tions Dedicated to Supporting Blind and Hearing as Well as Speech Handicapped
People. 47th International Symposium ELMAR, Zadar, 8-10 June 2005, 295-298.
https://doi.org/10.1109/ELMAR.2005.193702
[21] Altini, M., Brunelli, D., Farella, E. and Benini, L. (2010) Bluetooth Indoor
Localiza-tion with Multiple Neural Networks. IEEE 5th International Symposium on
Wire-less Pervasive Computing, Modena, 5-7 May 2010, 295-300.
https://doi.org/10.1109/ISWPC.2010.5483748
[22] Millar, S. (1994) Understanding and Representing Space: Theory and Evidence
from Studies with Blind and Sighted Children. Oxford Scholarship Online.
https://doi.org/10.1093/acprof:oso/9780198521426.001.0001
[23] Park, S. and Hashimoto, S. (2009) Autonomous Mobile Robot Navigation Using
Passive RFID in Indoor Environment. IEEE Transactions on Industrial Electronics,
56, 2366-2373.https://doi.org/10.1109/TIE.2009.2013690
[24] Willis, S. and Helal, S. (2004) A Passive RFID Information Grid for Location and
Proximity Sensing for the Blind User. 295-300.
[25] Maneesilp, J., Wang, C., Wu, H. and Tzeng, N. (2013) RFID Support for Accurate
3D Localization. IEEE Transactions on Computers, 62, 1447-1459.
https://doi.org/10.1109/TC.2012.83
[26] Amemiya, T., Yamashita, J., Hirota, K. and Hirose, M. (2004) Virtual Leading
Blocks for the Deaf-Blind: A Real-Time Way-Finder by Verbal-Nonverbal Hybrid
Interface and High-Density RFID Tag Space. IEEE Virtual Reality 2004, Chicago,
27-31 March, 2004, 165-287.https://doi.org/10.1109/VR.2004.1310070
[27] D’Atri, E., Medaglia, C.M., Serbanati, A., Ceipidor, U.B., Panizzi, E. and D’Atri, A.
(2007) A System to Aid Blind People in the Mobility: A Usability Test and Its
Re-sults. Second International Conference on Systems, Sainte-Luce, 22-28 April 2007,
35-35.https://doi.org/10.1109/ICONS.2007.7
[28] Chen, H. and Lin, K. (2011) An Improved Method for Free-Space Antenna-Factor
Measurement by Using the Music Algorithm. IEEE Transactions on
Electromag-netic Compatibility, 53, 274-282.https://doi.org/10.1109/TEMC.2010.2050775
[29] Agarwal, K. and Chen, X. (2008) Applicability of Music-Type Imaging in Two-Di-
DOI: 10.4236/jsip.2019.102004 56 Journal of Signal and Information Processing Propagation, 56, 3217-3223.https://doi.org/10.1109/TAP.2008.929434
[30] Wong, K.T. and Zoltowski, M.D. (2000) Self-Initiating Music-Based Direction
Finding in Underwater Acoustic Particle Velocity-Field Beamspace. IEEE Journal of
Oceanic Engineering, 25, 262-273.https://doi.org/10.1109/48.838989
[31] Henault, S., Antar, Y.M.M., Rajan, S., Inkol, R. and Wang, S. (2008) Impact of
Mu-tual Coupling on Wideband Adcock Direction Finders. Canadian Conference on
Electrical and Computer Engineering, Niagara Falls, 4-7 May 2008, 001327-001332.
https://doi.org/10.1109/CCECE.2008.4564755
[32] Paul, A.S. and Wan, E.A. (2009) RSSI-Based Indoor Localization and Tracking
Us-ing Sigma-Point Kalman Smoothers. IEEE Journal of Selected Topics in Signal
Processing, 3, 860-873.https://doi.org/10.1109/JSTSP.2009.2032309
[33] Ahn, H. and Ko, K.H. (2009) Simple Pedestrian Localization Algorithms Based on
Distributed Wireless Sensor Networks. IEEE Transactions on Industrial Electronics,
56, 4296-4302.https://doi.org/10.1109/TIE.2009.2017097
[34] Ibrahim, M. and Youssef, M. (2012) Cellsense: An Accurate Energy-Efficient GSM
Positioning System. IEEE Transactions on Vehicular Technology, 61, 286-296.
https://doi.org/10.1109/TVT.2011.2173771
[35] Chen, Z., Zou, H., Jiang, H., Zhu, Q., Soh, Y. and Xie, L. (2015) Fusion of Wifi,
Smartphone Sensors and Landmarks Using the Kalman Filter for Indoor
Localiza-tion. Sensors, 15, 715-732.https://doi.org/10.3390/s150100715
[36] Chen, Z., Zhu, Q. and Soh, Y.C. (2016) Smartphone Inertial Sensor-Based Indoor
Localization and Tracking with Ibeacon Corrections. IEEE Transactions on
Indus-trial Informatics, 12, 1540-1549.https://doi.org/10.1109/TII.2016.2579265
[37] Danifis, F. and Cemgil, A. (2017) Model-Based Localization and Tracking Using
Bluetooth Low-Energy Beacons. Sensors, 17, pii: E2484.
https://doi.org/10.3390/s17112484
[38] Wu, K., Xiao, J., Yi, Y., Chen, D., Luo, X. and Ni, L.M. (2013) CSI-Based Indoor
Localization. IEEE Transactions on Parallel and Distributed Systems, 24, 1300-1309.
https://doi.org/10.1109/TPDS.2012.214
[39] Sahu, P.K., Wu, E.H. and Sahoo, J. (2013) Durt: Dual RSSI Trend Based
Localiza-tion for Wireless Sensor Networks. IEEE Sensors Journal, 13, 3115-3123.
https://doi.org/10.1109/JSEN.2013.2257731
[40] Chen, Y., Lymberopoulos, D., Liu, J. and Priyantha, B. (2013) Indoor Localization
Using FM Signals. IEEE Transactions on Mobile Computing, 12, 1502-1517.
https://doi.org/10.1109/TMC.2013.58
[41] Miller, B.A. and Bisdikian, C. (2000) Understanding and Representing Space:
Theory and Evidence from Studies with Blind and Sighted Children. Prentice
Hall, Upper Saddle River.
[42] Cheung, K.C., Intille, S.S. and Larson, K. (2006) An Inexpensive Bluetooth-Based
Indoor Positioning Hack.
[43] Diaz, J.J.M., Maufies, R.d.A., Soares, R.B., Nakamura, E.F. and Figueiredo, C.M.S.
(2010) Bluepass: An Indoor Bluetooth-Based Localization System for Mobile
Ap-plications. The IEEE Symposium on Computers and Communications, Riccione,
22-25 June 2010, 778-783.https://doi.org/10.1109/ISCC.2010.5546506
[44] Hossain, A.K.M.M. and Soh, W. (2007) A Comprehensive Study of Bluetooth Signal
Parameters for Localization. IEEE 18th International Symposium on Personal,
In-door and Mobile Radio Communications, Athens, 3-7 September 2007, 1-5.
DOI:10.4236/jsip.2019.102004 57 Journal of Signal and Information Processing
[45] Feldmann, S., Kyamakya, K., Zapater, A. and Lue, Z. (2003) An Indoor
Blu-etooth-Based Positioning System: Concept, Implementation and Experimental
Evaluation. International Conference on Wireless Networks, Las Vegas, 23-26 June
2003, 109-113.
[46] Li, D. and Wang, J. (2009) Research of Indoor Local Positioning Based on Bluetooth
Technology. 5th International Conference on Wireless Communications,
Network-ing and Mobile ComputNetwork-ing, New York, 24-26 September 2009, 1-4.
https://doi.org/10.1109/WICOM.2009.5302300
[47] Bohonos, S., Lee, A., Malik, A., Thai, C. and Manduchi, R. (2007) Universal
Real-Time Navigational Assistance (URNA): An Urban Bluetooth Beacon for the
Blind. In: Proceedings of the 1st ACM SIGMOBILE International Workshop on
Systems and Networking Support for Healthcare and Assisted Living Environments,
ACM, New York, 83-88.https://doi.org/10.1145/1248054.1248080
[48] Liu, X., Makino, H., Kobayashi, S. and Maeda, Y. (2007) Design of an Indoor
Self-Positioning System for the Visually Impaired-Simulation with RFID and
Blu-etooth in a Visible Light Communication System. 29th Annual International
Con-ference of the IEEE Engineering in Medicine and Biology Society, Lyon, 22-26
Au-gust 2007, 1655-1658.https://doi.org/10.1109/IEMBS.2007.4352625
[49] Pathak, O., Palaskar, P., Palkar, R. and Tawari, M. (2014) Wifi Indoor Positioning
System Based on RSSI Measurements from Wifi Access Points—A Tri-Lateration