doi:10.4236/health.2011.38078
Copyright © 2011 SciRes. Openly accessible at http://www.scirp.org/journal/HEALTH/
Using of spectral analysis of heart rate variability for
increasing reliability of bicycle ergometry results
Vladimir Ivanovich Gridnev, Anton Robertovich Kiselev, Olga Mikhailovna Posnenkova, Vladimir Alexandrovich Shvartz
Centre of New Cardiological Informational Technologies, Saratov Research Institute of Cardiology, Saratov, Russia;
[email protected], [email protected]
Received 18 November 2010; revised 25 April 2011; accepted 18 June 2011.
ABSTRACT
The aim was to study the suitability of the heart rate variability (HRV) spectral parameters for evaluations of bicycle ergometry results in coronary heart disease (CHD) patients. Methods. Our study included 243 male CHD patients aged 49±8 years. The coronary atherosclerosis was assessed by coronary angiography. The results of bicycle ergometry, Doppler echocardio- graphy and HRV spectral analysis were also analyzed. The duration of each stage of bicycle ergometry was 3 min, the initial load value was 25 W. Dynamic load continued until the patient had reached 75% of heart rate from his maximal age level. The maximal level of load achieved (i.e. load tolerance) was taken into conside- ration. We calculated sensitivity (Se), specificity (Sp), likelihood ratios of positive (LR+) and negative (LR–) bicycle ergometry results. Re- sults. All patients had similar clinical chara- cteristics. LR+ become maximal under the moderate load tolerance. LR- are maximal in the CHD patients with high load tolerance. Thus, the excessiveness of false-negative results of bi- cycle ergometry is in CHD patients with high load tolerance. Reliability of results of bicycle ergometry increased under using assessments of low-frequency (LF) range power of HRV spectrum. Conclusions. Thus,the using of LF range power of HRV spectrum increases relia- bility of bicycle ergometry (or other load tests) results in CHD patients.
Keywords: Heart Rate Variability; Bicycle Ergometry; Coronary Heart Disease
1. INTRODUCTION
Submaximal exercise tests are most frequently used in diagnosis of coronary heart disease (CHD). But the sen-
sitivity (Se) and specificity (Sp) of these kind of tests are limited [1]. Defining the conditions under which exer- cise tests may produce both true and false results, is an important task of applied cardiology.
It was shown that the heart rate variability (HRV) pa- rameters turned out to be sensitive indicator of a myo- cardial and coronary status in CHD patients [2,3]. The model of heart control based on a baroreflex feedback loop [4-8] has great importance for researches of auto- nomic heart control. This model explains an origin of low-frequency (LF) component of HRV [9-15]. Thus, LF range of HRV spectrum is of the interest for evaluation of autonomic heart control in CHD patients during load tests.
The aim was to study the suitability of HRV spectral parameters for evaluations of bicycle ergometry results in CHD patients.
2. METHODS
2.1. Subjects
The study was approved by the Ethics Committee of the Saratov Research Institute of Cardiology in Saratov, Russia, and informed consent was obtained from all par- ticipants. Our study included 243 male CHD patients aged 49 ± 8 years. 132 CHD patients had acute myocar- dial infarction six months prior to the start of the study. Pathological Q-wave on electrocardiogram (ECG) was observed in 67 CHD patients. Angina pectoris of I-II functional classes was observed in 86 CHD patients and 120 CHD patients had angina pectoris of III-IV func- tional classes. 59 CHD patients had arterial hyperten- sion.
We excluded from the study CHD patients with renal pathology, valves heart disease, rhythm and conduction disorders hindering the HRV analysis.
2.2. Measurements and Protocol
). tive coronary angiography in all CHD patients. The se-
verity of coronary atherosclerosis was assessed in ac- cording with the degree of maximal stenosis of coronary arteries (no less 75%). Bicycle ergometry results, Dop- pler echocardiography results and HRV spectral analysis were also estimated.
Systolic and diastolic sizes of heart left ventricle, ejection fraction of the left ventricle (EF), the velocity of circumferential fiber shortening (Vcf), isovolumetric relaxation time (IRT) and the condition of the left ven- tricle local contractility were determined by Doppler echocardiography.
Bicycle ergometry were performed by stepwise in- creasing load under electrocardiography (ECG) moni- toring. The initial load was 25 W. Bicycle ergometry continued till each CHD patient reached 75% of maxi- mal heart rate level [16]. In case of ST segment depres- sion no less 2 mm in one ECG lead during bicycle er- gometry, this load test results were considered to be po- sitive. Bicycle ergometry result was considered negative if CHD patient either reached 50% of maximal heart rate level at the highest point of load or performed load of no less 150 W during 3 minutes without any criteria of test cessation. CHD patients with other causes of test cessa- tion were not included in this study. The maximal level of load achieved (i.e. load tolerance) was assessed. All CHD patients have stopped the treatment with nitrates (24 hours prior) and beta-blockers (3 - 7 days prior) be- fore bicycle ergometry.
ECG recorded during 3 min both for rest and load of 25 W during bicycle ergometry. ECG signal was sampled at 250 Hz and digitized at 14 bits. For further analysis were only ECG and PPG records without artifacts, ex- trasystoles and considerable trends were left. ECG signal had been recorded between 13 and 15 hours.
2.3. Statistical and Data Analysis
Spectral characteristics of HRV were calculated using parametric method of spectrum estimation based on 14 order autoregression model construction. High-frequency (HF) range, 0.15 - 0.4 Hz, and LF range, 0.04 - 0.15 Hz, of HRV were analysed [17].
Sensitivity (Se), specificity (Sp), likelihood ratios of positive (LR+) and negative (LR-) bicycle ergometry results were estimated.
For a statistical analysis the software package Statis- tica 6.1 was used. We apply the Shapiro–Wilk test to check whether the HRV spectral data are approximately normally distributed. Since these data occur to be non- normal their further analysis was carried out using non- parametric statistical methods. To compare the variables we used the Mann–Whitney test. Continuous variables are reported as medians (Me) with inter-quartile ranges
(25%, 75%). Categorical data are presented as frequen- cies and percentages. The obtained estimations were considered statistically significance if P < 0.05.
3. RESULTS AND DISCUSSION
CHD patients have been classified in two groups, ac-cording to bicycle ergometry results:
First group included 125 CHD patients (aged 50 ± 7 years) with positive bicycle ergometry results, Second group included 118 CHD patients (aged 47 ±
8 years) with negative bicycle ergometry results. It was shown that both CHD patient’s groups had similar clinical characteristics (age, sex, frequency of myocardial infarction, arterial hypertension, EF, systolic and diastolic sizes of heart left ventricle, etc.
The group of CHD patients with positive bicycle ergo- metry results differed from the group with negative re- sults in following characteristics: 1) less load tolerance by 36% (P < 0.001); 2) more clinically severe angina pectoris: 56% of CHD patients had III-IV functional class of angina and only 30% patients had angina of I-II functional class (versus 36% and 42% respectively in CHD patients with the negative bicycle ergometry re- sults).
For the further analysis all CHD patients were divided into three groups according to the load tolerance level: low level (<75 W), moderate level (75 - 125 W), high level (>125 W). It is theoretically supposed that the load tolerance correlates with coronary atherosclerosis degree. These groups of patients had similar clinical characteristics. Frequency of positive bicycle ergometry results was greater in group of CHD patients with low load tolerance in comparison with other groups (P = 0.003). Angina was principal cause of bicycle ergometry cessation in the group of patients with low tolerance. Frequency of ECG ischemic changes was greater in the group of CHD patients with high tolerance (77%) than in groups with moderate (64%) and low (41%) tolerance levels.
Frequency of significant coronary arteries stenosis decreased reliably under increase of the load tolerance in these patients groups (Table 1). In the group of CHD patients with high load tolerance, frequency of signifi- cant coronary arteries stenosis decreased 1.7 times (р < 0.001) in compare with the group with low tolerance, and it decreased in 1,5 times (р = 0.02) in group with high tolerance compared with group of patients with moderate tolerance (р = 0.03). It is shown that Se of bi-cycle ergometry worsens under the decrease of load tol-erance in CHD patients (Table 1).
Copyright © 2011 SciRes. Openly accessible at http://www.scirp.org/journal/HEALTH/ Table 1. Coronary atherosclerosis in CHD patients with diffe-
rent load tolerance. Dependence of bicycle ergometry sensitiv- ity (Se) and specificity (Sp) from load tolerance in these pa- tients.
Indices
Low tolerance level (<75 W)
n = 54
Moderate tolerance level
(75 - 125 W) n = 113
High tolerance level
(>125 W) n = 59 Coronary artery
stenosis, % of CHD patients
78 71 47
Se, % 93 69 29
Sp, % 25 79 81
gometry results (Figure 1). CHD patients with negative test results had level of autonomic heart control differing from CHD patients with positive results in presence of similar clinical and instrumental status and coronary atherosclerosis. LF and HF ranges power of HRV spec-trum was greater in CHD patients with the negative bi-cycle ergometry results than in other groups.
Load tolerance and HRV spectral parameters corre- lated with negative bicycle ergometry results under rest in CHD patients; multiple correlation coefficient was 0,41 (р = 0,004). In group of CHD patients with positive test results there was no correlation between the HRV spectral parameters and load tolerance (P = 0.26).
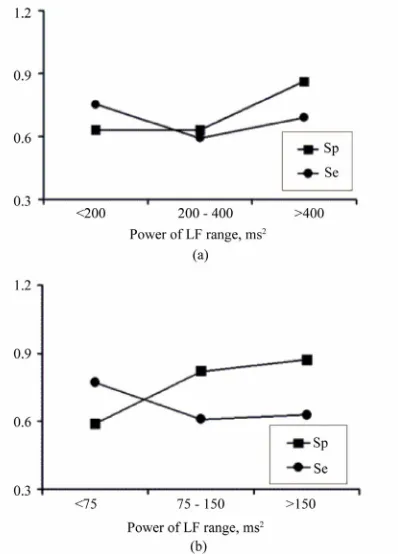
These distinctions of LF range became a basis for im- provements of diagnostic effectiveness of bicycle ergo- metry. Using the load of 25 W allows supposing auto- nomic heart control to be in some functional activity. This fact is a way of condition standardization for using of HRV spectral analysis. Three ranges of LF power were chosen in all CHD patients. They were the follow- ing for the rest: <200 ms2, 200 - 400 ms2, >400 ms2. And they were the following for 25 W load: <75 ms2, 75 - 150 ms2, >150 ms2. The range intervals correspond to 33% and 66% percentiles of values in the sample of the examined patients, i.e. about one third of all CHD pa- tients are presented in each group. It is shown that bicy- cle ergometry is of the most diagnostic value under LFrest > 400 ms2 and LF
25 W >150 ms2. In these cases, sum of
[image:3.595.57.286.126.224.2] [image:3.595.326.525.409.686.2]Se and Sp is maximal (Figure 2). Thus, for increase a reliability of bicycle ergometry in CHD patients It is possible to use LF range spectral power, it is applied especially for positive bicycle ergometry results (Figure 3). This concerns both standard bicycle ergometry pro- cedure and analysis of bicycle ergometry results taking into account load tolerance (Tables 2 and 3). Positive results of bicycle ergometry in CHD patients are more reliable under moderate load tolerance and LF25 W > 150 ms2. Otherwise a diagnostic effectiveness of bicycle ergometry decreases. Reliability of negative bicycle er- gometry results is maximal under high load tolerance, independently of LF range power of HRV spectrum.
Figure 1. HRV indices in CHD patients with positive
and negative bicycle ergometry results in rest (a) and load of 25 W (b).
Figure 2. Assessments of Se and Sp of bicycle
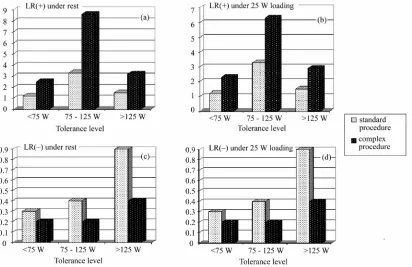
Figure 3. Likelihood ratio (LR) of standard procedure of bicycle ergometry results interpretation and likelihood ratio
[image:4.595.56.287.444.559.2](LR) of complex assessment of bicycle ergometry results (tolerance level and the power of LF range of HRV spec-trum) under the rest and 25 W loading. (a) LR(+) under rest; (b) LR(+) under 25 W loading; (c) LR(–) under rest; (d) LR(–) under 25 W loading.
Table 2. Likelihood ratio (LR) the bicycle ergometry results in
CHD patients for the LF range spectral power of HRV under the rest.
Probability of false-negative bicycle ergometry out- comes keeps on the level of standard procedure of test- ing results evaluation. It follows from this that any nega- tive test result is characterized by low reliability and thus could not be used for the assessment of the severity of coronary pathology. It agrees with the European Asso- ciation of Cardiology data showing that probability of CHD in a 65 years patient with true angina is more, then 75% even if the bicycle ergometry showed a negative result [18]. At the same time, the reliability of positive bicycle ergometry results could be assessed taking into consideration the load tolerance and the spectral power in LF range of HRV. As a criterion of the diagnostic value of the test results the likelihood ratio (LR) index could be used. This index gives direct knowledge of the probability of CHD in the presence of a positive or nega- tive physical load test outcome. In the clinic of Saratov Institute of Cardiology LR+ values no less then 5 were used as a threshold for the positive result of exercise testing and LR– values less then 0.2 were used for the negative one. In the case of exceeding the likelihood ratio threshold values it is possible to consider that an exercise test result reliably conform to the clinical pic- ture of illness. Otherwise, if LR values do not exceed the threshold ones, then a stress test result could be consid- ered unreliable.
Load tolerance (W) LF range spectral
power, ms2
<75 75 125 >125 Positive result of bicycle ergometry
<200 ms2 3.1 8.6 3.9
200 400 ms2 2.5 6.9 3.2
>400 ms2 5.3 14.5 6.6
Negative result of bicycle ergometry
<200 ms2 0.2 0.2 0.4
200 400 ms2 0.2 0.2 0.5
>400 ms2 0.2 0.2 0.4
Table 3. Likelihood ratio (LR) of bicycle ergometry results in CHD patients for the LF range spectral power of HRV under 25 W loading.
Load tolerance (W) LF-range spectral
power, ms2
<75 75 125 >125 Positive result of bicycle ergometry
<75 ms2 2.3 6.3 2.9
75 150 ms2 4.1 11.2 5.1
>150 ms2 5.8 15.8 7.2
Negative result of bicycle ergometry
<75 ms2 0.2 0.2 0.4
75 150 ms2 0.2 0.2 0.5
[image:4.595.55.286.606.721.2]Copyright © 2011 SciRes. Openly accessible at http://www.scirp.org/journal/HEALTH/ The approach offered allows to determine bicycle er-
gometry result reliability in cases of positive or negative results of the test individually in each patient and de- crease possibility of diagnostic mistakes. Limitations of the method offered for CHD diagnostics are initial heart rate increase (heart rate more then 100 beats per minute) and impossibility to obtain suitable for the spectral an- alysis bicycle ergometry rhythmograms due to noise and artifacts presence.
4. CONCLUSIONS
Thus, the analysis of spectral power of LF range of HRV allows to advance diagnostic value of bicycle er- gometry results in CHD patients. It is necessary to use a complex assessment of bicycle ergometry results taking into account the load tolerance level and a power of LF range of HRV spectrum. Combined use of the load tol- erance and LF range spectral power levels (in rest and during 25 W loading) the validity of an individual exer- cise raises 2 - 3 times (in particular, bicycle ergometry) test result compared with standard procedure of the bi- cycle ergometry results analysis in CHD patients.
Table 2 can be used for preliminary assessment of the bicycle ergometry results especially in CHD patients with low levels of LF range spectral power (<400 ms2). Further the obtained value of likelihood ratio can be specified with the help of Table 3. Table data are con- structed for CHD patients with hemodynamically sig- nificant atherosclerotic stenosis at least one coronary vessel (stenosis degree >50% according to data of coro- narography).
REFERENCES
[1] European Society of Cardiology (1993) Guidelines for cardiac exercise testing: ESC working group on exercise physiology, physiopathology and electrocardiography.
European Heart Journal, 14, 969-988.
[2] Porta, C. and Bernardi, L. (2001) Interaction between respiration, autonomic function, and respiratory pattern inheart failure. New possibilities of rehabilitation inter-vention. Italian Heart Journal, 2, 624-627.
[3] Juhani, K.E., Marku, J.I., Heikki, V.H., et al. (1993)
Re-sponses of heart rate variability to coronari occlusion during coronari angioplasty. American Journal of Cardi-ology, 72, 1026-1030.
doi:10.1016/0002-9149(93)90857-9
[4] De Boer, R.W., Karemuker, J.M. and Stracker, J. (1986) On the spectral analysis of blood pressure variability.
American Journal of Physiology, 251, 685-687.
[5] De Boer, R.W., Karemuker, J.M. and Stracker, J. (1985) Relationships between short-term blood pressure fluctua-tions and heart variability in resting subjects. II: A simple model. Medical & Biological Engineering & Computing,
23, 359-364.doi:10.1007/BF02441590
[6] De Boer, R.W., Karemuker, J.M. and Stracker, J. (1985) Relationships between short-term blood pressure fluctua-tions and heart variability in resting subjects. I: A spectral analysis approach. Medical & Biological Engineering & Computing, 23, 352-358.doi:10.1007/BF02441589
[7] De Boer, R.W., Karemuker, J.M. and Stracker, J. (1987) Hemodynamic fluctuations and baroreflex sensitivity in humans: A beat-to-beat model. American Journal of Physiology, 253, 680-687.
[8] Madwed, J.B., Albrecht, P., Mark, R.G. and Cohen, R.J. (1989) Low-frequency oscillation in arterial pressure and heart-rate: A simple computer model. American Journal of Physiology, 256, 1573-1579.
[9] Pagani, M. and Malliani, A. (2000) Interpreting oscilla-tions of muscle sympathetic nerve activity and heart rate variability. Journal of Hypertension, 18, 1709-1719.
doi:10.1097/00004872-200018120-00002
[10] Sleight, P., La Rovere, M.T., Mortara, A., et al. (1995)
Physiology and pathophysiology of heart rate variability in humans: is power spectral analysis largely an index of baroreflex gain? Clinical Science, 88, 103-109.
[11] Richter, D.W. and Spyer, K.M. (1990) Cardiorespiratory control. Oxford University Press, New York.
[12] Cevese, A., Grasso, R., Poltronieri, R. and Schena, F. (1995) Vascular resistance and arterial pressure low-fre- quency oscillations in the anesthetized dog. American Journal of Physiology, 268, 7-16.
[13] Whittam, A.M., Claytont, R.H., Lord, S.W., et al. (2000)
Heart rate and blood pressure variability innormal sub-jects compared with data from beat-to-beat models de-veloped from de Boer’s model of the cardiovascular sys-tem. Physiological Measuremen, 21, 305-318.
doi:10.1088/0967-3334/21/2/310
[14] Bernardi, L., Passino, C., Spadacini, G., et al. (1997)
Arterial baro-receptor as determinants of 0.1 Hz and res-piration-related changes in blood pressure and heart rate spectra. IOS Press, Amsterdam.
[15] Simon, C.M. (2002) Neural influeces on cardiovascular variability: Possibilities and pitfalls. The American Physiological Society, 282, 6-20.
[16] Andersen, K., Shephard, R., Denolin, H., et al. (1979) Fundamentals of exercise testing. WHO, Geneva. [17] American Heart Association (1996) Heart rate variability.
Standarts of measurement, physiological interpretation and clinical use. Circulation, 93, 1043-1065.
doi:10.1161/01.CIR.93.5.1043